MATIC.USD (SHORT-TERM)Hello friends.
How are you today?
It's the second analysis that I publish today.
Many users asked me to talk about Matic for Short-Term
So I decided to talk about that briefly.
I use Gann Fan and Ichimoko and the time frame is Weekly.
According to the data, the price still respects the Gann Fan's line. It looks nice.
Also, I use ichimoko too.
Based on Ichimoku the price is below the Tenken-sen and Kijun-sen, the future cloud is still bearish and the Chiko span is below the Candles.we had a negative swsitch between tenkensen and Kijunsen. It means we are still in a bearish trend. and the time shows us about 2-3 weeks later, the price will touch the purple line (1/3)
Also, the price action tells us the first support zone could rescue the price against more drops. As a result, I expect that the price will drop to 0.42 USD first and if this support zone could not prevent more dropping, we should see the price in the second support zone.
But in the long-term, I expect more dropping, minimum to second support zone.
So, we have to be patient and see what will happen…
Please don’t forget to write your comments ✍️✍️ Like 👍👍 and Share 👌👌 this Vision with your friends.
Have a good day
Ho3ein.mnD
Maticusd

MATIC's Market ResilienceOn October 12, 2023, MATIC is priced at $0.5090, holding strong in a shaky market. Polygon (MATIC) has caught the market's attention mainly because of its Layer 2 scaling solution for Ethereum. This has led to increased interest from institutions, new partnerships, and a positive outlook in the crypto market, propelling a 57% growth since the start of 2023.
Most Probable Scenario:
The technical analysis for MATIC shows mixed signals with both bullish and bearish outlooks. On one hand, the inability to reclaim the 50-day EMA has triggered a sell-off, hinting at a potential test of the crucial $0.49 support level. Additionally, a possible bearish flag pattern suggests a further decline towards the $0.50 mark. On the other hand, Elliott Wave analysis presents a bullish outlook, hinting at potential upward movement in the near term.
MATIC's price behavior has shown similarities to Ethereum's past price action, suggesting a possible strong rally in 2023 if this pattern holds. Like Ethereum, MATIC's price was positively impacted by a bearish reversal on the U.S. Dollar (DXY), which could play a significant role in its future price movement.
In the short term, analysts project a price of $0.54246 by October 12, 2023, and $0.745609 by October 14, 2023. However, the general sentiment is leaning towards a bullish outlook for MATIC in 2023, especially if it continues to follow a similar pattern to Ethereum.
This analysis brings together a range of technical and fundamental factors that could affect MATIC's price. Continuous monitoring of market dynamics, particularly the U.S. Dollar trend and Ethereum's performance, alongside MATIC's fundamental developments, will offer a clearer understanding of its future price trajectory.

MATIC Faces Rain 🌧️, Next 24 Hours Bearish Cloudy ☁️, rainy 🌧️, and even stormy ⛈️ trading conditions lie ahead in the next 24 hours. This translates into a bearish market with downside risk for cryptocurrencies. Particularly Polygon, Ether, Cardano, and Polkadot may come under pressure.
Over a one-week horizon, the bearish trend will continue to linger over the crypto universe with Bitcoin being the notable exception. Slightly bullish sun ☀️ will shine over the world’s largest cryptocurrency with a possible upside in its price over this longer time horizon, ATTMO forecasts show.
Follow us for more crypto weather reports!

MATIC - Elliott Wave Overview ✅Here we have the 2week chart of MATIC. We can see that we're in a clear bullish motive wave.
We are currently in wave 4 which appears to be a complex ABC wave.
We are looking for subwave c move higher to complete wave B.
Trade Idea:
- Entry on red trendline break
- stops below the lows once trendline breaks
- Targets: 1, 1.4, taper
Goodluck and as always, trade safe!

MATICUSD ❕ divergenceTD Sequential has formed a reversal signal down (30m TF)
The price is working off the formed divergence.
I think that MATIC will continue to decline.

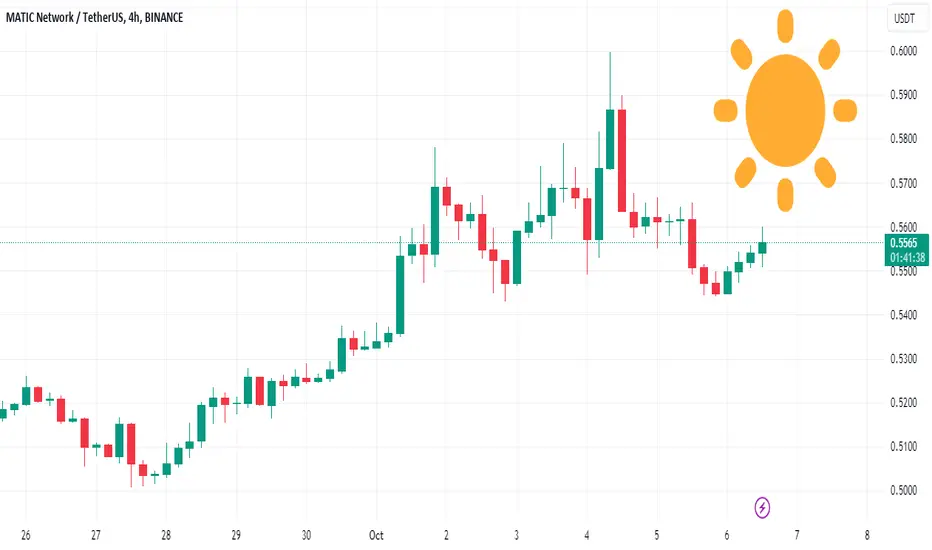
MATIC Bullish 24-Hours and One-Week Horizon ☀️Bearish clouds ☁️ weigh on the global crypto market in the next 24 hours, signaling a downside risk. However, Cardano, Avalanche and Polygon face more lenient trading conditions, with ATTMO indicating some slightly bullish sun. ☀️
Over a one-week horizon, this slightly bullish sun is set to shine over both major cryptocurrencies – Bitcoin and Ether. ☀️ This upward trend is forecast to be even stronger for Cardano, Avalanche and Polygon.
Other coins, including Litecoin, Ripple, Binance Coin, Dogecoin and Polkadot won’t profit from this sun and will continue to face slightly bearish clouds. ☁️
Follow us for more crypto weather reports!

MATIC/USDT 1DAY UPDATE BY CRYPTOSANDERS !!Hello friends, welcome to this MATIC/USDT update from Crypto Sanders.
Chart Analysis:- Polygon (MATIC) rose for a back-to-back session on Wednesday, hitting a multi-week high in the process.
MATIC/USD moved to an intraday high of 0.5937 in today’s session, which comes following a low of 0.5523 the day before.
This resulted in the polygon climbing to its highest point since August 29, when the price peaked at 0.6355.
the surge saw the relative strength index (RSI) rise past a ceiling at the 62.00 zone.
the index is now at a reading of 62.76, with an upcoming resistance level at the 70.00 point.
A crossover between the 10-day (red) and 25-day (blue) moving averages also seems to be one of the reasons for today’s rally.
I have tried to bring the best possible results in this chart.
If you like it, hit the like button and share your charts in the comments section.
Thank you.

MATICUSD This Double Bottom can finally break the WedgePolygon / MATICUSD is rallying off a Double Bottom but still remains inside a giant Falling Wedge pattern.
Double Bottoms are generally how big rallies start and this may be no different. Especially since the 1day RSI is on a Bullish Divergence.
This can break the Falling Wedge to the upside. Buy only after the break out and target the Fibonacci 2.0 level at 0.81000.
Follow us, like the idea and leave a comment below!!

Matic to 0.35?Matic got support at 0.50 area and formed Double Bottom pattern which means we might see some green candles next few days or weeks. But remember Double Bottom's neck is at 0.55 and must close a candle above it in 1D and 1W TF. Our main target is 0.59 and we can see Matic to go up till the white line which is closest crucial zone to hold downtrend but if candle close above it (white line) we wait again for perfect entry point. And our main TP area will be 0.35.

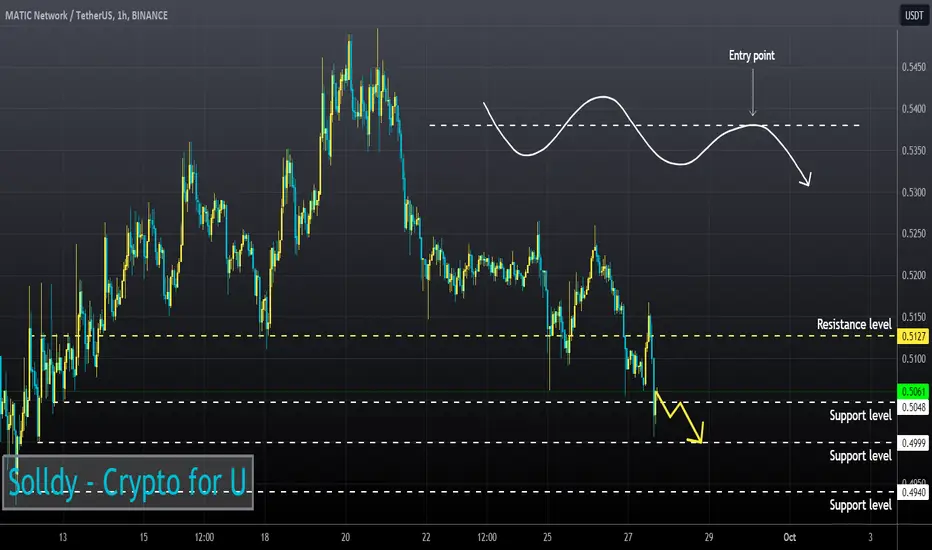
MATICUSD ❕ fixed under the supportMATIC fixed under the support level, which now acts as resistance.
Price has fixed under the 50EMA (1H TF)
I expect that the asset will continue to decline.
Matic: Sell in May and go away 🐻⁉️📆 We can see that the month of May is a crucial month.
The range contained in the 🟥 red rectangle has already been tested several times, and in May last year we had a sharp drop.
Here we are again in the month of May, on top of that range.
Will it fall again? I don't know.
But if it drops again, I would bet on a drop to some Fibonacci region drawn on the chart, and after any reversal signals I would look for an entry.
But before that, I believe that there will be a spike in the rise, and depending on the context, it will not even fall as expected. Just having a crystal ball to know.
🔎 Doing a complementary analysis using on-chain data, we can see that Uniswap's liquidity pools suffered a relevant decrease in the month of May:
🔎 And the total trade volume on Uniswap (in USD) also has this setback:
🔎 Another item that I found interesting to point out, looking at the on-chain data, is the "New address created with non-zero starting balance" in the blockchain, which broke down an important level:
🟢 Despite everything, I remain bullish.
It's not because the last month of May was bad that we will necessarily now have a bad month too.
The last three arrows in the red rectangle indicate that there was a test in this region, and the price did not break down, which could indicate that at least we will have a rebound if there is a stronger drop.
Another thing to note is that the TVL (Total Value Locked) in blockchain seems to be showing signs of reversing:


MATICUSD ❕ rebound from supportTD Sequential formed an up reversal signal (4H TF)
MATIC fixed above 50EMA (4H TF)
RSI is in the buying zone.
The asset will continue to grow after overcoming the resistance level.

Matic strong rejection and 50% crash incoming CRYPTOCAP:MATIC :: #futuretrade sell short ↘️
#dyor #nfa short ⏰ period analysis 📌
Recommend leverage cross 3_4x 💰 1%
Buy :: $0.7-0.766
Sell :: $0.61-0.51
#SL :: $0.8177 ( day close )

MATIC Faces ☁️ - Downside Risk. Short Opportunity? 🤔Bullish sun shines over the global crypto market in the next 24 hours. ☀️ Some altcoins such as MATIC, XRP, and Avalanche do, however, face some ☁️ and a slight downside risk.
Over a one-week horizon, ☁️ and rainy trading conditions can be expected, signaling a bear market for most of the crypto universe, MATIC included. Binance, Polkadot, and Chainlink won’t be affected, according to ATTMO, which forecasts ☀️ over this longer period.
Follow us for more crypto weather reports!

MATIC Polygon Price Target after Court approves FTX LiquidationGiven the recent developments in the crypto space, there are several factors that point towards a bearish outlook:
FTX Liquidation of $3.4 Billion in Crypto Assets: The approval by the Delaware Bankruptcy Court for FTX to liquidate $3.4 billion in crypto assets is a significant event. This influx of a substantial amount of cryptocurrency into the market could potentially lead to an oversupply situation. When a large amount of assets is dumped into the market at once, it can put downward pressure on prices.
Limited Sales in the First Week: The imposed limit of $50 million for the first week indicates a controlled release of these assets. This may imply that FTX anticipates potential market disruption if a large volume is sold at once. However, even with controlled release, the market could still experience downward pressure.
Potential for Increased Limits: The provision for increasing the limit with the approval of the creditors’ committee and ad hoc committee, or potentially even up to $200 million weekly with court approval, shows that there's room for further selling pressure in the coming weeks.
Binance US CEO Resignation: The resignation of Binance US President and CEO, Brian Shroder, could potentially signal internal challenges within the exchange. Leadership changes in major crypto exchanges can lead to uncertainty and can impact market sentiment.
Asset List: The assets listed for liquidation include some of the major cryptocurrencies in the market such as Bitcoin, Ethereum, WBTC, WETH, USDT, SOL, XRP, STG, APT, BIT, DOGE, MATIC, FTT, TON and more. If a significant portion of these assets are sold off, it could have a widespread impact on the market.
Market Sentiment and Confidence: These events combined might lead to a loss of confidence in the crypto market, especially if investors perceive them as signs of instability or potential oversupply.
Regulatory Considerations: The fact that a bankruptcy court is involved in this process highlights the regulatory environment surrounding cryptocurrencies. Heightened regulatory scrutiny or intervention can have a dampening effect on the market.
Considering the above, my Price Target for MATIC Polygon is $0.41.
Looking forward to read your opinion about it.

MATICUSDT IdeaAn idea for MATIC suggesting a bullish recovery at the secondary support level in dashed line.
Strongest support would be also good.
The secondary support coalesces with a horizontal support so it would be nice to see strong reversal there.
I am very bullish on MATIC.

MATIC: The ride to 0.5$ may begin soon!Given the anticipated downward trajectory of BTC from its current levels, the price of MATIC will likewise experience a decline. Ant it has become more evident as the price has undergone four retests at the lower boundary of the triangle, indicating a potential greater downward movement soon!
Consequently, a break to the downside is expected, and it may be prudent to adopt a wait-and-observe approach for more favorable pricing opportunities.
It's said that one day, the mighty MATIC will set its course for the moon, but for now, it seems to be headed back down to Earth! Keep your eyes peeled and your senses sharp, as this journey promises to be a wild ride filled with unexpected twists and turns! :)

MATICUSD ❕ upward channelMATIC has fixed above 50EMA on the 4H TF.
RSI is near neutral values.
TD Sequential formed an upward reversal signal on 1H TF.
I believe that the price will continue to rise if it holds the channel.

$MATIC long to $4.46?CRYPTOCAP:MATIC looks to be bottoming and forming a wedge on HTF. If this breaks up, I think it's likely that the upper target of $4.46 could get hit.
Let's see how it plays out.

Matic Ascending pattern | Horizontal ResistanceJoin us in this video as we analyze the MaticUSDT trading pair and highlight the exciting developments taking place. MaticUSDT is currently forming an ascending triangle pattern, with a horizontal resistance level at $0.89.
In this insightful analysis, we explore the potential outcomes based on different scenarios. If the resistance at $0.89 is successfully broken, we could expect the price of Matic to reach around $0.95. This breakout could signal a bullish trend and present potential buying opportunities for traders.
However, it's essential to consider the other side of the coin. If the lower trendline support, located at $0.85, is breached, it may indicate a short call, suggesting a bearish trend reversal.
Stay tuned as we delve deeper into the technical aspects, chart patterns, and key levels to watch in MaticUSDT trading. Enhance your understanding of this market and gain valuable insights for your trading strategies.
Don't miss out on this informative video that covers the analysis of MaticUSDT and provides actionable information for traders and crypto enthusiasts. Stay informed, make well-informed decisions, and navigate the dynamic world of cryptocurrency with confidence!
#MaticUSDT #CryptoTrading #TechnicalAnalysis #AscendingTriangle #ResistanceLevel

