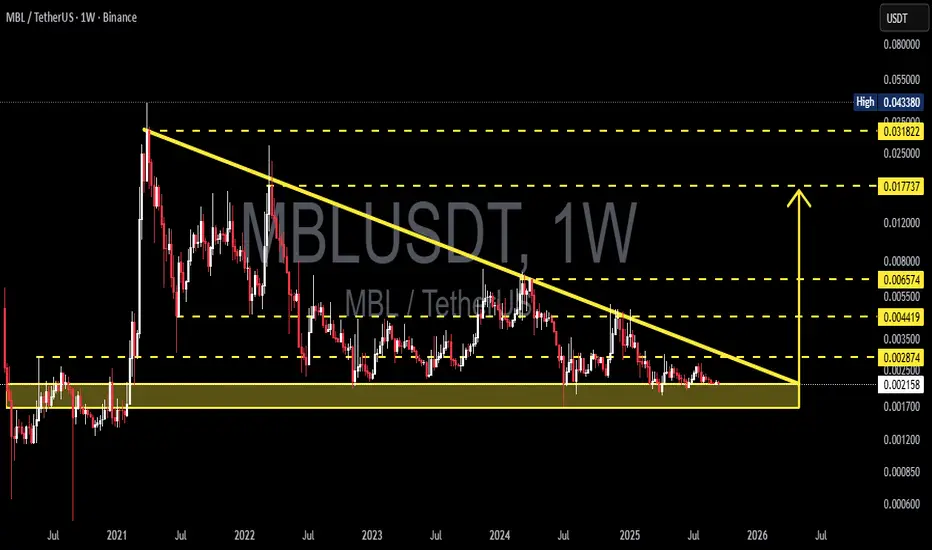
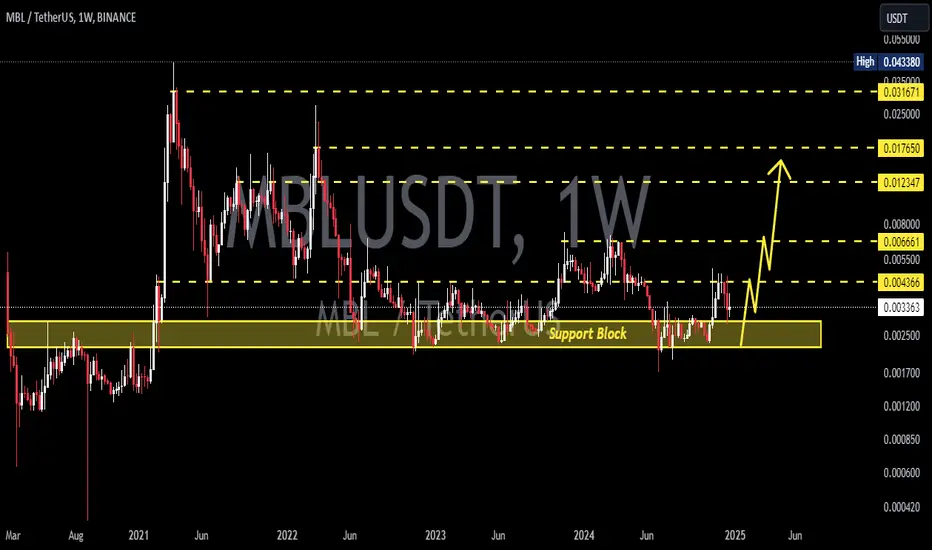
MBL potential targets First of all we should be realistic with market cap of this coin. At current moment in circulation around 18.8 Billion coins. The all time high market cap was around 150 million
On monthly timeframe we can see, in accumulation zone (based on this fib levels) we trade long time period and like usual we can see 2 scenarios!
Conservative - test yearly open, and zero level its around 1000% gains and rejection in to bear market again
Most positive - 500 million market cap with test of 0.5 level fibonacci (same direction to yearly open, sweep buy side liquidity and road can be open to new ath by market cap)
At current moment GATE:MBLUSDT trying break the point of control on Monthly timeframe!
✅Disclaimer: Please be aware of the risks involved in trading. This idea was made for educational purposes only not for financial Investment Purposes.
MBLUSDT

MBL/USDT — Descending Triangle: Breakout or Breakdown Ahead?🔎 Detailed Analysis
The MBL/USDT pair on the weekly chart is currently in a long-term price compression phase. The structure forms a Descending Triangle, characterized by:
Consistent lower highs along a long-term descending trendline (since 2021).
A strong horizontal support zone at 0.0017 – 0.0023 USDT (yellow box).
Price action consolidating into the triangle apex, suggesting a potential major breakout or breakdown in the coming weeks/months.
This pattern has been building for over 3 years, which makes any confirmed breakout highly significant.
---
📈 Bullish Scenario
Confirmation: A weekly close above the descending trendline and pivot level at 0.002874 USDT, supported by strong volume.
Retest: A successful retest of the breakout level turning into support strengthens the case for upside continuation.
Bullish Targets:
Target 1: 0.004419 USDT (nearest resistance).
Target 2: 0.006574 USDT.
Extended Target: 0.0177 – 0.0318 USDT if broader altcoin momentum strengthens.
✨ If this bullish breakout occurs, it could mark the beginning of a major reversal after years of consolidation.
---
📉 Bearish Scenario
Confirmation: A weekly close below the 0.0017 USDT support zone with strong bearish follow-through.
Implication: A breakdown of this historical support could open the door to much lower levels (sub-0.001), with an extreme projection toward 0.0006 USDT.
Note: Descending triangles often resolve bearishly in textbook cases, but in crypto they can also serve as accumulation zones before explosive rallies.
---
🛡️ Risk Management
Avoid entering positions solely because the price “looks cheap” — wait for clear confirmation.
Always set a Stop Loss below support (for longs) or above invalidation (for shorts).
Manage position sizing carefully → high reward potential but also high risk.
Use indicators (RSI, MACD, Volume) to confirm momentum shifts.
Weekly close is the strongest signal — avoid acting on intraday noise.
---
⏳ Timeframe & Potential
As this is a weekly timeframe pattern, confirmation may take several weeks to months.
The closer price gets to the triangle apex, the more explosive the breakout is likely to be.
Broader altcoin market sentiment will strongly influence which direction this resolves.
---
✨ Conclusion
MBL/USDT is at a critical crossroads:
Holding the 0.0017 – 0.0023 support and breaking the descending trendline could trigger a multi-fold rally.
Losing this support zone could lead to a sharp drop into uncharted sub-0.001 territory.
📍 This setup is highly attractive for swing traders and mid-to-long term investors waiting for a major move after extended consolidation.
---
#MBL #MBLUSDT #Crypto #Altcoins #TechnicalAnalysis #DescendingTriangle #Support #Breakout #Bullish #Bearish
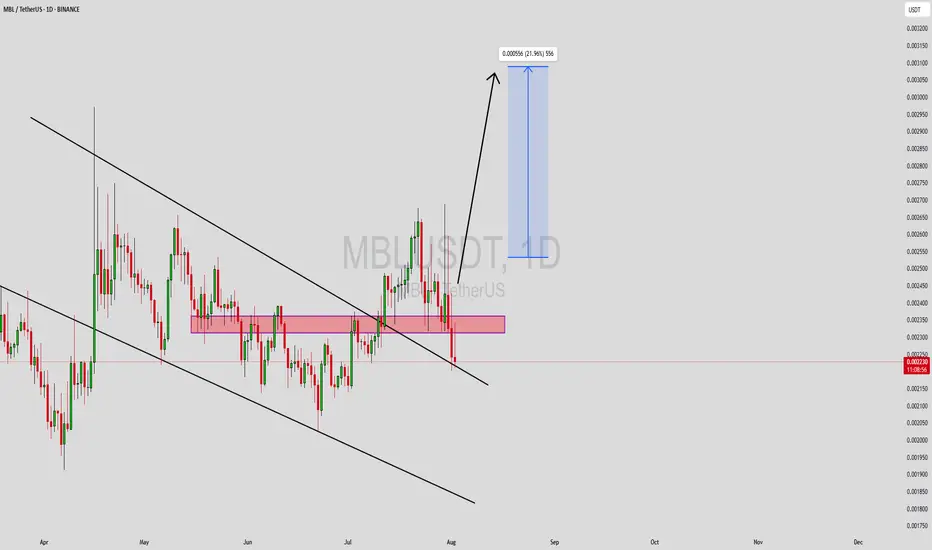
MBLUSDT Forming Bullish ReversalMBLUSDT is currently exhibiting signs of a bullish reversal pattern, indicating a potential trend shift in favor of the bulls. After an extended downtrend, the price appears to have found strong support, which is now serving as a base for upward momentum. This structure is often seen before a breakout rally, especially when paired with a steady increase in trading volume—suggesting accumulation by informed investors.
The recent price action confirms growing investor confidence in the MBL project. With volume picking up and a bullish reversal structure forming on the chart, traders are beginning to position for an anticipated move to the upside. Technical indicators support this sentiment, aligning with a potential gain of 20% to 30%+ in the short term if the current momentum is sustained.
As broader market sentiment continues to recover, MBLUSDT stands out with a clean technical pattern that offers a favorable risk-to-reward ratio. The combination of healthy volume, a well-defined support zone, and early signs of bullish continuation make this setup appealing to both swing traders and mid-term holders watching for breakout confirmation.
MBL’s fundamentals are also garnering interest, adding to the technical strength seen on the chart. If buyers continue stepping in near support levels, the breakout target could be reached faster than expected.
✅ Show your support by hitting the like button and
✅ Leaving a comment below! (What is You opinion about this Coin)
Your feedback and engagement keep me inspired to share more insightful market analysis with you!
MBLUSDT 1W AnalysisMBL ~ 1W Analysis
#MBL This trade is very risky, buy if you still have confidence in this coin with a short term target of at least 20%+ from here.
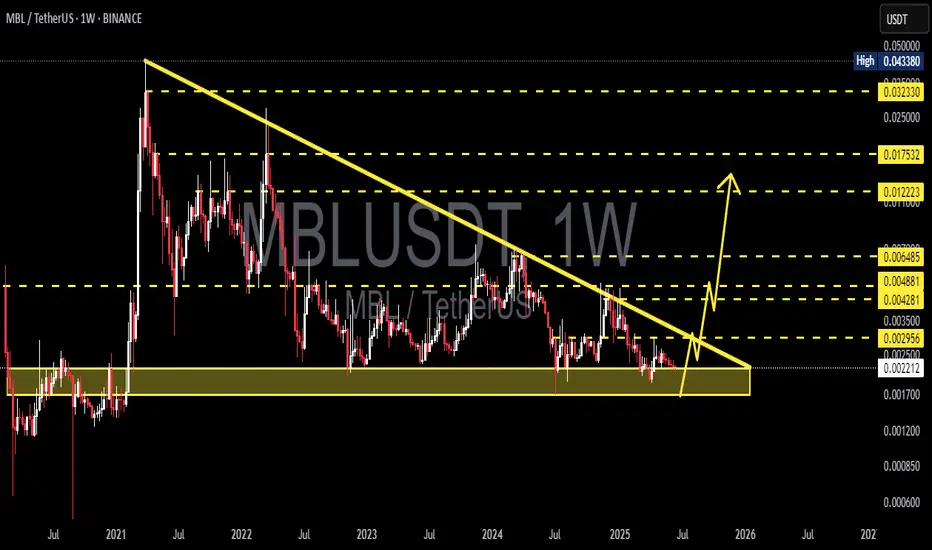
MBLUSDT 1WMBL ~ 1W Analysis
#MBL Buy gradually from here with a short -term target of at least 20%+. This is a very good support for now.
MBL NEW DAY IncreaseMBL NEW DAY Increase
Mbl can show on a low time frame new increase, following it to see if it's able to show new gains

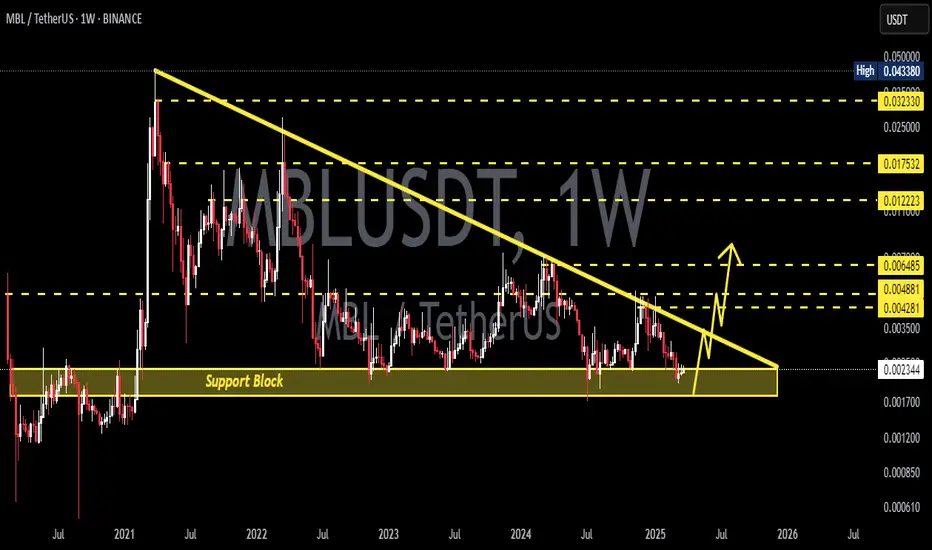
MBLUSDT 1WMBL ~ 1W
#MBL This support block has so far kept the price from dropping any lower. If you still have Conviction on this coin,. this support block would be a very good buying place for now. buy in stages with a minimum target of 20%+
MBLUSDT.1DIn my detailed analysis of the MBL/USDT chart, I've taken a close look at the daily timeframe to deduce the potential direction of the market. Notably, the Moving Average Convergence Divergence (MACD) is positioned just below the signal line and close to the zero line, indicating a slightly bearish momentum. However, the proximity to the zero line suggests that the market sentiment is not overwhelmingly bearish, and a reversal could be imminent if external factors come into play.
The Relative Strength Index (RSI) stands at 48.22, indicating a nearly neutral market with a slight tilt towards bearish territory. This level suggests that while there isn't extreme selling pressure, buyers have not taken full control either, creating a balanced yet tentative market condition.
The price has recently tested a key support level at $0.001755 (S1), and this level is crucial in determining the short-term market direction. If this support holds, it could act as a springboard for the price to potentially move towards the resistance levels identified at $0.003460 (R2) and $0.004283 (R3). Currently, the chart suggests a possible rebound towards these resistance levels, marked by the green arrows.
However, it's important to remain cautious. Should the support at $0.001755 fail to hold, the price could drop further, possibly testing lower historical supports. Given the current setup, my strategy would involve closely monitoring the $0.001755 level for potential buys, with stop-loss orders placed just below to manage risk effectively.
In summary, the MBL/USDT market is at a critical juncture, with potential for both a rebound and further declines. The key will be the market's ability to maintain above the current support level. A rebound above this level could offer a strategic entry point for a long position, targeting the aforementioned resistance levels.

MBL/USDT NEW INCREASE VOLUMEMBL/USDT shows the low time frame possibility for new volume which can affect the price for an uptrend. ( depend all on high chance) There are no guarantees in the markets.
The new increase volume updates always start with interest if there is a confirmation to follow and if there is a building with a hold for a time.
90% of coins this time are not building coins. Some % also show a start fake trend and return to where it started. time frame confirmation + high levels building is important for a healthy coin.

MBLMBL is near to the weekly support
Harmonic shape detected
📊 #MBL
🔼 LONG
💎 Entry: 0.002346 - 0.002441
💰 Target : 0.0048
❌ Stoploss: 0.002325
—————————
© Published by : TDAWLY


MBL LOOKS BULLISHBefore anything, pay attention to the time frame, the time frame is big.
MBL appears to be completing a large ascending triangle as we are now in wave E of this triangle.
By maintaining the green range, it can move towards the targets
Fixation of 1 weekly candle below the green range will violate the analysis
For risk management, please don't forget stop loss and capital management
Comment if you have any questions
Thank You

MBLUSDT has formed a Bullish channelMBLUSDT has formed a Bullish channel. The trend has the potential go continue
MBLUSDT
🔵Entry Zone 0.004418 - 0.004298
🔴SL 0.004124
🟢TP1 0.004678
🟢TP2 0.005079
🟢TP3 0.005384
Risk Warning
Trading Forex, CFDs, Crypto, Futures, and Stocks involve a risk of loss. Please consider carefully if such trading is appropriate for you. Past performance is not indicative of future results.
If you liked our ideas, please support us with your likes 👍 and comments.

MLong

MBL / MBLUSDTGood Luck
• Warning •
Any deal I share does not mean that I am forcing you to enter into it, you enter in with your full risk, because I'll not gain any profits with you in the end.
The risk management of the position must comply with the stop loss.
(I am not sharing financial or investment advice, you should do your own research for your money.)

Mbl breaks Symmetrical Triangle Finally Mbl Breaks Symmetrical Triangle In 2 days tf Expecting 150 to 180% bullish Wave In Midterm keep eyes on lower tfs for entries

MBLUSD - Faith In A Trend LineA trendline can be drawn pre bullrun on MBL
If you extend it to where price is today price sits comfortably on top of it
Will it hodl?


Currently located in an important sectionHello?
Traders, welcome.
If you "Follow", you can always get new information quickly.
Please also click "Boost".
Have a good day.
-------------------------------------
(MBLUSDT chart)
(1W chart)
The key is whether it can rise with support at 0.003058-0.004951.
Since the HA-High indicator and the M-Signal indicator on the 1M chart are passing over the 0.003058-0.004951 range, it can be seen that this is an important support and resistance range.
(1D chart)
It can be broadly divided into three sections.
1st: 0.002139-0.002571
2nd: 0.003058-0.003555
3rd: 0.004951-0.005756
Therefore, the key is whether it can rise with support in the 2nd section.
If it rises like that, it is expected to rise around the 3rd section.
If you fail to ascend, make sure you are supported near the first leg.
A full-fledged uptrend is expected to start if the price holds by moving above 0.004951-0.005756.
-------------------------------------------------- -------------------------------------------
** All descriptions are for reference only and do not guarantee profit or loss in investment.
** Even if you know other people's know-how, it takes a considerable period of time to make it your own.
** This is a chart created with my know-how.
---------------------------------

MBL is BullishHi, dear traders. how are you ? Today we have a viewpoint to BUY/LONG the MBL symbol.
For risk management, please don't forget stop loss and capital management
When we reach the first target, save some profit and then change the stop to entry
Comment if you have any questions
Thank You

MBLUSDTHello Crypto Lovers,
Mars Signals team wishes you high profits.
This is a one-day-time frame analysis for MBLUSDT
Here we have R2 and R1 as our resistance areas that express the unsuccessful triumphs of the price to rise. And S1 is a support area at the bottom of chart which contains the well support of price. At the moment, we have the fluctuation of price in R1 after being in a rising trend and there would be two options available here for us. Either we receive some rising signs by the price and an increase is expected for it toward R2 or higher. Or it happens that the price loses the support at this point and starts a decline down to S1. It is highly recommended to activate your stop-loss points due to the unstable situation of market.
Warning: This is just a suggestion and we do not guarantee profits. We advise you to analyze the chart before opening any positions.
Wish you luck

MBLUSDT (MBL) Daily tf Range Updated till 20-07-2220-07-22 -- updated the daily timeframe range here for now. nothing changed much. brokeout out of its long holding support of 0.004586. which can sum up its quality . under very low volume it dropped to a old support at 0.002412, it had a #spring test their got back to the old range. compare to many other alt's retrace it do have #scope and space to perform more but that depends how retail interest picks up.
18-03-22 -- mbl/usdt (MBL) Daily timeframe range. This alt got huge amount of swing range, actually volume helps on that. Daily range looks more sustainable for anyone who likes to hold. Of course again for volume it got insane amount of percentage candle's. for that in range low it did attracted p&d groups. which goes back to holders who used corresponding zones for their positions.(checkout my old chart to verify)

MovieBloc (MBL) - July 13Hello?
Traders, welcome.
If you "follow", you can always get new information quickly.
Please also click "Like".
Have a good day.
-------------------------------------
(MBLUSDT 1W chart)
The key is whether it can find support at 0.003505 and move above 0.005606.
(1D chart)
Resistance: 0.005606-0.006271
Support: 0.003051-0.003501
If it moves above 0.004417 and finds support, I would expect further upside.
It is important to find support in the 0.003051-0.003501 range as the stochastic RSI and RSI indicators are located in the overbought zone.
If the CCI line maintains its uptrend, it will likely see a short-term uptrend.
------------------------------------------------------------ -----------------------------------------------------
** All indicators are lagging indicators.
Therefore, it is important to be aware that the indicator will move accordingly as price and volume move.
However, for the sake of convenience, we are talking in reverse for the interpretation of the indicator.
** The MRHAB-T indicator used in the chart is an indicator of our channel that has not been released yet.
** The OBV indicator was re-created by applying a formula to the DepthHouse Trading indicator, an indicator disclosed by oh92. (Thanks for this.)
** Support or resistance is based on the closing price of the 1D chart.
** All descriptions are for reference only and do not guarantee a profit or loss in investment.
(Short-term Stop Loss can be said to be a point where profit and loss can be preserved or additional entry can be made through split trading. It is a short-term investment perspective.)
---------------------------------
