Gold Fires Back: Daily Reversal with Macro Wind at Its Back
Let’s read this board step by step, then I’ll give you the gold outlook 👇
⸻
1️⃣ US02Y (2-year Treasuries) – top left
• Timeframe: Daily (1D)
• Yield is around 3.60% (shown 3.608%) and slightly down today (-0.19%).
• Price is still close to the recent high, and the red dotted line = resistance / overbought zone.
👉 Meaning:
• The Fed is still in “high rates” mode,
• but this small drop in yield shows a bit of relief, so the pressure from bond yields on gold has eased a little but hasn’t disappeared.
⸻
2️⃣ US10Y (10-year Treasuries) – top right
• Yield is around 4.15%, also down today (-0.24%).
• Still close to recent highs, just under a red dotted line (resistance).
👉 Meaning:
• Long-term yields are still high, but we see a small downward breathing move.
• If that continues, it helps gold, because the “opportunity cost” of holding gold decreases.
⸻
3️⃣ DXY (US Dollar Index) – bottom right
• Timeframe: Daily.
• Recent high is around 100.36.
• Current price is about 99.27 with a daily gain of +1.61%, but the chart clearly shows a short-term downtrend from the 100.36 top, drifting lower.
👉 Meaning:
• The dollar is still strong in absolute terms,
• but it is losing upside momentum above 100.
• If the DXY continues to drop, that is usually positive for gold.
⸻
4️⃣ XAUUSD (Gold) – bottom left
• Timeframe: Daily (1D).
• Today we have a strong bullish candle:
• Current price is around 4,080.
• Daily change +5.76% → an explosive day (short squeeze + aggressive buying).
• Today’s low: around 3,819; high: around 4,381 → a very wide candle.
• Volume: 1.68M vs Volume MA 1.17M → volume well above average → this move is not random; it’s a “big money” move.
• Red dotted line around 4,080 → a key level / previous fair value, and price is now at or slightly above it.
⸻
Reading the full picture (Macro + Gold)
1️⃣ 2Y & 10Y yields
• Still at elevated levels → in principle, that’s not great for gold,
• But today’s drop in both yields tells us the market is cooling rate-hike expectations a bit → this becomes a supportive factor for gold if it continues.
2️⃣ Dollar (DXY)
• Topped around 100.36, then started to calm down and pull back, even though today’s candle is green (+1.61%).
• The bigger story: short-term downtrend from the top → tilts in favor of gold if the downside continues.
3️⃣ Gold (XAUUSD) itself
• It went through a correction in late October / early November,
• Then today you’ve got an explosive bullish candle with strong volume that pushed price back above the key level (red line).
• This is typically the shape of a powerful reversal bar inside a larger uptrend (higher low + higher high).
⸻
Gold outlook from this chart (educational only) 🧭
✅ Bullish scenario (upside bias)
As long as gold:
• Closes daily above the 4,000–4,050 zone (around the red dotted line),
→ we can say there is a re-claim of that zone after it acted as resistance / pressure.
What we might see:
• Retest of the 4,000–4,050 area as support,
• Then another push up toward 4,250–4,380 (roughly the top of the current candle / a higher supply zone).
This scenario gets stronger if:
• US02Y and US10Y keep drifting lower,
• DXY continues down below 99 again.
⸻
⚠️ Bearish scenario (another correction)
If gold:
• Closes back below 4,000 on the daily chart,
• And at the same time:
• Bond yields break to new highs again,
• DXY moves back above 100.36,
→ then today’s candle would likely be just a temporary short squeeze, and we could revisit the 3,880–3,820 area as support / re-accumulation zone.
⸻
One-sentence summary
The chart says:
Gold has printed a strong bullish reversal on the daily with big volume, in a macro environment that’s still not perfect but starting to ease (yields ticking down a bit and the dollar losing strength above 100).
If it holds above 4,000–4,050, the outlook is tilted to the upside, with potential toward 4,250–4,380 in the short term.
A break back below 4,000 would favor a return of the correction toward 3,880–3,820.
(All of this is educational chart analysis only, not a buy or sell recommendation.)
Megabar

YALLA XAUMO — GOLD (XAUUSD)- Institutional WEEKLY 📘 YALLA XAUMO — GOLD (XAUUSD)
Institutional WEEKLY — COMPREHENSIVE OUTLOOK
Week of Mon 17 → Fri 21 Nov 2025
All times Africa/Cairo (UTC+2). EDUCATIONAL ONLY — NOT FINANCIAL ADVICE.
Spot ref (XAUUSD): ~4,080 $/oz
GC1 (Dec ’25, front month): ~4,184 $/oz
GC2 (Feb ’26, next): ~4,220 $/oz
Term spread (GC2–GC1): ≈ +0.9% → mild CONTANGO
────────────────────────────────
GC FUTURES CURVE — QUICK GUIDE
────────────────────────────────
• Contango → GC2 > GC1 (upward curve):
Normal structure. Storage + carry costs are priced in. This is NOT automatically bearish for gold.
• Backwardation → GC2 < GC1 (downward curve):
Often signals strong immediate demand or short-term supply/flow stress. Can be short-term bullish for spot.
• Term spread (%) → (GC2 − GC1) / GC1 × 100:
Shows how steep the futures curve is. Bigger positive spread = market pricing more “future upside / carry”. Narrow or negative spread = nearer-term stress or demand.
Current read: Mild, healthy contango → gold is expensive but NOT in panic backwardation; market still comfortable holding exposure into early 2026.
────────────────────────
0) WEEKLY SNAPSHOT & MAP
────────────────────────
• Big picture:
– Gold is trading just below recent all-time highs (above 4,200 printed last month).
– Past month: soft pullback of roughly −3% from highs but still very elevated on a multi-year basis.
– Last 5–7 sessions: strong two-way flow, with intraday spikes both directions and closes clustering ~4,050–4,150.
• XAUMO structural read:
– Below: multi-week “Uploading” zone (institutional accumulation) where prior dips were bought aggressively.
– Above: fresh “Offloading” zone close to the recent record highs where large players started distributing size into strength.
– Vol & spreads:
• Volatility remains high but off the absolute peak.
• Spreads and intraday ranges expanded mid-week and cooled slightly into Friday.
→ Interpretation for 17–21 Nov:
• This is a “decision week inside a high range”, not a clean new trend.
• Market will likely choose between:
– (A) Deeper rotation back into the Uploading zone if macro = hawkish / growth-OK, or
– (B) A second push toward or beyond the highs if macro = dovish / growth-scared.
────────────────────────────
1) CROSS-ASSET TAPE (RISK MAP)
────────────────────────────
• Dollar Index (DXY) ~99.2:
– Off its mid-year peaks, closer to the bottom of its recent range.
– Bias: mild dollar softness compared to earlier in 2025.
• S&P 500 ~6,734:
– Near record territory but with recent pullbacks and intraday volatility.
– Investors still “buying the dip” in AI/tech, but sensitivity to Fed signals is high.
• VIX ~19–20:
– Elevated vs “calm” (12–15), but below panic (>25).
– Tells you: this is a market that can accelerate on headlines; gold benefits from that volatility.
• US 10-year yield ~4.1–4.2%:
– Still high in historical terms.
– Polls/forecasts show expectations for only modest moves higher in coming months, with cuts further out on the curve.
– Gold is coexisting with high nominal yields thanks to:
• Debasement narrative (debt, deficits),
• Central-bank buying,
• Uncertainty about real growth.
→ XAUMO conclusion:
– Cross-asset tape is mildly risk-on but fragile.
– Any surprise in Fed tone, data, or geopolitical risk can flip the intraday regime quickly and feed into gold.
──────────────────────────────
2) MACRO CALENDAR: 17–23 NOV
──────────────────────────────
Focus: what can MOVE gold, not every minor data point.
MON 17 NOV
• CAD CPI (inflation, Canada)
– Direct on CAD, indirect on commodities risk sentiment.
– Bigger-than-expected upside surprise can revive “sticky inflation” narrative.
TUE 18 NOV
• RBA Meeting Minutes (Australia)
– Asia-Pac risk sentiment signal.
– Dovish tone → supportive for gold via weaker AUD yields / global growth worries.
– Hawkish tone → limited direct effect but can tilt Asia risk-on.
WED 19 NOV — KEY DAY
• FOMC Minutes (October meeting)
– The main event of the week for gold.
– Market will scan for:
– How split is the committee?
– How worried about inflation vs growth?
– Hints about timing/pace of future cuts into 2026.
– Less hawkish / more growth-worry:
→ Bond yields ease, dollar softens → supportive for gold.
– More hawkish / inflation-worry:
→ Yields nudge higher, dollar firmer → pressure on gold (at least initially).
THU 20 NOV
• PBoC rate decision / China credit stance
– Extra easing / credit support = better commodity demand narrative (indirect positive for gold).
– Disappointment or more signs of slowdown = risk-off in cyclicals, but can also support gold as safe haven if sentiment sours.
FRI 21 NOV
• UK Retail Sales
• Flash PMIs (Germany, Eurozone, UK, US)
– Global growth thermometer.
– Weak PMIs → recession / stagnation chatter → more medium-term support for gold (cuts + safe-haven flows).
– Strong PMIs → short-term support for equities and possibly the dollar → can cap gold near the top of its range.
SUN 23 NOV (outside main trading week)
• NZ Retail Sales
– Minor for gold directly, but part of the global growth mosaic.
──────────────────────────────
3) HOLIDAYS / LIQUIDITY CHECK
──────────────────────────────
• No major US federal holiday during 17–21 Nov.
• Thanksgiving is on Thu 28 Nov (the following week), with Black Friday 28–29 Nov.
• Europe: no major pan-EU market holiday in this week; only usual local events with limited impact on global liquidity.
→ Read: This is a full-liquidity week. Moves around FOMC Minutes and PMIs are likely to be “real” flows, not just holiday noise.
────────────────────────────────────
4) XAUMO STRUCTURE — RANGE DIAGNOSTIC
────────────────────────────────────
(Conceptual: Uploading vs Offloading, MegaBars & Delta behavior)
• Uploading zones (support side):
– Built over recent weeks on pullbacks after the run to ~4,200+.
– Characterized by:
• Positive volume delta on down days,
• Strong reaction candles (MegaBars) stopping selloffs,
• RVOL elevated on lows (buyers stepping in).
– Each revisit has so far triggered a bounce, reinforcing these zones as “dynamic institutional support”.
• Offloading zones (resistance side):
– Close to or slightly above the recent record highs.
– Features:
• RVOL spikes on up-swings with fading delta (distributions into strength),
• Rejection candles / Kill Bars,
• Choppy clusters where upside follow-through stalls.
– This behavior is classic “distribute at extremes”, not clean breakout acceleration.
• Volatility regime:
– Elevated but not parabolic.
– XAUMO view: we are in a “high-altitude balancing act”:
→ deep pockets are carefully rotating risk at high prices, not simply panic-buying or panic-selling.
──────────────────────────────
5) WEEKLY REGIME (TREND VS BALANCE)
──────────────────────────────
High-level trend (multi-TF conceptually):
• Monthly:
– Strong bullish secular trend still intact (structure higher highs/higher lows).
– Over-extended zone; any deep pullback is still “inside” a long-term uptrend unless key prior monthly lows break.
• Weekly:
– Price is at/just below prior extremes with a broad horizontal band forming (multi-week range).
– XAUMO reads this as:
“Distribution-and-re-accumulation at high altitude” — not confirmed reversal, not confirmed blow-off continuation.
• Daily:
– Alternation: sharp pushes up followed by sharp shake-outs.
– Choppy value re-tests near the middle of the weekly range between Uploading and Offloading.
→ Regime label for 17–21 Nov:
“High-level BALANCED with directional optionality around FOMC Minutes.”
In other words: the trend is up on big TFs, but this week is about “who wins the range”: buyers defending Uploading vs sellers leaning on Offloading.
──────────────────────────────
6) WEEKLY SCENARIO LAB (NO ENTRIES)
──────────────────────────────
⚠ These are structural scenarios for study ONLY — NOT trade signals, no entries, no SL/TP.
SCENARIO A — “Dip then Reload” (Pro-gold bias)
• Setup:
– Early week: gold drifts lower or chops sideways as markets front-run FOMC Minutes.
– We see tests toward/into known Uploading zones on your XAUMO map.
• FOMC tone:
– Less hawkish / more concerned about growth and debt sustainability.
• Market reaction:
– US yields ease a bit, DXY softens.
– Gold prints supportive delta + MegaBars from the lower half of the range.
• Outcome:
– Week closes towards mid-to-upper portion of the recent band.
– Under this scenario, dips are “used to reload” rather than start a full reversal.
SCENARIO B — “Fed Hawkish Squeeze” (Pressure on gold)
• Setup:
– Markets go into Wednesday still near mid or upper band of the recent range.
• FOMC tone:
– Minutes show more concern about inflation, less urgency about cuts.
• Market reaction:
– 10-year yields push higher again; dollar stabilizes or firms.
– Equities wobble or correct.
– Gold fails to hold mid-range value and rotates back firmly toward the lower band.
• Outcome:
– Week prints a bearish body on weekly candle (longer upper wick), with tests or even temporary breaks beneath recent Uploading zones.
– This doesn’t kill the long-term bull but warns of deeper corrective structure into late November.
SCENARIO C — “Risk-On Sideways” (Range extension without decision)
• Setup:
– PMIs and data come in “OK but not scary”,
– FOMC Minutes are balanced, nothing shockingly new.
• Market reaction:
– Equities stay near highs with some volatility,
– Dollar only slightly moved,
– Gold oscillates between Uploading and Offloading with no decisive break.
• Outcome:
– Another wide range weekly candle closes inside the same band.
– XAUMO takeaway: continuing accumulation/distribution at altitude; bigger move postponed to December or post-Thanksgiving.
SCENARIO D — TAIL RISK (Shock event)
• Could be:
– Geopolitical flare-up,
– Surprise credit event,
– Major policy misstep headline.
• Reaction:
– Spiky MegaBars, large RVOL, fast repricing across DXY, yields, and equities.
– XAUMO focus shifts from “fine-tuning the range” to:
• Identifying NEW Uploading/Offloading zones created by the shock.
──────────────────────────────
7) XAUMO WEEKLY EXECUTION CHECKLIST
──────────────────────────────
Use this to structure your own plan (NOT to auto-trade):
BEFORE MONDAY OPEN:
Mark your key Uploading zones (multi-week support clusters).
Mark your key Offloading zones (multi-week distribution caps).
Note the middle of the recent range — where “fair value” has been trading.
EACH DAY (PRE-LONDON):
Review overnight Asia flows:
– Did Tokyo/Asia buy dips or sell rallies?
– Any unusual RVOL / MegaBar activity?
Check macro diary for the day (is it event-driven or purely technical?).
PRE-NEW YORK (ESPECIALLY WED FOMC DAY):
Re-assess:
– Is gold closer to Uploading or Offloading?
– Are DXY, SPX, and US10Y aligned with risk-on or risk-off?
Decide which scenario (A/B/C/D) the market is closer to and what would invalidate that read.
END OF WEEK:
Where did the weekly close land?
– Near highs → Offloading challenged or absorbed.
– Near lows → Uploading stressed or broken.
– Middle → range still dominant.
Update your XAUMO Gate Map and redraw your higher-TF structure for the final weeks of Q4.
──────────────────────────────
BOTTOM LINE FOR THE WEEK
──────────────────────────────
• Environment:
– Gold is in a high-altitude balance: big secular bull, but stuck between institutional Uploading and Offloading zones.
– FOMC Minutes + global PMIs are the main catalysts for a range break or confirmation of continued balancing.
• Practical XAUMO message:
– Respect BOTH tails: a dovish surprise can fuel another push toward the highs, a hawkish surprise can drive a deeper retest of support.
– Instead of predicting, let structure + volume + delta + sessions show you:
“Where are they loading the truck?” vs “Where are they unloading it?”
This whole report is for education, orientation, and planning —
not for executing trades, not a substitute for your own risk management,
================================
📘 EDUCATIONAL PRECISION MAP — XAUUSD (Next Week)
Reference spot (Fri close): ~4,080 $/oz
Recent extremes: low ~4,032 • highs ~4,215–4,250
⚠️ Not signals. Use as study levels only. You own your risk.
────────────────────────
1) “Shallow Dip” Accumulation Study
────────────────────────
Idea: market defends Friday’s lower zone and re-loads above 4,030.
• Study ENTRY zone (buyers to watch):
→ 4,040 – 4,065
(just above the 4,032 low and round 4,050 handle)
• STRUCTURAL invalidation for this idea:
→ H4 close below 4,010
(means that whole shallow support band failed, attention shifts to deeper zone).
• EDUCATIONAL targets if this zone holds:
→ TP1 (mid-range): 4,120 – 4,135
(recent intraday balance / minor resistance)
→ TP2 (upper band test): 4,170 – 4,190
(cluster of recent daily closes / resistances)
Risk logic: once you’re under 4,010, you’re no longer trading a “shallow dip”; you’re in deep-correction territory.
────────────────────────
2) “Deep Dip” Accumulation Study
────────────────────────
Idea: shallow zone fails, market washes into the bigger structural support around 4,000.
• Study ENTRY zone:
→ 3,980 – 4,005
(psychological 4,000 + early-November lows near 4,004–4,005)
• STRUCTURAL invalidation:
→ Daily close below 3,950
(breaks prior swing structure; opens room toward mid-3,800s mentioned in some forecasts).
• EDUCATIONAL targets if that zone absorbs selling:
→ TP1: 4,060 – 4,080 (back to value / ref area)
→ TP2: 4,120 – 4,140 (same mid-range resistance as in Scenario 1).
Risk logic: below 3,950 you’re no longer “buying a dip in a strong trend”, you’re in candidate trend-change.
────────────────────────
3) “Offloading Fade” — Range Sell Study
────────────────────────
Idea: big players keep distributing into strength near last week’s cap.
• Study ENTRY zone (sellers to watch):
→ 4,185 – 4,215
(recent daily closes and intraday caps; multiple analyses flag 4,203–4,219 as key resistance)
• STRUCTURAL invalidation:
→ H4 close above 4,245
(clears the rejection high / wick zone ~4,245–4,250).
• EDUCATIONAL downside targets if sellers defend:
→ TP1: 4,140 – 4,150
(recent support/flip area before Friday’s drop)
→ TP2: 4,080 – 4,095
(current reference / Friday settlement band).
Risk logic: if price accepts above 4,245 on closing basis, this “fade the top” idea is dead — you’re on the wrong side of a breakout.
────────────────────────
4) “Breakout & Hold” Continuation Study
────────────────────────
Idea: market finally accepts above the rejection band and builds a new leg higher.
• Trigger condition (not entry by itself):
→ H4 / Daily close above 4,245 with RVOL > 1 and no immediate full rejection.
• Study ENTRY zone (post-break retest):
→ 4,230 – 4,245
(retest of broken resistance as support).
• STRUCTURAL invalidation:
→ Close back inside / below 4,200
(failed breakout → bull trap, reverts to range or reversal).
• EDUCATIONAL upside targets:
→ TP1: 4,285 – 4,300
(next projected resistance band from current S/R ladders).
→ TP2: 4,325 – 4,350
(extension based on recent daily ranges ~170–200 $/oz added above 4,170–4,190).
Risk logic: if the breakout can’t hold 4,200 on a retest, treat it as distribution, not continuation.
────────────────────────
How to actually USE this (educationally)
────────────────────────
1) Mark the four zones on your chart:
• 4,040–4,065
• 3,980–4,005
• 4,185–4,215
• 4,230–4,245
2) For each touch next week, ask:
• What is volume doing (normal / high RVOL / drying up)?
• What is delta doing (aggressive buyers or sellers taking control)?
• Are DXY and 10Y yields confirming the move or fading it?
3) Only THEN design your own trade plan (or stay flat).
These levels are a **map**, not orders.
🏆 Winners trade with XAUMO indicators
EDUCATIONAL ONLY — NOT FINANCIAL ADVICE.

YALLA XAUMO — GOLD (XAUUSD) | Institutional Daily📘 EDUCATIONAL ONLY — NOT FINANCIAL ADVICE
All times Africa/Cairo (+03:00)
🟡 YALLA XAUMO — GOLD (XAUUSD) | Institutional Daily — COMPREHENSIVE (Approved Protocol)
Version: v2025-Approved • Report time: Mon, 27 Oct 2025 — 10:12
Spot ref: 4,078.65 • GC1: 4,094.3 • GC2: 4,127.6 → Term spread +0.81% → Contango
— GC futures curve explainer —
• Contango → GC2 > GC1 (normal upward curve; storage/carry cost priced in; not bearish by itself).
• Backwardation → GC2 < GC1 (near-term scarcity / strong spot demand).
• Term spread (%) → (GC2 − GC1) / GC1 × 100 → shows curve slope/steepness.
────────────────────────────────────────────────────────────────────
1) SNAPSHOT & MAP
• Regime: Range-to-balance intraday; buyers defending 4,066–4,072; supply stacked 4,100–4,118 (from panels).
• Tape: RVOL sub-1 overnight → expansion risk around data windows.
• Plan: Trade value to value; only chase breaks with RVOL ≥ 1.30 and delta breadth confirmation.
2) MACRO CALENDAR (Today, Cairo time)
• 14:30 — US Durable Goods Orders (Sep) + Core ex-Transport. Market focused after prior volatility. :contentReference {index=0}
• ECB — Consumer Expectations Survey release today (inflation expectations lens). :contentReference {index=1}
• China — Industrial profits: latest print shows acceleration in Sep (risk-on supportive headline). :contentReference {index=2}
• Heads-up: FOMC two-day meeting Tue–Wed; statement 21:00 Cairo (14:00 ET) Wed; presser 21:30 Cairo. :contentReference {index=3}
3) FOMC WATCH (context for week)
• Dates: Oct 28–29, 2025; blackout in force. :contentReference {index=4}
• Consensus: high odds of a 25 bp cut to 3.75%–4.00% band (per previews/odds). :contentReference {index=5}
• Implication: front-end rates and USD swings likely to dictate gold’s direction on Wed close.
4) CROSS-ASSET HEATMAP (read-across)
• USD/DXY: mixed, headline-sensitive into data/Fed.
• US equities: cautiously bid into US open; watch breadth vs yields. (Context wires.) :contentReference {index=6}
5) GC FUTURES STRUCTURE (XCM)
• Curve: Contango (+0.81%). Read: normal carry; not inherently bearish for spot—direction still flows from USD/rates & RVOL.
6) FIB-KICKER VOLUME MATRIX (from your charts)
• Uploading band: 4,068–4,084 must hold for buyers.
• Offloading shelf: 4,100–4,118 needs RVOL ≥1.30 to clear.
• Trigger: compression <35% + RVOL surge → momentum entry; otherwise fade extremes back to VWAP/POC.
7) ICHIMOKU REGIME TABLE
• D1: Neutral/balanced under resistance.
• H4: Neutral→slight bear below 4,118.
• H1: Range 4,072–4,096; TK mixed.
• 15m: Compression pockets; signal only with volume.
8) VALUE MAP — POC/VAL/VAH/VWAP
• POC ~4,080± | VAL ~4,064 | VAH ~4,100 | VWAP ~4,078–4,082 (from panels). Use as magnets/invalidation zones.
9) XAUMO TREND MAP (confidence %)
• Daily 52 • H4 48 • H1 46 • 15m 50 → Overall: Balanced/indecisive until data.
10) SESSION BIAS TABLE (London→NY)
• London AM: Mean-revert inside 4,064–4,100.
• NY Data Window (14:30–17:00): Expansion risk; let numbers print, then follow RVOL direction.
11) LIQUIDITY MAP
• Below: 4,064 / 4,056 • Above: 4,100 / 4,108 / 4,118. Expect stop-runs at edges pre-news.
12) DIAGNOSTICS (quick)
• RVOL <1 overnight; watch for jump >1.3 on breaks.
• Delta: mixed; no one-sided absorption confirmed.
• Compression: building → favors a data-led move.
13) TRADE SCENARIOS (examples for training — not signals)
A) Swing (reclaim)
• Entry: 4,089–4,093 retest after 15m close >4,088 & RVOL ≥1.3
• SL: 4,072
• TP1: 4,108 • TP2: 4,118 • TP3: 4,132
B) Reversal-fade (into shelf)
• Entry: 4,104–4,112 rejection wick + weak RVOL
• SL: 4,120
• TP1: 4,092 • TP2: 4,084 • Stretch: 4,068
C) Scalping (range)
• Buy 4,066–4,072 flush → TP 4,082–4,088 • SL 4,060
• Sell 4,100–4,108 tag → TP 4,090–4,084 • SL 4,114
D) Continuation (post-data only)
• 15m close >4,118 with RVOL ≥1.5 & positive delta breadth → ride 4,132 → 4,146 • Invalidation: back below 4,112.
14) EXECUTION CHECKLIST
Macro release just hit / upcoming? (Durables 14:30) :contentReference {index=7}
RVOL ≥1.30 on the break?
Avoid first 3–5 minutes after prints.
Pre-define risk (≤1R) and trail only after TP1.
FOMC risk on Wed — scale down size. :contentReference {index=8}
────────────────────────────────────────────────────────────────────
ARABIC QUICK SUMMARY
• الذهب متوازن داخل 4,064–4,100. بيانات السلع المعمرة 14:30 القاهرة قد تُحرّك النطاق. اجتماع الفيدرالي غداً وبعده؛ التوقعات تميل لخفض 25 نقطة أساس. خطتك: لا مطاردة بدون RVOL≥1.30؛ اشترِ الارتدادات فوق 4,088 وبيع الزيادات قرب 4,100–4,118 مع رفض واضح. :contentReference {index=9}
FRENCH QUICK SUMMARY
• Or en range 4 064–4 100. Biens durables US à 14h30 (Le Caire) peut déclencher une sortie. La Fed (28–29 oct.) attendue pour −25 pb; prudence sur la volatilité. Chercher des entrées seulement avec RVOL ≥1,30 et validation par delta. :contentReference {index=10}

YALLA XAUMO — GOLD (XAUUSD) | Weekly Comprehensive📘 EDUCATIONAL ONLY — NOT FINANCIAL ADVICE
All times Africa/Cairo (+03:00)
🟡 YALLA XAUMO — GOLD (XAUUSD) | Weekly Comprehensive (Approved Protocol)
Version: v2025-Approved • Report time: Sun, 26 Oct 2025 — 11:57
Spot ref: 4,108.70 • GC1: 4,137.8 • GC2: 4,171.5 → Term spread +0.81% → Contango
— GC futures curve explainer —
• Contango → GC2 > GC1 (normal upward curve; storage/carry cost priced in; not bearish by itself).
• Backwardation → GC2 < GC1 (near-term demand/supply stress; often bullish spot impulse).
• Term spread (%) → (GC2 − GC1) / GC1 × 100 → shows curve slope/steepness.
────────────────────────────────────────────────────────────────────────
0) FOMC THIS WEEK — timing, expectations & official rhetoric
• When: Tue–Wed Oct 28–29, 2025. Policy statement 2:00 pm ET (**9:00 pm Cairo**) and Chair press conference 2:30 pm ET (**9:30 pm Cairo**). :contentReference {index=0}
• Market base case: Another ¼-point cut (to ~**3.75–4.00%** target range) is widely priced via Fed funds futures (FedWatch). :contentReference {index=1}
• Recent Fed rhetoric:
– Powell: hiring slowdown is an increasing risk; tone supports more cuts this year if labor weakens. :contentReference {index=2}
– Williams (NY Fed) & Daly (SF Fed): open to further cuts given labor risks; emphasize “risk-management” approach. :contentReference {index=3}
– Gov. Barr: urges caution due to inflation risk; wants more data before additional easing. :contentReference {index=4}
• Read-through for gold: Pre-FOMC compression likely; first move can be a head-fake. A cut + soft guidance → weaker USD / firmer gold; a cautious tone or higher inflation focus → USD bid / gold caps near weekly supply.
1) WEEKLY SYNOPSIS (what the market is doing)
• Bias map: Weekly still “uploading” from the green accumulation band; overhead “offloading” cap sits in 4,28x–4,33x then 4,38x (weekly high box on your chart pack).
• Structure: Last two weeks printed balance → failed expansion → re-balance around ~4,10xx; 38.2% Fib pivot ~4,125 is the mid-rail that keeps getting tested.
• Flow tells: RVOL mixed; compression oscillates mid-range → expect expansion on macro catalysts mid-week (rates & growth data).
• Bottom line: Respect 4,09xx–4,07xx demand shelf for dip-buys; sell responsive spikes into 4,28x–4,33x unless volume confirms absorption → breakout.
2) MULTI-TF SNAPSHOT & MAP (15m / 1h / 4h / W1 / M1)
• 15m: Sideways micro-auction around 4,10xx with frequent delta flips; use session VWAP & micro POC for scalps.
• 1h: Mean-revert regime; higher-low attempts above 4,09xx; momentum modest.
• 4h: Range with positive skew; “reload (shallow)” band sits just under 4,10xx on your panel.
• W1: Uploading phase intact while > 4,03x–4,06x; weekly offload zone begins ~4,29x.
• M1: Month still green but thin at the top; month-end + FOMC → expect volatility pockets.
3) WEEK AHEAD — KEY ECON EVENTS (Oct 27–31, 2025)
• FOMC decision & press conference Wed 29 Oct (see §0). :contentReference {index=5}
• Thu 30 Oct: US GDP (advance); Eurozone GDP; German CPI; ECB & BoJ decisions (timing varies).
• Fri 31 Oct: US Core PCE; Eurozone CPI (flash); China PMIs; German retail sales.
• Note: Some U.S. releases may still face shutdown-related delays; trade the tape, not the calendar. :contentReference {index=8}
4) MARKET HOLIDAYS (liquidity watch)
• Mon 27 Oct: New Zealand Labour Day — NZ markets closed. • Wed 29 Oct: Hong Kong Chung Yeung Festival — HK closed. :contentReference {index=9}
5) CROSS-ASSET DASH (context one-liners)
• DXY soft-to-flat near ~99 on your watchlist; equities bid; VIX mid-teens → dips in gold bought; breakouts need volume confirmation (esp. into/after FOMC).
6) VALUE / VWAP / PROFILE
• Weekly fulcrum ~**4,125 (38.2%)**.
• Green “uploading” floor clusters ~**4,06x–4,09x**; red “offloading” supply 4,28x–4,33x then 4,381.
• Execute around session VWAP/POC/VAL/VAH per your panel.
7) ICHIMOKU REGIME QUICK READ
• H1: Price near cloud top; Tenkan≈Kijun chop → patience.
• H4: Above Kijun, below weekly supply; Chikou clear → constructive while >4,09x.
• W1: Bullish-tilt as long as >4,03x–4,06x base.
8) MOMENTUM & VOL (diagnostics)
• RVOL mixed (line ~0.9–2.0 this month); compression mid-band → primed for catalyst-driven move.
• RSI/MFI slopes on your HUD: turning up from neutral intraday; weekly still positive.
9) GC FUTURES STRUCTURE (XCM)
• Curve: Contango with ~**+0.81%** term spread (GC2>GC1) → neutral carry; no spot-stress signal. :contentReference {index=10}
• Read-through: Favors “buy dips / fade euphoric spikes” unless macro flips curve toward backwardation.
10) SESSION GAME PLAN (London/NY execution notes)
• London: Fade edges back to VWAP inside 4,10xx–4,14x; protect against headline spikes.
• NY (FOMC week): Expect pre-Fed compression → post-Fed impulse; first move can be fake → wait for retest + delta confirmation.
11) WEEKLY LEVELS (from your panels)
• Support: 4,090 • 4,076 • 4,044
• Pivot/Control: 4,125 (38.2%)
• Resistance/Supply: 4,184 • 4,228 • 4,295–4,330 • 4,381
12) EXECUTION CHECKLIST
□ Higher-TF bias aligned (H1/H4/W1)?
□ Value vs imbalance? (VWAP/POC/VAL/VAH)
□ Catalyst risk within 60–90 min?
□ RVOL ≥1.2 on break; absorption confirmed?
□ Hard SL placed (ATR/structure), risk ≤1R.
13) TRADE SCENARIOS (educational examples; not signals)
A) Swing — Buy the dip into value
• Entry: 4,092–4,098 (absorption in green “reload”) • SL: 4,062
• TP1: 4,125 • TP2: 4,184 • TP3: 4,228 • Stretch: 4,295
• Prob: ~63% if DXY soft & RVOL ≥1.1
B) Reversal — Fade weekly supply
• Entry: 4,224–4,235 on stall/neg. delta • SL: 4,255
• TP1: 4,184 • TP2: 4,152 • TP3: 4,125
• Prob: ~58% pre-FOMC; ~50% post-Fed if risk-on
C) Scalp — VWAP reversion
• Long on VWAP holds >4,10xx; short on rejection >4,18x → VWAP
• SL: 0.7–1.0×ATR(15) • TPs: 0.5R / 1.0R / trail via micro-POCs
• Prob: ~65% in range; avoid 15–30m into top-tier data
D) Continuation — Break & retest
• Long >4,184 (close + retest + RVOL≥1.4) → 4,228 → 4,295
• Short <4,076 (close + retest + RVOL≥1.4) → 4,044 → 4,00x
• Prob: ~57% (needs volume)
14) “MONTH-CLOSE” WATCH (special)
• Month ends Fri, 31 Oct — same day as US Core PCE, one day after FOMC. Expect re-hedging/window-dressing; ranges can expand late-week.
• Track: (i) M1 hold >4,09x to keep green body; slip <4,07x risks wick-off. (ii) Curve shift toward backwardation post-Fed would favor spot-led squeezes. (iii) Widen stops post-FOMC; reduce size near Friday fix.
15) RISK NOTES
• Some U.S. data may be delayed; react to price/volume, not forecasts. :contentReference {index=12}

YALLA XAUMO — DAILY COMPREHENSIVE (Institutional)📘 Educational only — not financial advice.
All times Africa/Cairo (+03:00). Tue 14 Oct 2025.
────────────────────────────────────────────────
🟡 YALLA XAUMO — DAILY COMPREHENSIVE (Institutional)
────────────────────────────────────────────────
A) XGM Gate Map (intraday)
• Gate (distribution): 4,168–4,176
• If Gate breaks/holds → 4,189 → 4,206 → 4,220 → 4,239
• Uploading band (buy dips): 4,160 • 4,146 • 4,129 • 4,109.8 • 4,090.6
• Current state: Stair-step up; positive tape delta into highs.
B) Macro Calendar — Holiday-Aware (times in Cairo, UTC+3)
• 09:00 🇬🇧 UK data window (CPI/Jobs/Retail etc., when scheduled)
• 10:00 🇬🇧 London Cash Open (equities)
• 11:00–12:00 🇪🇺 Eurozone data window (ZEW/IFO/CPI flash, when scheduled)
• 12:00–13:00 🇩🇪/🇫🇷 Country prints (if any)
• 15:30 🇺🇸 Tier-1 US data window (CPI/PPI/Claims/Retail — **prime algo time**)
• 16:30 🇺🇸 NYSE Cash Open (US equities)
• 17:30 🇺🇸 EIA Crude Oil Inventories (Wednesdays)
• 21:00–23:00 🇺🇸 Fed speakers/FOMC mins (if scheduled)
• Holiday note: Execute London-led plan first; reassess if US liquidity is curtailed.
C) Snapshot & Map
• Spot (XAUUSD): ~4,161.8
• Short context: Trend intact; shallow pullbacks; repeated tests beneath 4,168.
• Stance: Buy-the-dip >4,146; chase only on RVOL>1.35 with 15m close >4,176.
D) GC Futures Structure (COMEX) + Explainer
• GC1: ~4,173.3 | GC2: ~4,206.5 | Term spread: +0.80% → **Contango**
• Read: Healthy curve; breakout quality improves if spread tightens during thrusts.
• Retail explainer:
– Contango: GC2 > GC1 (carry priced; normal curve).
– Backwardation: GC2 < GC1 (near-term demand/supply stress).
– Term spread (%): (GC2−GC1)/GC1×100 → rising = steeper curve; falling = flattening.
E) Fib-Kicker Volume Matrix (estimates vs avg)
TF Current Vol Δ vs Avg Target Vol Upload % Stage
15m 85–95K +10–15K ~120K 70–78% Mid→Late upload under Gate
1h 230–260K +25–35K ~320K 65–72% Mid upload; room above VWAP
4h 0.95–1.10M +0.10–0.18M ~1.30M 72–80% Trend leg developing
D 3.6–3.9M +0.2–0.4M ~4.6M 75–82% Solid participation
W 14–15M +0.5–0.8M ~18M 60–66% In progress; maintain HLs
F) Ichimoku Regime Table
TF Price vs Cloud Tenkan/Kijun Future Cloud A vs B Chikou Bias
15m Above Bull ↑ A>B (thickening) Free ++
1h Above Bull → A>B (steady) Free ++
4h Above Bull ↑ A>B (expanding) Free ++
D Above Bull → A>B (stable) Free +
W Above Bull → A>B (steady) Free +
G) POC / VAL / VAH / VWAP (refs)
TF POC VAL VAH VWAP
15m 4,140 4,122 4,160 ~4,138
1h 4,098 4,076 4,129 ~4,105
4h 4,029 3,995 4,059 ~4,046
D 3,970 3,944 4,012 ~3,985
H) XAUMO Trend Map — Confidence %
• 15m: 78% long — Buy dips 4,152–4,146; confirm RVOL>1.2 & bullish close.
• 1h : 74% long — Respect VWAP/POC rotations; partials at kickers.
• 4h : 71% long — Trail under prior HL; avoid giving back TP1.
• D : 63% long — Swing bias valid while >4,012.
Composite: **BULLISH** (buy dips >4,146; chase only on confirmed gate hold).
I) Kicker Improvement — Projections (from 4,029 pivot)
• 1.272 = 4,189 • 1.414 = 4,206 • 1.500 = 4,220 • 1.618 = 4,239
J) Session Bias Table (holiday-aware)
• Asia: Constructive climb; positive delta footprints.
• London: Primary engine; watch 4,168–4,176 acceptance.
• New York: Seek follow-through; avoid chasing if RVOL fades <1.0.
K) Cross-Asset Heat (quick read)
• DXY ~99.2 slightly softer → supportive.
• SPX firm; VIX ~19 easing → risk-on backdrop; gold retains RVOL trigger.
L) Liquidity Map (intraday)
• Offers: 4,168 / 4,172 / 4,176
• Pockets above: 4,189 → 4,206
• Bids: 4,160 • 4,146 • 4,129 • 4,109.8 • 4,090.6
M) Trade Scenarios (rules, not signals)
1) Swing — Trend-Follow
Entry: A) Dip buy 4,152–4,146 B) Break/15m close >4,176 (RVOL>1.35)
SL: A) 4,129 B) 4,160 (failed breakout)
TP: 4,168 / 4,189 / 4,206 (runner 4,220)
Prob: 71% while >4,146 and RVOL>1.1
Invalidation: 1h close <4,129
2) Edge-Fade — Counter (Conservative)
Entry: Rejection wick above 4,176 with RVOL<1.0 & delta divergence
SL: 4,182
TP: 4,160 / 4,146
Prob: 42% (only on clean exhaustion)
Invalidation: 15m close >4,176 with RVOL>1.35
3) Scalping — LTF
Trigger: Pullback to 4,152–4,146 + bullish 15m close + DI/RSI uptick
SL: 4,139
TP: 4,160 / 4,168 / 4,176 | Hold: 3–5×15m bars
Prob: 66% with net-positive tape delta
Invalidation: Two 15m closes <4,146
N) Execution Checklist
RVOL>1.35 on breakouts Close above Gate before chasing
DXY not spiking up VIX not surging
Respect VWAP/POC rotations Trail under prior HL after TP1
O) Arabic Quick Summary (numbers in English)
الاتجاه صاعد. بوابة الاختراق 4,168–4,176. شراء الهبوط فوق 4,146.
الأهداف: 4,189 → 4,206 → 4,220. تأكيد بكسر وإغلاق 15m فوق البوابة مع RVOL>1.35.
إبطال: إغلاق ساعة تحت 4,129.
P) French Quick Summary
Tendance haussière. Porte 4 168–4 176.
Acheter les replis >4 146. Cibles 4 189 → 4 206 → 4 220.
Valider avec RVOL>1,35 et clôture 15m > porte. Invalidation: H1 < 4 129.
🏆 Winners trade with XAUMO indicators

YALLA XAUMO — WEEKLY COMPREHENSIVE (Confluence Edition)YALLA XAUMO — WEEKLY COMPREHENSIVE (Confluence Edition)
Educational only — not financial advice. Timezone: Africa/Cairo.
1) Snapshot & Map
Spot (XAUUSD): ~4012.8
Distribution Gate: 4022–4029 → unlocks 4046 → 4059.2 → 4090
Uploading bands (supports): 3985 (≈VWAP) • 3970.65 (15m swing low) • 3944.2 (H1/H4 base)
Context: Uptrend intact; repeated probes of 4029 with liquidity building below.
2) GC Futures Structure (COMEX)
GC1 (front): 4036.2
GC2 (next): 4054.4
Term spread: +0.45% → Contango (healthy carry)
Read: Spot marginally under GC1 → synced. Breakout quality improves if the spread flattens during a push.
Plain-English futures curve explainer (always included):
Contango → GC2 > GC1: a normal upward curve; storage/carry cost is priced in (not inherently bearish).
Backwardation → GC2 < GC1: often signals strong near-term demand or short supply.
Term spread (%) → % difference between GC2 and GC1 that shows whether the curve is rising or falling.
3) Fib-Kicker Volume Matrix
(Directional read; volumes summarized from your charts.)
Uploading = accumulation; Offloading = distribution at resistance.
4) Ichimoku Regime Table
15m: Price above cloud; Tenkan > Kijun; Chikou free above price → Bias +
1h: Touching/above Kijun; future cloud slightly up → Bias + (light)
4h: On/near cloud edge; needs a clean 4h close >4029 → Neutral → +
Daily: Well above cloud, stretched from Kijun → Bias ++
Weekly: Above cloud; major trend up → Bias ++
5) Schabacker Patterns (concise)
4h: Flag/rectangle build over 3985–4005.
Daily: Ongoing ascending structure; measured pushes toward 4046/4059.
Weekly: Extended uptrend; 4090 as decision/supply.
6) POC / VAL / VAH / VWAP Table
15m: POC ~4004 • VAL ~3996 • VAH ~4015 • VWAP ~4003
1h: POC ~4006 • VAL ~3992 • VAH ~4022 • VWAP ~4003
4h: POC ref ~3975.15 • value area rising toward ~4020 • VWAP wkly > 3995
Daily: POC 4012 • VAL 3995 • VAH 4029 • VWAP 4003
7) XAUMO Trend Map
15m: 62% Up — buy dips above VWAP 4003
1h: 58% Up — holding >4012 strengthens breakout odds
4h: 55% Neutral→Up — decision >4029
Daily: 68% Up — targets 4046/4059
Weekly: 72% Up — 4090 supply/trim zone
Composite bias: +61% Up — Prefer buy-the-dip; avoid chasing without RVOL & positive delta.
8) Kicker Improvement (Fib + Price Projections)
Gate: 4022–4029
Kickers: 4046 → 4059.2 → 4090
Below gate: Layered support 4003 → 3985/3971; 3944 break would invalidate the weekly bull case.
9) Trade Scenarios
A) Swing — Long (bias)
Type: Buy Limit on pullback into 3985–3971
Entry: 3988 ±
SL: 3961
TP1/TP2/TP3: 4029 / 4059 / 4090
Probability: 62% ↑
Confirmation: RVOL ≥ 1.1 + positive delta + 1H close above 4012/VWAP.
B) Reversal / Edge-Fade — Short (conditional)
Type: Sell Limit from 4046–4059 only on strong rejection
SL: 4066
TP1/TP2/TP3: 4029 / 4011 / 3995
Probability: 48% ↓
Confirmation: Negative delta + failure to close 1H above 4059 + RVOL rolls < 0.9.
Invalidation: 4H close >4066.
C) Scalping — Long (execution)
Type: Buy Stop >4022; add only after 15m/1h close >4029
SL: 4014
TP1/TP2: 4036 / 4046 (move SL to BE after TP1)
Probability: 58% ↑
Confirmation: RVOL ≥ 1.2, green delta, no sharp sell-off at 4046.
10) (Quick Kicker Reference)
4022 is ignition; sustained closes >4029 activate 4046 → 4059.2; 4090 is weekly decision/supply.
11) Macro Calendar — Week Ahead (Cairo)
Mon: Central-bank speaks / bill auctions.
Tue: Sentiment/Business surveys; secondary inflation prints.
Wed: Key inflation/central-bank minutes (if scheduled).
Thu: US jobless claims + activity gauges.
Fri: Consumer sentiment / inflation expectations.
Always re-check your platform calendar for exact times and adjust risk.
12) Arabic Quick Summary (one-liner)
Uptrend, buy dips 4003/3985, gate 4022–4029 → 4046/4059, fade 4046–4059 only with rejection & red delta, break 3944 kills weekly bull.
13) Quick Reference (levels)
Supports: 4003 • 3985 • 3970.65 • 3944.2
Gate: 4022–4029
Upside: 4046 → 4059.2 → 4090
Invalidation (Swing): Daily break <3944.
Disclaimer: Educational content only; not investment advice. Trading involves substantial risk.
🏆 Winners trade with XAUMO

XAUMO GOLDEN REPORT – The Golden Analysis for XAUUSD (Footprint)XAUMO GOLDEN REPORT – The Golden Analysis for XAUUSD (Footprint 15m/60m/240m/1D)
🗓️ Date/Time: 3 October 2025 — 08:15 UTC+3
📊 Prices now: Ask 3851.77 / Bid 3851.47
Today’s levels from the footprint: 3863/3859 = intraday resistance — 3855 = Pivot — 3848/3840 = trading support — 3819 = deeper support.
15 Minutes (Scalping)
Price action: A quick buying thrust to 3851.7 then a sharp pullback; positive-delta candles at the top followed by negative-delta blocks = failed buying and quick distribution.
Volume: A volume explosion on the brief breakout, then calm with a negative tilt — the seller is holding the reins for the moment.
Range: 3859 ↔ 3848; every rise to 3855–3859 is met with offers (absorption).
60 Minutes
Internal trend: Down/sideways below 3860; a sequence of negative blocks on the minor highs.
VWAP/Fibo: Price is below the 3855 pivot and near the 50–61.8% retracement of yesterday’s wave, which favors an extension lower toward 3840 if the bounce fails.
4 Hours (240m)
Structure: After a weekly high, an orderly correction from the 3890s; the nearest important low is 3819.3, and a mid-balance zone is 3840–3828.
Momentum: Tilted to the downside with short-term lower highs.
Daily (General Trend)
Larger trend: Up, but with two clear days of profit-taking.
Candles/Volume: Longer upper wicks + elevated volume at the highs = distribution. Holding below 3860 keeps the corrective scenario open toward 3828–3819.
XAUMO’s Plan (Educational only, not advice)
The preferred scenario today: sell the pullback to the pivot.
Order Type Entry Stop Loss Take Profit Confidence
Main Trade Sell Limit 3855.20 3863.60 3838.00 🔥 81%
Reason (focused and straight):
3855–3859 is a repeatedly offered area (absorption + negative delta after a failed 15m thrust).
Staying below VWAP/Pivot 3855 = bearish bias toward 3840/3838.
60m structure is short-term down; any rise toward 3859 is likely just a pullback.
Alternative plan (if it rips upward):
Buy Stop 3864.20 → TP 3878.50 → SL 3856.80 only if a 15m candle closes above 3864 (price acceptance above resistance).
Invalidating the bearish scenario:
A steady close above 3864 cancels the short and shifts thinking to buying the breakout as above.
Risk management:
Risk ≤ 0.6% of capital; no chasing — keep your entry pending at the specified zone.
Conclusion: Today the market tends toward a corrective decline below 3860. Sell the pullback from 3855–3859 and target 3838; give new highs their due only if there is acceptance above 3864 — otherwise, the plan is bearish.

XAUMO GOLDEN REPORT - XAUUSD Technical Breakdown📊 XAUMO GOLDEN REPORT - XAUUSD Technical Breakdown
🗓 Date: Wednesday, October 1st, 2025
🔍 15-Min Chart (Scalping / Fast Entries)
Current Situation: Heavy sideways chop around 3863, low volume, neutral delta = no clear control by buyers or sellers.
Fib Levels: Price failed to hold above the 100% Fib (3875.45) and is now trading below 61.8%.
Pressure: No real bullish or bearish pressure → market in "decision-making" phase.
Decision: Stay OUT for now. Wait for a strong break above 3870 or below 3855 with high volume.
⏱ 1H Chart (Intraday Movement)
Momentum: Clearly fading, consistent negative delta, decreasing volume on the way up.
Fibonacci: After hitting the 125% level, price failed to push through 138% (a classic resistance zone).
Divergence: Negative delta divergence forming = buyers are losing strength while price tries to climb.
Decision: Watch 3858. A confirmed break opens the door to 3840 — fast pullback likely.
🕓 4H Chart (Mid-Term Outlook)
Trend: Still bullish, but the most recent candle shows clear loss of momentum.
Structure: Double top formation likely — two peaks without higher high breakout.
Support Zones: Strong support around 3840–3820 zone.
Decision: DO NOT buy highs. Wait for a correction or a strong 4H candle close above 3875.
🗓 Daily Chart (Macro Direction)
Overall Trend: Strong bullish trend still intact.
Volume: Volume is decreasing with each new high — clear volume divergence.
Candlestick: Today's daily candle might close as a "Spinning Top" — signaling indecision.
Warning: Market likely needs to breathe; profit-taking could be around the corner.
🔥 Final Summary & Hypothetical Trade (Not a signal – analysis only)
Order Type Entry Stop Loss Take Profit Confidence
Sell Sell Limit 3869.50 3875.50 3844.00 🔥 84%
🧠 Justification:
Strong resistance at the 100% Fib (3875).
High sell volume & inability to print new highs.
Negative divergence in Delta & Volume on lower TFs.
Signs of exhaustion showing up in recent candles.

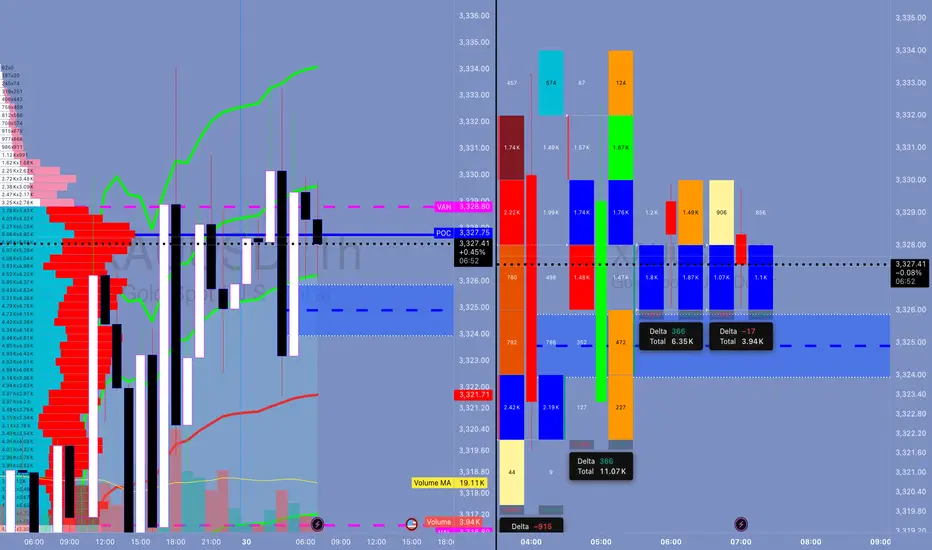
XAUMO XAUUSD (Gold Spot) ANALYSIS | AUG 01, 2025 | CAIRO TIME GMThis is a stealth bullish accumulation day. Market maker completed a fake drop and now prepping breakout. Play long bias from control zone with stop-hunt fade backup. Schabacker would call this a false breakdown spring + congestion base rally.
XAUUSD (Gold Spot) ANALYSIS | AUG 01, 2025 | CAIRO TIME GMT+3
🔍 Multi-Timeframe Technical Breakdown (Daily → 5m)
1️⃣ Price Action & Patterns
Daily: Bullish rejection tail forming (pin bar) off VAL (3,288). Strong buyer defense.
4H: Classic bullish engulfing off VAL support. High rejection wick to downside. Micro-structure shows market maker trap.
1H: V-shape recovery seen. Absorption bar confirmed via footprint delta spike.
15m: Buyers stepping in at POC (3,289.35), stealthy buying—confirmed by divergence between delta & price.
5m: Accumulation in box range between 3,289–3,292. High absorption on bid side, low offer lifting—sign of stealth long build.
2️⃣ Volume & Delta Footprint
POC Cluster across all TFs: 3,289.00–3,291.50 is the control zone.
Volume Node Rejection at 3,288 = confirmed buyer base.
Delta: Absorption → sellers hitting bids but no follow-through = market maker trap → bullish implication.
Volume Spike at 3,288 = fakeout move likely manipulated to hunt stops.
3️⃣ Support/Resistance
VAL: 3,288 🔥 Strong Demand Zone
POC: 3,289.35–3,291.75 🧠 Smart Money Zone
VAH: 3,292.80 🎯 Break above confirms momentum
Res. Extension: 3,296.20, 3,300
Fibonacci Confluence: 3,288 = 61.8% golden retracement from recent rally
5️⃣Volatility
Compression near VAH = Volatility Expansion imminent.
Expect Breakout in next 1–2 hours (likely post 09:00 Cairo Time – Kill Zone)
6️⃣ Market Maker Philosophy
Last 3 days show liquidity vacuum trap below 3,288.
MM has triggered stop hunts to shake weak longs.
Building long inventory stealthily under POC.
Expecting rally trap to suck in breakout buyers → then retrace → final breakout continuation.
🧨 JEWEL TRADE ENTRY (Highest Probability)
📈 Order: Buy Stop
🎯 Entry: 3,293.10
🛑 Stop Loss: 3,287.70
💰 Take Profit: 3,302.40
📊 Confidence: 87%
🧠 Justification: Breakout of VAH/Golden Zone + High Volume Node = Trend Shift Confirmed
This is for EDUCATIONAL PURPOSE ONLY, and not financial advise.
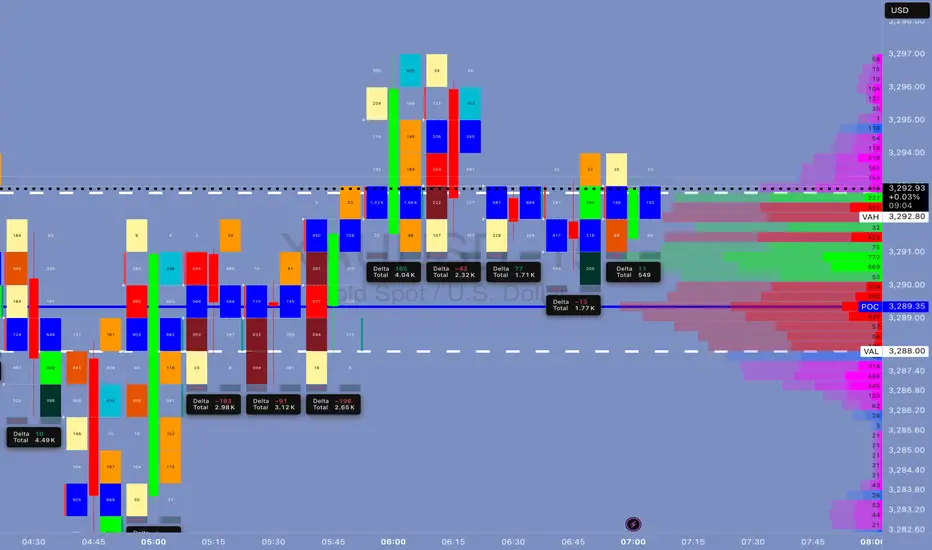
Schabacker's Gold Trap Inside the Trap: Schabacker Congestion, VWAP Warfare & The Silent Distribution on XAU/USD
1. The Congestion Area – Schabacker Style
🔍 What We Saw:
Price action rotated in a tight range: 3,324.5 - 3,329.5.
This is not random. This is Schabacker’s classic Congestion Zone:
Duration: 12+ hours
Width: ~5 points
Volume: tapering near edges
Failed breakouts on both sides = classic neutral wedge compression.
🎯 Schabacker Teaching Applied:
"Congestion areas are places of rest and preparation — they are the breeding grounds of significant breakouts or breakdowns."
From his bible “Technical Analysis and Stock Market Profits”:
Congestion after a trend → likely a continuation (but confirm via breakout volume).
Multiple failed breakouts = deceptive strength/weakness → traps.
Range becomes psychological equilibrium → breakout from this zone is explosive.
📘 Lesson:
Watch for breakout confirmation only AFTER price escapes the congestion and retests the range (confirm with volume and delta). If volume weakens and price returns inside = fakeout, fade that sh*t.
🔥 How Schabacker Explains July 29 Price Action
"This was a classic congestion scenario with symmetrical compression, rejecting value high and value low over and over — a balanced market ripe for an imbalanced expansion."
Price coiled with lower highs + higher lows inside the value zone = triangle-like congestion.
Breakout attempts both sides failed = energy stored.
Delta flipped negative toward the close + volume dried = distribution inside the congestion.
✅ Congestion was not random chop. It was the Smart Money disguising their exit before slamming price.
⚔️ ENHANCED STRATEGIC OUTLOOK FOR TODAY (JULY 30, 2025)
🎯 Bias: Short bias unless proven wrong by breakout + acceptance above 3,329.50
Schabacker’s congestion broken to the downside = high probability short trigger.
First target = edge of congestion zone @ 3,316.80 (previous VAL).
Second target (extension) = swing low anchor near 3,310.
📘 Volatility Note:
After tight range like this (Schabacker Box), volatility expansion is imminent. Don’t get caught trading inside — trade the break and retest.
💣 HYPOTHETICAL TRADE PLAN: SCHABACKER STRATEGY IN PLAY
Order Type: 🔻 Sell Stop Below Congestion Break
Entry: 3,322.00
Stop Loss: 3,330.00 (above congestion top + failed breakout zone)
Take Profit 1: 3,316.80 (edge of range, VAL)
Take Profit 2: 3,310.00 (target from congestion width projection)
Confidence: 78%
🧠 Justification:
Factor Explanation
VWAP Flatlined = balanced market
FVRP Price camped near POC = equilibrium
Footprint Absorption at highs, silent selling = distribution confirmed
Delta Early buyer strength flipped = trap
Schabacker Congestion Classic box breakout setup = timing the expansion
🧠 EDUCATIONAL SUMMARY — WHAT YOU JUST LEARNED
✅ Schabacker’s Congestion Area Tactics
Congestion after a move Leads to continuation (trend resumes after pause)
Multiple failed breakouts Traps traders = setup for fakeout fade
Volume dries inside box = Explosive breakout likely
Use congestion width To project breakout targets
You don't fade chop — you exploit it after the breakout.
Don't waste your bullets inside the box. Wait for the beast to break loose — then you unload.