KDK/USDTGATE:KDKUSDT
**KDK / USDT (4H)**
Market structure remains **bearish 📉**, with price holding weak near local support.
🔴 **Key Resistance Zones** at **0.2777 🚫** and higher at **0.2878 ⛔**, with a major level near **0.2957 🧱**
🟢 **Immediate Support** around **0.2730 🛡️**, with downside risk toward **0.2726 ⚠️**
📉 Price is **consolidating after a strong sell-off**, showing limited buying strength.
🎯 A **short-term relief bounce** could retest **0.2777**, but rejection there keeps structure weak.
⚠️ Failure to hold **0.2730** may lead to further downside continuation.
⚡ **Quick Take:**
* Trend remains **bearish 📉**
* Price is **compressing near support 🧊**
* Upside moves look **corrective unless resistance is reclaimed 🔓**
**Disclaimer:** *For educational purposes only 📚 — not financial advice 💡. Always do your own research and manage risk ⚠️.*
MEME

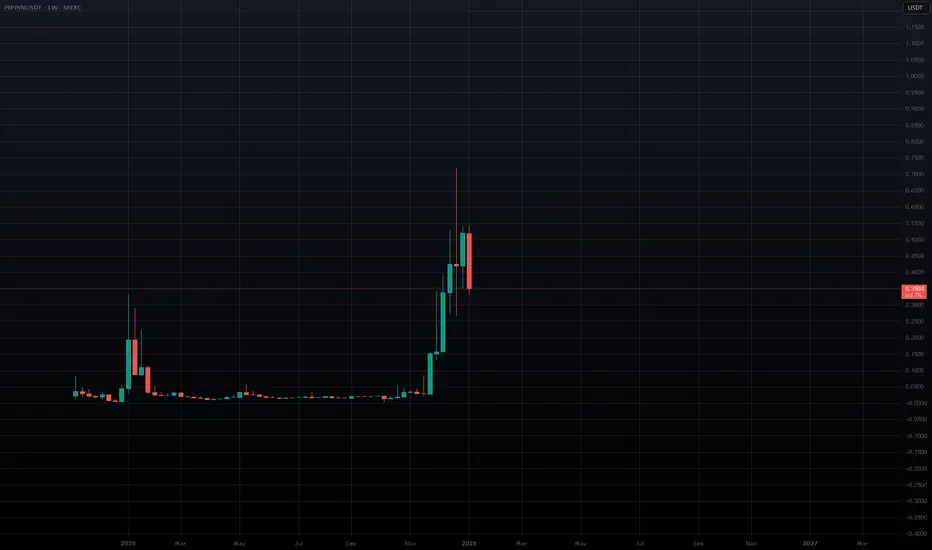
PIPPIN: Great example of institutional level value extraction.Have you seen these tokens which pump 20-50x (sometimes even 100x++) before violently crashing and flat lining for months on end, just to do it again or be abandoned forever?
They are handled by professionals, backed by deep pockets.
We aren't talking small ball, pump/dump groups.
These are institutional level, with some reaching up to $100M+ turnover, billions in market cap.
Handlers pay:
KOLs to shill buyers/long positions before big crashes, to extract value from panic sellers and long liquidations.
KOLs to shill sellers/short positions before big pumps, to extract value from FOMO buyers and short liquidations.
exchanges for listings, market makers for liquidity
Meanwhile they cleverly abuse the pump.fun AMM LP curve mechanics, index pricing and monitoring large perp buyers/sellers to hunt liquidations.
Once the game has run it's course, the token's AMM pool is dumped into, drained and the token goes back to marginal value.
Handlers hold on to large amounts of supply, while walking away with profits.
Reality of the pump.fun AMM bonding curve;
You can not sell more value than later buyers inject.
While early sellers drain real value, late sellers hold unrealizable paper gains.
In normal markets, price reflects belief, liquidity, and risk;
manipulation requires capital
In these pump.fun AMM plays, price reflects how far along the curve you are;
manipulation requires timing, not conviction
Early buyers acquire massive supply at minimal cost, while later buyers must pay exponentially more and affect price more than early buyers.
This is not conviction, price discovery or speculation, it’s mechanical value extraction.
The curve is built for this, it’s doing exactly what it was designed to do;
maximize early upside
compress price discovery
transfer value from late participants to early ones
PIPPIN is an interesting project, with a great mind behind it.
The problem is that pump.fun tokens like this are abused and exploited so hard, leaving an immense amount of dead money/bag holders.
It is uncertain to me if even a single one of these tokens will be able to carry value into the long-term.
Pepe: Where can I buy a frog?The asset showed strong momentum growth, so it is safe to buy in the areas indicated on the chart.
The most important thing is to look at the LTF before entering. If there is a long model, enter. Otherwise, skip it and wait for a lower price.
OKX:PEPEUSDT.P

DOGE Macro analysis | The bigger picture | Long-term holdersCRYPTOCAP:DOGE
🎯 Uptrend remains intact from the multiyear wave 4 running flat bottom. We could still be in wave 4, as characterised by their long, complex ranges with shallow retracement 0.236 Fibs in this case. The initial upside resistance is the weekly pivot at $0.29, and macro wave 5 has a terminal target off a poke above all-time high at $0.76.
📈 Weekly RSI has printed bullish divergence as price tests the weekly 200EMA. Overcoming this is the first challenge and will add confluence to a bullish move.
👉 Analysis is invalidated below wave 4 and the S1 pivot, $0.0986
Safe trading

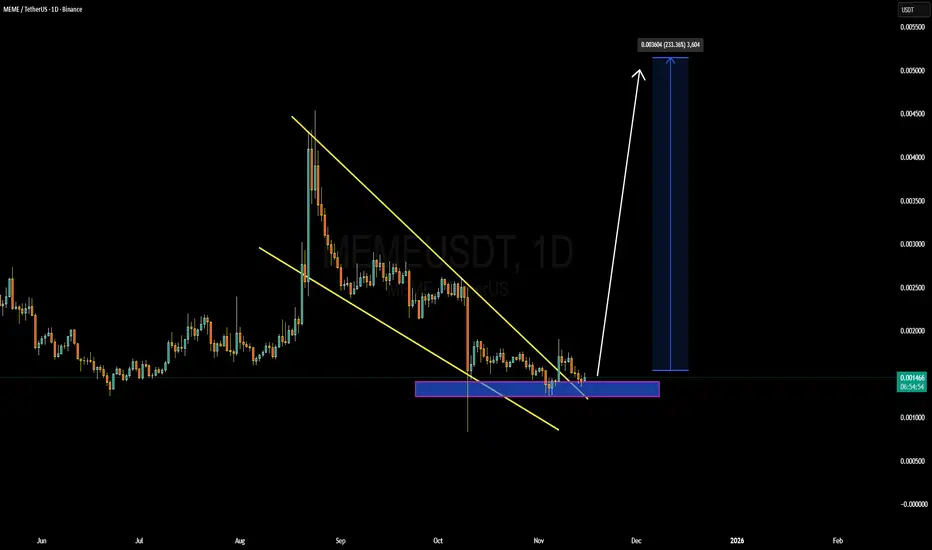
#MEME/USDT is Bullish#MEME
The price is moving in a descending channel on the 1-hour timeframe. It has reached the lower boundary and is heading towards breaking above it, with a retest of the upper boundary expected.
We have a downtrend on the RSI indicator, which has reached near the lower boundary, and an upward rebound is expected.
There is a key support zone in green at 0.001144. The price has bounced from this zone multiple times and is expected to bounce again.
We have a trend towards consolidation above the 100-period moving average, as we are moving close to it, which supports the upward movement.
Entry price: 0.001172
First target: 0.001194
Second target: 0.001229
Third target: 0.001271
Don't forget a simple point: money management.
Place your stop-loss below the support zone in green.
For any questions, please leave a comment.
Thank you.

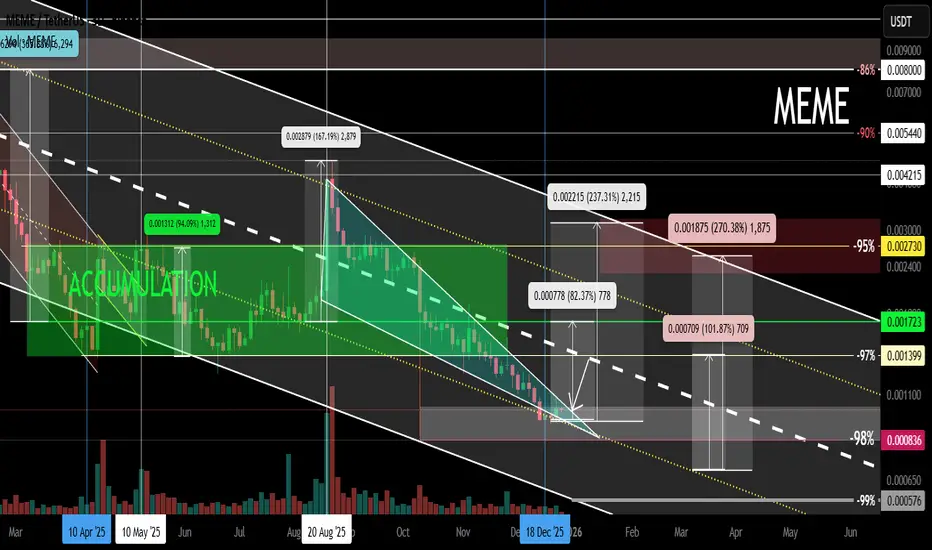
MEME Local Trend. Wedge. Reversal Zone. December 27, 2025Logarithm. 3-day timeframe.
The main trend is shown for clarity (dynamic support zone of the internal descending channel).
-98% decline from the high
The price is near the long squeeze zone, 10 10 2025. A descending wedge has formed, and the price is being squeezed. This is the local trend reversal zone if its resistance is broken, which can occur through sideways consolidation, i.e., a double bottom or dragon...
Bloom Energy. Is it a memestock and is it about to blow up in spectacular fashion?!
Granted it's not a pure meme with no real Business; it has real tech, revenue and a credible long term-value theme.
But the stock is trading with meme like valuation, with flow driven volatility, and sentiment.
That is why this Head and shoulders demands respecting (until invalidated ofc)
I believe risk/reward is more speculative than fundamental.

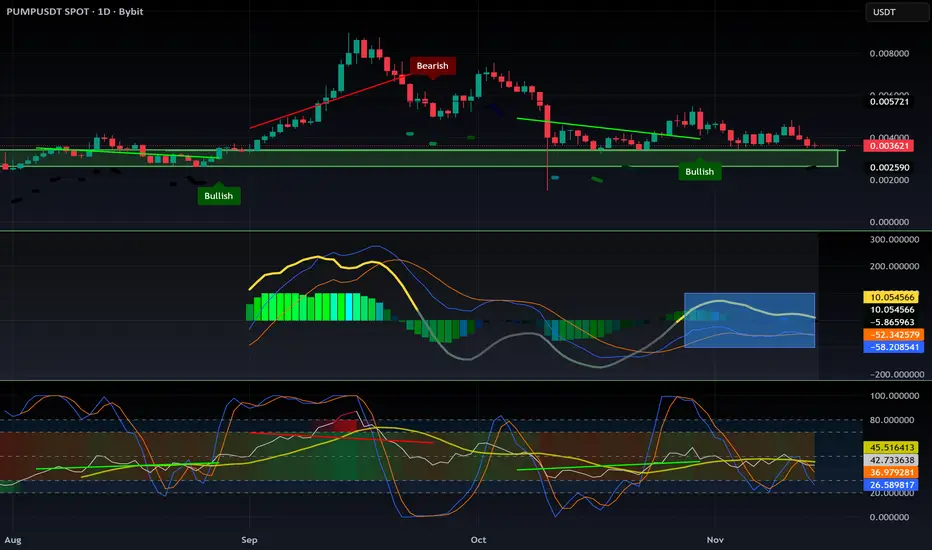
PUMPUSDT = Time to buy?🐸 NYSE:PUMP #PumpFun ➖ Time to buy?
Chart (PUMPUSDT):
PUMP is down 72% from its all-time high. Looking at the liquidation map, this looks like a solid entry point to grab some PUMP for part of the portfolio with around +150% upside potential.
Take-profit target is $0.007 ➖ right where the biggest cluster of short liquidations sits.

Crypto Winter 2026: BTC 75% Correction PT 30 000 USDInvestment Memo: Anticipating a 2026 Bitcoin Crypto Winter
By ProjectSyndicate
________________________________________
1. Executive Summary
❄️ Summary view: This memo treats 2026 as the high-probability crypto winter year for Bitcoin following the 2024 halving, with a working top around 123,000 USD and an expected cycle low near 30,000 USD, implying roughly a 75–76% drawdown from the peak. This is fully consistent with historical Bitcoin bear markets, which have typically seen 75–85% corrections from all-time highs.
❄️ Contrarian hook: While mainstream narratives still focus on ETFs, institutional adoption, and “crypto as macro asset,” the explosion of leverage (Aster DEX up to 1001x), CZ-backed perps, and BNB-chain meme-coin mania are treated here as late-cycle excess—classic topping signals rather than sustainable foundations.
________________________________________
2. Thesis & Target Range
📊 Cycle top assumption: cycle high of ~123,000 USD per BTC. That is well within the band implied by recent ATH prints ~125–126k in mid-2025 and aligns with a typical “blow-off” overshoot above the prior psychological milestone at 100k.
📊 Cycle low assumption: 30,000 USD downside target represents a drawdown of ~75.6% from 123,000 USD—slightly shallower than the 2018 crash (~84%) and broadly in line with the 2021–22 bear (~77% from 69k to ~15–16k). That keeps this winter brutal but not apocalyptic, consistent with a maturing asset still capable of deep mean reversion.
🧮 Math check on prior winters
• 2017–18: 19k → 3k ≈ 84% drawdown
• 2021–22: 69k → 16k ≈ 77% drawdown
• 2025–26 (your base case): 123k → 30k ≈ 76% drawdown
This places scenario squarely inside the historical corridor of 75–85% post-peak corrections.
________________________________________
3. Historical Pattern: Why Large Drawdowns Are the Base Case
📉 Structural volatility: Bitcoin’s entire price history is punctuated by massive post-parabolic drawdowns—early cycles saw 86–93% collapses, later ones 75–80%. Each halving-to-peak run has ended in a violent crash once marginal buyers are exhausted and leverage saturates.
📉 Time dimension: Historically, the “winter” phase has lasted 9–18 months from peak to capitulation and then a long grinding accumulation. The 2017 peak to 2018–19 bottom spanned roughly a year; the 2021 peak to 2022–23 nadir similarly took about a year, with a further period of sideways chop.
📉 Drawdown normalization: Traditional asset allocators increasingly frame Bitcoin as an alternative macro asset, but the statistical reality is unchanged: drawdowns of 70%+ are not outliers—they are typical. An assumption of only shallow corrections is the non-consensus view; a 75% winter is actually the boringly normal scenario from a historical distribution standpoint.
________________________________________
4. Where We Are in the Current Cycle
⏳ Post-halving positioning: The fourth Bitcoin halving occurred in April 2024, cutting block rewards to 3.125 BTC and effectively tightening supply. Historically, the major blow-off tops occur 12–18 months after halving, as reduced supply + narrative momentum pulls in late-stage retail and leverage.
⏳ Evidence of late-cycle behavior: By mid-2025, Bitcoin had already pushed to new ATHs above 100k and then into the ~120–126k region, with growing signs of ETF saturation, institutional FOMO, and leverage-driven upside. From a purely cyclical lens, we are more likely in the “euphoria / distribution” band than in early bull territory.
________________________________________
5. Aster DEX & Meme-Coin Mania as Contrarian Top Signals
🚨 Aster DEX as the “Hyperliquid of BNB Chain”: Aster DEX, emerging from APX Finance and Astherus and explicitly leveraging Binance’s network, is marketed as a high-performance perp DEX with MEV-resistant trading and leverage up to 1001x, backed by CZ/affiliate ventures. From a contrarian perspective, this is textbook late-cycle: maximum leverage offered to the broadest possible audience at or near cycle highs.
🚨 BNB meme-coin carnival: Simultaneously, BNB-chain meme coins and speculative listings (Maxi Doge, PEPENODE, various new BNB meme projects) are being pushed as high-beta “next 100x” plays. Historically, similar episodes—2017 ICOs, 2021 dog-coin and NFT mania—have coincided with or slightly lagged Bitcoin’s macro top rather than signal early-cycle value.
🎭 Narrative pattern recognition: In prior cycles, the market’s center of gravity shifted from Bitcoin to highly speculative edges (ICOs, NFTs, obscure DeFi, meme coins) at the very end of the bull. Late-cycle liquidity rotates into lottery tickets while BTC quietly transitions from “must own” to “source of funds.” The current Aster + BNB meme complex rhymes strongly with that historical script.
________________________________________
6. Why a 75% Drawdown to 30,000 USD is Plausible
🧊 From 123k to 30k mechanically: A move from 123k to 30k doesn’t require structural failure; it merely requires a reversion to historical drawdown. That kind of move can be achieved by:
• ETF inflows slowing or turning to mild outflows
• Derivatives funding turning negative as carry trades unwind
• A moderate macro risk-off (equities correction, higher real yields)
🧊 Maturing, not invincible: As adoption broadens—spot ETFs, institutional mandates, integration into macro portfolios—Bitcoin’s upside may gradually compress, but liquidity cycles and leverage cycles haven’t vanished. Even if each cycle’s drawdown edges slightly lower from ~85% to ~77%, there’s no reason to assume sub-50% drawdowns are the new regime. A respectable winter at 30k is almost conservative relative to earlier -80%+ events.
________________________________________
7. Why the Floor Might Hold Above Prior Lows
🛡️ On-chain + macro floor logic: Without pinning to proprietary on-chain models, two simple supports for a 30k floor are:
• Institutional cost basis: A growing chunk of supply is held via ETFs and treasuries accumulated in the 40–70k band. Many of these players may defend positions with hedging or incremental buying in the high-20k / low-30k region rather than panic-sell at -70–80%.
• Realized price ratcheting higher: Across cycles, Bitcoin’s long-term realized price average on-chain cost basis tends to step up structurally. Past winters have bottomed not far below that long-term average; as the realized base rises, so does the likely bear-market floor.
🛡️ Regime shift vs. previous cycles: In 2018 and 2022, Bitcoin was still climbing the wall of institutional skepticism. By the mid-2020s, you have:
• Spot ETFs
• Corporate treasuries
• Sovereign/FI experimentation
These players typically do not capitulate to zero; they reduce risk, but they also accumulate in stress. That supports the idea of a shallower floor (30k) instead of a full 85–90% purge.
________________________________________
8. Timing the 2026 Winter
🧭 Halving + 18-month lag template: Using the standard halving cycle template, major tops often occur 12–18 months post-halving, and winters then dominate the following year. With the fourth halving in April 2024, a 2025 ATH and a 2026 winter are exactly what the simple cycle model would project.
🧭 Scenario sketch
• 2025: Distribution at elevated levels (80–120k+), persistent Bitcoin as digital gold narrative, alt & meme blow-off, over-issuance of high-leverage products (Aster, other perps).
• 2026: Liquidity withdrawal + ETF fatigue + regulatory flare-ups → a stair-step decline through 80k, 60k, 45k, culminating in capitulation wicks into the 30–35k zone before a multi-month bottoming process.
________________________________________
9. Market Structure Stress Points in a Winter Scenario
🧱 Leverage cascade risk: Perp DEXs offering hundreds to 1000x leverage attract the most price-insensitive flow at the worst time. When BTC breaks key levels (e.g., 80k → 60k → 50k), auto-deleveraging and forced liquidations can accelerate downside far beyond spot selling. Aster-style platforms, while innovative, mechanically create risk of cascading liquidations in a volatility spike.
🧱 Alt & meme vaporization: BNB meme coins and other speculative assets that rode the late-cycle pump will likely see 90–99% drawdowns, as in previous winters where smaller alts dramatically underperformed BTC. In your framework, BTC at 30k is actually the “high-quality survivor” outcome; the majority of late-cycle tokens may never reclaim their peaks.
🧱 Mining and infrastructure: With halved rewards and a much lower BTC price, marginal miners will be forced offline, just as in prior winters. That tends to deepen the short-term pain but ultimately improves the cost curve (strong miners consolidate, inefficient ones exit), laying groundwork for the next cycle.
________________________________________

DOGE, Weekly bullish divergence!Uptrend remains intact from the wave 4 bottom. We could still be in wave 4 as they are characterised by their long, complex ranges. A flat or a triangle is possible.
Wave (1) appears complete as a leading diagonal followed by a deep wave (2), which is expected after this pattern. Price is bullishly riding the weekly 200EMA but bearish below the pivot. Wave (3) should be powerful and fast; any slow grind may hint that we are still in wave IV
🎯 Terminal target for the business cycle could see prices as high as $1.7 based on Fibonacci extensions
📈 Weekly RSI has printed bullish divergence, a good sign but it can take weeks to play out
👉 Analysis is invalidated below wave (2)

PENGU - BEARISH $PENGU - price analysis 🟥
Very bearish trend at the moment & no buy pressure📉
Price will likely continue to fall toward 0.00800$ lower key demand zone! 📉
Possible setup & key levels are in my charts.🐧
Not a financial advice.

(TOSHI) toshi Is Toshi a fluke this year? So far, the price of the meme has not left the price of the origin starting price. 10 months and no change in price for long term holders, not great. Meme stability not a fluke? The price is not lower than the starting price and that is not always a bad thing because keeping money is better then losing money.

MEMEUSDT Forming Falling WedgeMEME/USDT is showing a highly interesting technical setup: price action is carving out a falling-wedge pattern, with tightening range lows and retracements that suggest compression and accumulation. Volume is improving, which adds credibility to the idea that smart money or traders are building positions and waiting for a breakout to the upside. If MEME can break above the upper wedge trendline on rising volume, that could spark a strong reversal.
On the fundamentals side, MEME (from Memeland) is more than purely speculative — it's tapping into growing meme-token demand while also trying to create real community traction. Even though it has characteristics typical of meme coins (viral potential, high volatility), the project still has active social engagement and volume, making it relevant at a time when meme-coin utility and narrative are being explored more seriously in the crypto community. The token’s identity as a meme coin makes it an important part of social-finance themes that many retail investors still flock to.
From a trading strategy perspective, the ideal entry would be on a confirmed breakout above the falling-wedge upper boundary, ideally supported by a strong volume bar and followed by a retest of that breakout level. That retest could provide a good risk-reward entry opportunity. A sensible stop-loss could be placed below the lower wedge or below a recent swing low, helping to define risk clearly. If the breakout holds, the measured move could produce a significant upside, especially given the wide range of price compression.
Doge Coin 0.06$ inc soon lolHey guys,
Doge coin has been sleeping for a while and its going to wake up soon but first price needs to
Touch down on the key FIB level at 0.06$ which is in my opinion the safest entry price.
We might see a small pump to 0.20$ first but after that 0.06$ is a magnet so don't be fooled
When it pumps a little in the upcoming days.
Let me know what do you guys think about this.

$PUMP: when to accumulate?There’s a strong support zone between $0.02900 and $0.03300.
At the current price, NYSE:PUMP already looks like an attractive buy in my opinion — but if it drops into the green box, I’ll definitely go long.
The lower it goes, the better the entry.
My plan is simple:
➡️ Enter
➡️ Take profit on a quick +10% move
➡️ Fire and forget
This asset is extremely volatile. There will be many more dips and plenty of trading opportunities — so stay cautious, get in and out fast, and don’t get greedy.
DYOR.
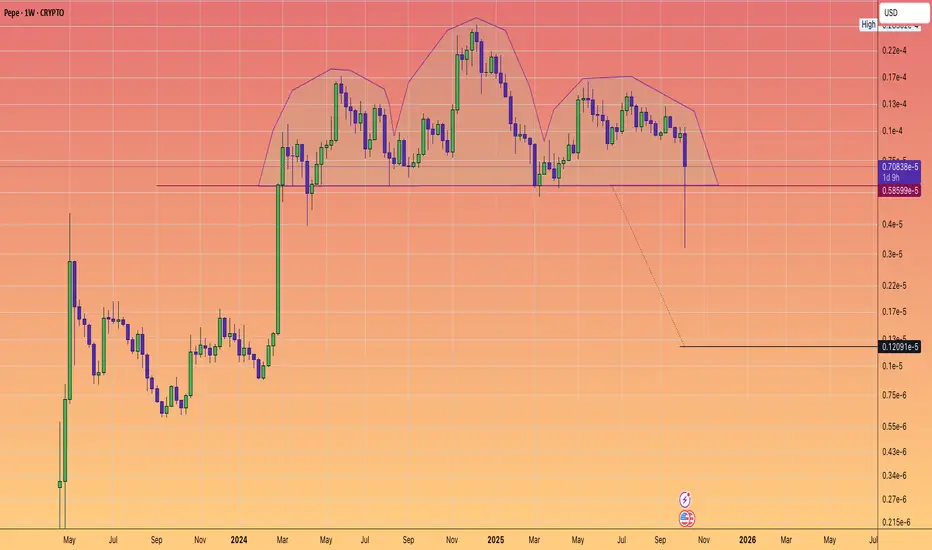
$PEPE: MAJOR HEAD and SHOULDERS BREAKDOWN WARNING.🐸🐸🐸
⚠️⚠️⚠️
Pattern formed, Big Move Ahead?
The weekly chart of #Pepe has confirmed a classic head and shoudlers pattern - a powerful bearish setup.
After over 1.5 years of building this structure, price decisively pierced the neckline with a sharp drop.
Suggesting that a weekly close below the neckline could trigger an accelerative towards the pattern target.
Key Levels
Neckline: $0.0000058599
Target: $0.0000012091
Why does it matter?
Head and shoulders are the most trusted reversal technical patterns. Coupled with declining and weakening sentiment. This pattern warns of more downside--- unless buyers can mount a quick rescue.
What's your strategy?
Are you shorting the breakdown, waiting for the target, or looking for a fake-out reversal?
Drop your thoughts/Analysis or questions in the comments!
SUSHI - FOLLOWING THE PLAN! 10% down on SEED_DONKEYDAN_MARKET_CAP:SUSHI - following exactly the plan.
Gamebreaker incoming? 🎮

DOGE More downside to come?CRYPTOCAP:DOGE Price is testing the bottom of the channel and pivot point as resistance, where it is likely to be rejected.
Wave (2) appears complete after the Friday flash crash, hitting the ‘alt-coin’ golden pocket, 0.786 Fibonacci retracement. The trend remains down, so this is the higher probability. Price needs to overcome the heavy resistance ahead before we can talk about being bullish long-term.
📈 Daily RSI has printed bullish divergence, which is bullish
👉 Continued downside has a target of the 0.618 Fibonacci retracement and High Volume Node $0.12
Safe trading

FARTCOIN - BULLISH SETUP SHORT TERM SEED_WANDERIN_JIMZIP900:FARTCOIN - short term outlook: 📈
Highly oversell + bull div. Likely bullish to visit upper resistance 📈 (correction only).

JELLYJELLY + 180% UP!!!! I called for a +40% bull move on $JELLYJELLY , and guess what?
THIS FU.....CKING ONE IS UP 180%+!!! 🔥
-70% down, then 180%+ up...
I don't understand these markets anymore😂

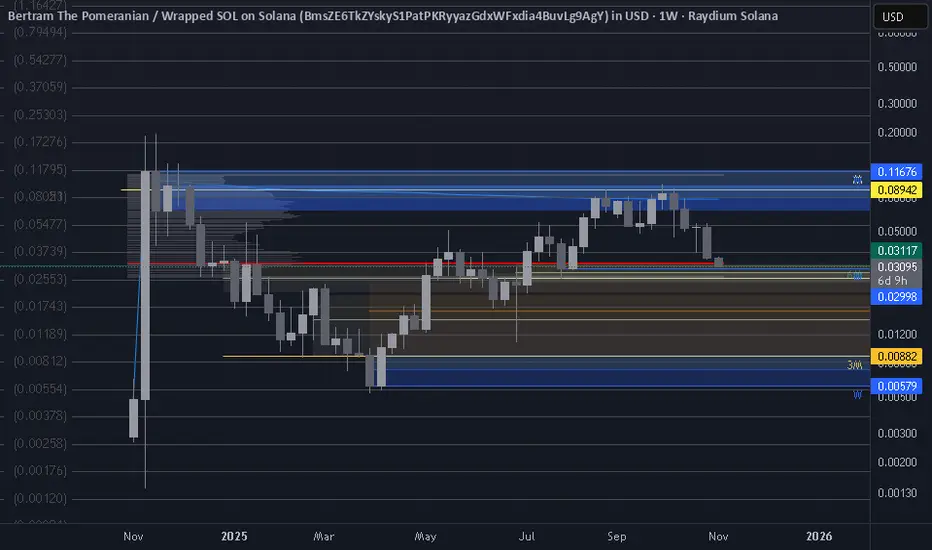
$bert around the poc and htf levelsyou want to be looking at $bert around 2c-3c, the chart is backtesting the volume POC, and has a cluster of htf monthly levels and the VAL just below 3c. Grid cheat sheet for horizontal S&R
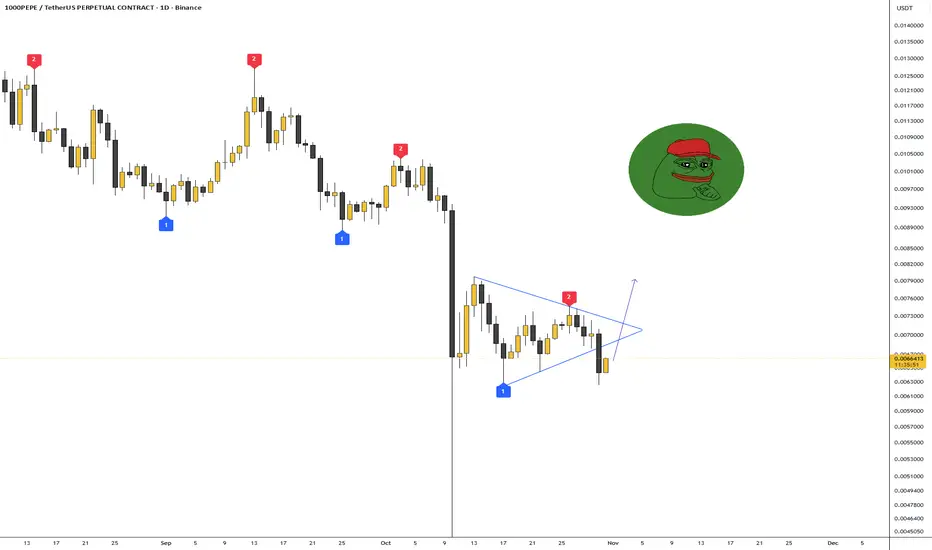
I'm seeing a pretty good long setup on PEPEI'm seeing a pretty good long setup on CRYPTOCAP:PEPE #PEPE 🤔.
The trade is 1 to 4.
Entry: $0.0066162
Take Profit: $0.0079400
Stop Loss: $0.0062400
Based on the liquidation map, the trade is justified. You can give it a try.
Bitcoin lost its low time frame — red day pressure aheadBitcoin has lost the low time frame structure around the $114.6K – $114.8K zone, signaling a possible shift in short-term momentum.
The break below this area indicates weakness, and BTC is now testing the mid-range levels while showing signs of slowing volume.
📉 Short-term view:
Momentum has turned bearish after rejection from $115.8K.
Next support zone sits around $108K – $109K, where buyers may try to step in.
If this level fails to hold, BTC could revisit $103K support — the key demand area from the previous range.
📊 Technical observation:
BTC’s structure shows a completed short-term top followed by a lower high formation.
This setup often confirms a local downtrend and can lead to several red candles before a new base forms.
💬 Summary:
Bitcoin lost its low time frame momentum, and we could be entering a red session.
We’ll monitor how price reacts near the $108K support zone to evaluate if buyers can regain control or if a deeper correction begins.
We follow the data, at this moment the marketview seems to be red, we will follow if this continues in the coming hours.
