MEMEUSDT — The Bull Last Stand: Accumulation or Total Surrender?📉 Overview
MEME/USDT is standing on the edge — between a massive accumulation opportunity and complete market capitulation.
The price is now sitting right above the major support zone (0.0012 – 0.00165 USDT), a key defensive area that has been tested multiple times since April 2025.
Each visit to this zone has triggered liquidity absorption and stop hunts, followed by short-lived recoveries — but never a sustained reversal.
Now, once again, the market is testing this zone for survival.
---
🧩 Price Structure & Technical Context
Primary trend: Long-term downtrend since late 2024, forming consistent lower highs and lower lows.
Dominant pattern: Potential accumulation base following a liquidity sweep — a classic signal of possible smart-money accumulation.
Recent wick reaction: Sharp downward wick that was quickly absorbed — often a sign of institutional defense or smart buyer entry.
Highlighted zone: This yellow box is more than just support — it’s the psychological boundary between recovery and collapse.
---
📈 Bullish Scenario — “Rebirth from the Bottom”
If the price manages to close above 0.0017 and successfully flip this zone into support, it may trigger the beginning of a structural reversal phase.
Potential targets:
Target 1: 0.002167 → first resistance / short-term profit zone.
Target 2: 0.002914 → key validation level for continuation.
Target 3: 0.004117 → structural confirmation of trend reversal.
Key confirmation:
A 2D candle close above the box, followed by a clean retest and sustained momentum.
If volume expands, a mid-term rally could unfold.
Technical narrative:
This setup could evolve into a textbook case of “liquidity sweep followed by a reversal.”
If confirmed, it might mark the start of a major accumulation cycle ahead of the next hype phase.
---
📉 Bearish Scenario — “The Final Floor Breaks”
If the price fails to hold above 0.0012, the next meaningful support lies near 0.000836, the previous low.
A confirmed breakdown below this zone would imply:
The end of the accumulation phase,
Entry into full capitulation,
And a likely panic-driven selloff as retail stop-losses are triggered en masse.
Bearish confirmation: 2D candle close below the support zone with a strong follow-through.
If that happens, bulls are temporarily out of the game until a new structure forms at lower levels.
---
🎯 Summary
This yellow zone is not just another support area — it’s the psychological battlefield where smart money decides the next chapter.
The market is now in a quiet tension before the storm:
Either we witness a legendary rebound from deep accumulation,
Or the final breakdown of a fading trend.
For disciplined traders, this is not the time to guess — this is the time to prepare for both outcomes with precision and patience.
---
⚙️ Risk Management Strategy
Only enter after clear confirmation (2D close + retest).
Risk per trade: 1–3% of total capital.
Take partial profits at each target.
Move stop-loss to breakeven once Target 1 is reached.
---
🧭 Additional Notes
Mid-term bias remains bearish, but early signs of re-accumulation are emerging.
This isn’t just another random bottom — it’s a strategic battlefield between smart buyers and aggressive sellers.
---
#MEME #MEMEUSDT #AltcoinAnalysis #CryptoReversal #LiquiditySweep #SupportZone #BreakoutWatch #CryptoTechnicalAnalysis #SwingTrading #SmartMoneyConcepts #MarketStructure
MEME

Clean EUR/USD nose touch tradeCheeky nose touch on eur/usd 1h tf, overall we are curently sliding down on nose edge, so we can expect some good shorts berfore touching bottom of the tunel.

$BONK: time to refill our bagsI believe we’re heading toward a new all-time high for Bitcoin (BTC).
Both CRYPTOCAP:OTHERS and CRYPTOCAP:TOTAL3 are showing strong bullish momentum, entering extremely oversold territory — a signal often preceding a major recovery.
November is also a historically bullish month for altcoins, which strengthens the case for an upcoming rally.
The probability of a +100% uptrend is very high.
The head and shoulders pattern was invalidated by the October 11th event, which completely shifted the market structure.
In my view, this is the perfect time to take positions and patiently wait for the market reset to play out.
🎯 Take-Profit Targets (based on Fibonacci levels):
TP1: $0.00001865
TP2: $0.00002145
TP3: $0.00002600
TP4: $0.00003220
Historically, when SEED_DONKEYDAN_MARKET_CAP:BONK starts pumping, it almost always reaches around $0.00003200 — and if that happens, we could see a parabolic move up to $0.00005000, marking the top of the altseason.
DYOR (Do Your Own Research).
#BTC #BONK #Altseason #CryptoMarket #Bullish #TradingSetup #Fibonacci #CryptoAnalysis #NovemberRally

DOGE - BEARISH MOMENTUM. #DOGE - price analysis:
Main trend remain bearish & the current price is stuck under the H4 downtrend📉
H4 DOJI. .
Upper big resistances:
0.19500 - 0.200 - 0.2100$
Local support (double bottom D1): 0.1750 - 0.17600$
As long as bulls remain stuck under 0.200$ on the daily basis, we may see another could see another dump to visit the 0.1500$ support area! 📉
To sum up:
Indecision phase with big volatility, but momentum is bearish.

(BTC) bitcoin "biggest losing candle ever"This looks like the biggest losing candle I've ever seen on Bitcoin, and the same goes for Ethereum. Huge single day losses for cryptocurrency. I find a winning a solution and instead the entire market of cryptocurrency loses big time all because they don't want me to be able to win. Decentralizing trades does nothing to protect information when comparing Coinbase to Coinbase wallet defi. The Defi of coinbase wallet is the same as Coinbase where some type of inside log knows data of my trades and I lose when I start putting my money in at the perfect time to win.

Fartcoin Wyckoff ReaccumulationCRYPTO:FARTCOINUSD looks to be in Wyckoff reaccumulation. Honestly, there’s nothing more to say, the chart speaks for itself.
We’re currently sitting in the spring zone, waiting for a bounce, retest, and move up. In my opinion, that should unfold over the coming months.
The risk here is that the spring I’m seeing might not actually be the spring, in that case, price could go lower. Still, I doubt it breaks below the current low; if it does, I’d say the downside risk sits around $0.5.
The trend is slowly curling upward, and I’m looking at potential targets of:
- Bear case: $2
- Base case: $3
- Bull case: $4

BONK has formed a bullish inverted Head and Shoulders pattern📊 SEED_DONKEYDAN_MARKET_CAP:BONK Update
SEED_DONKEYDAN_MARKET_CAP:BONK has formed a bullish inverted Head and Shoulders pattern 🟢👤
It has broken out above the red resistance zone 🔴, and the first target is the green line level 🟢

BONK - KEY DEMAND ZONE IS INSEED_DONKEYDAN_MARKET_CAP:BONK - update:
Price is sitting on key demand zone here.
Neutral zone H4; but If #BTC hold above level mentionned, then I expect to see some bull reaction soon here 📈
Key levels:
0.00001950 - 0.00002010 - 0.00002080 - 0.00002175 - 0.00002290.
POC point: 0.00002075 - 0.00002080.
Daily candle close above could confirm a bull breakout.

$PENGU is consolidating: long opportunityThe market is expected to cool down a bit after the recent CRYPTOCAP:BTC rally — that’s our chance to catch a solid long setup. Check the green box for the entry zone!
Entry in the green box, the lowest possible
🎯 Target: $0.035, $0.038, 0.040
If CRYPTOCAP:BTC corrects to around $120,000, it could drag altcoins lower, giving us a perfect opportunity for a juicy long position.
Always DYOR! 💪 #Crypto #Altcoins #BTC #Trading #TechnicalAnalysis #MarketUpdate #DYOR

SHIB Long Idea - DLRMD Model SHIB Swing Long Opportunity - DLRMD MODEL
📊 Market Sentiment
FED has resumed its rate-cutting cycle, starting with a 0.25% cut in September, with two more expected. Institutional liquidity inflows have accelerated as the U.S. officially adopts crypto as part of its reserves. Despite elevated inflation, a weakening labor market is forcing the FED to ease, pushing more capital into risk-on assets.
📈 Technical Analysis
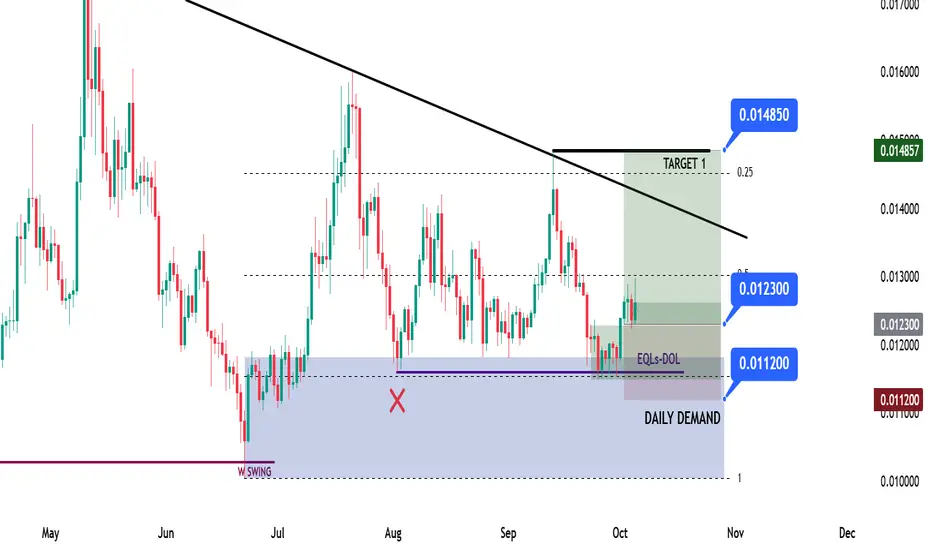
Price is in a higher time frame (HTF) bullish trend, so I’ll only be looking for longs.
Price swept the weekly swing liquidity, closed above, and broke the daily structure — forming a strong daily demand zone. The first tap to this zone generated a solid bullish reaction, confirming its validity.
Currently, price is rejecting from a bearish trendline after running previous liquidity. I assume price now has enough momentum to test and potentially break that trendline for the next leg higher.
📘 Model to be used – HTF Demand w/ Liquidity Run & Max Discount Zone (DLRMD Model)
1-Identify HTF trend direction and only trade in that direction.
2-Locate the HTF demand zone where price can find support and bounce.
3-Wait for LTF liquidity sweep to confirm energy for a reversal.
4- Use Fibonacci retracement to define the max discount zone (around 0.75 retracement).
5- Enter once price shows rejection or bounce confirmation.
📌 Game Plan
Entry already taken at $0.0123 from the retest of the daily demand + discount zone confluence.
I will hold the position until the bearish trendline and monitor for a breakout.
First target is the bearish trendline; once reached, stoploss will move to breakeven, and the rest will be managed toward the next liquidity level.
🎯 Setup Trigger
Setup is active now.
📋 Trade Management
Entry: $0.0123
Stoploss: $0.0112
Targets: TP1 = Bearish trendline | TP2 = $0.01485
💬 Like, follow, and comment if this breakdown supports your trading! More setups and insights coming soon stay connected!
⚠️ Disclaimer: This content is for informational and educational purposes only and does not constitute financial, investment, or trading advice. Always DYOR before making any financial decisions.
FARTCOIN Update📊 FARTCOIN Update
FARTCOIN is currently retracing 🔄
If the price keeps dropping and reaches the green support zone, it could offer a potential long entry — but only with confirmation 💚
✅ Trade smart, not blind.

AVL - Avalon Labs IS READY FOR A HUGE BREAKOUT UP $0,50 (DCA)We are following this coin closely and will continue to do so until it reaches our main target of $0.50+.
Based on the DCA (Dollar Cost Averaging) strategy, the ongoing burn program, and the current technical analysis (TA), this coin shows strong potential.
Depending on the upcoming data, we expect the next bullish move (the next “B” increase) to trigger a breakout into a new uptrend.

NOTUSDTI waiting for breakout of trendline for buy. So is 0.001650 key-levels and 0.001800$ next level for breakout and buy.
Please control risk management because BINANCE:NOTUSDT
IN is meme_coin in crypto.

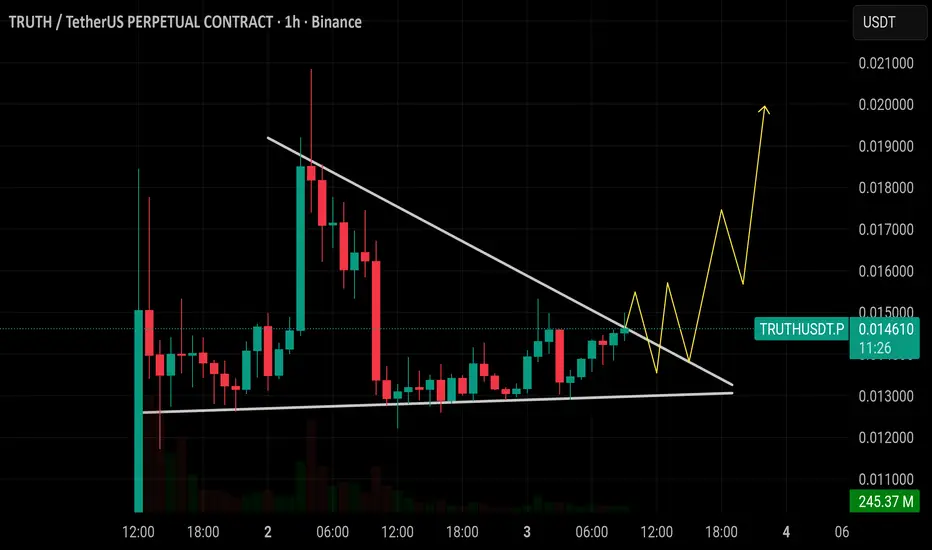
$TRUTH is breaking out from a falling wedge pattern around 0.014$TRUTH is breaking out from a falling wedge pattern around 0.0147. If momentum holds, price can push toward 0.0160 first and then extend toward 0.0200. Losing 0.0130 support would invalidate this bullish setup.
Speculative **Trade setup** GIGACHADGIGA is a meme token deployed on the Solana blockchain intended to honor the legend Ernest Khalimov the original “Gigachad”, by utilizing the strength of memes and “Chad” energy.
GIGA is a community run project.
On the Daily there is a possible Double bottom forming
Taking this #Meme coin back over 2 cents.
Probably catching a bid from the strong performance shown by #SPX6900
Part of #Murad's meme index.

SHIBUSDTBINANCE:SHIBUSDT is now in first reaction to uptrend. I wait for pullback to breakout.
Please control risk management.⚠️

$PEPE weekly outookPEPE is showing strong momentum as it eyes the $0.0001 level, a key psychological resistance. This setup feels like history repeating itself - similar to the explosive rallies we’ve seen before. If momentum sustains, we could be looking at a potential 1000%+ move from current levels.
Key Points:
- Strong weekly structure building higher lows.
- Psychological target: $0.0001 as the next milestone.
- High-risk/high-reward — volatility remains extreme, manage positions carefully.
PEPE continues to prove that meme coins aren’t just hype - they can repeat history with massive upside moves. Traders should watch for breakout confirmations and volume surges before chasing.

Memecoin DailyView | The Web3 Power of Memeland💀 Hey , how's it going ? Come over here — Satoshi got something for you !
⏰ We’re analyzing Meme on the 1-Day timeframe .
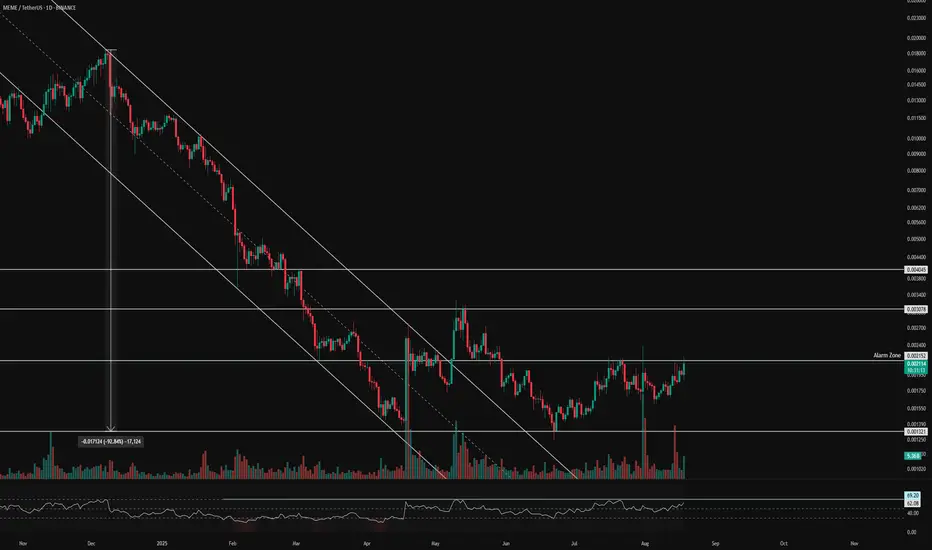
👀 On the daily timeframe of Memecoin, we can see that after a deep 93% correction, MEME broke out of its descending channel. It then faced another pullback on lower timeframes. A very strong bottom was formed around 0.001321, and from this level, with increasing volume and trades, MEME moved upward towards the resistance at 0.002152. Currently, it is trying to break this resistance, which has previously acted as the top of the box and caused rejections .
⚙️ The key RSI level is at 69.20–70. If this level is broken, increased buying momentum could push MEME into the Overbought zone, attracting more buyers .
🕯 Today, the number of long trades has increased, and the size of today’s daily candle looks strong so far. With more buying volume, MEME could break this resistance and aim for higher price levels .
💡 This coin was created by the 9GAG team, who are active in the memecoin sector. The project is a new form of internet money inspired by meme culture. It currently ranks #337 on CoinMarketCap. The project is fully decentralized and operates as a DAO, where NFT holders take part in governance and decision-making .
🔔 The Alert zone is at 0.002152. If this level breaks and confirms, it could provide a good entry for long trades. The short position alert zone is below the daily bottom, but personally, I would avoid shorting this coin .
❤️ Disclaimer : This analysis is purely based on my personal opinion and I only trade if the stated triggers are activated .
PORT3/USDT UPDATE ✅PORT3/USDT Update
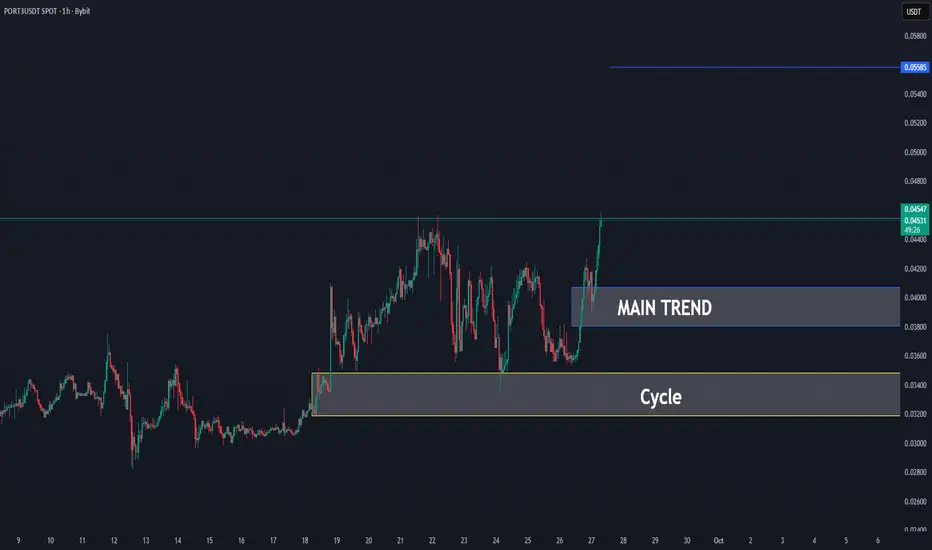
The coin has activated its cycle after holding and bouncing strongly from the cycle zone (~0.032 – 0.034).
It has now also cleared the main trend zone (~0.038 – 0.040), confirming momentum shift.
Key levels:
Cycle base: 0.032 – 0.034 → must-hold area for long-term bullish cycle.
Main trend breakout: 0.038 – 0.040 → successfully reclaimed, now acting as support.
Next resistance/target: 0.053 – 0.055 → upside level to watch if momentum continues.
Upside scenario:
With the cycle activated and the main trend reclaimed, price has room to expand toward 0.053 – 0.055 in the coming sessions.
Downside risk:
Losing 0.038 – 0.040 again would weaken the breakout and increase risk of retest toward the cycle base (0.032).
📌 Summary
Cycle activation confirmed above 0.032.
Main trend breakout confirmed above 0.040.
Target: 0.053 – 0.055 if momentum continues.
Support: 0.038 (main trend) & 0.032 (cycle).
SHIB Swing Long Idea - MemecoinSHIB Swing Long Idea
📊 Market Sentiment
Market sentiment remains strongly bullish as the FED is expected to deliver a 0.25% rate cut, with speculation building for a possible 0.5% cut in September. Monetary policy shifts are being driven by both inflation trends and weakening labor market data. The latest August and September job reports were soft, signaling that the economy is cooling rapidly. This environment continues to fuel expectations for a major bullish run in the weeks ahead.
📈 Technical Analysis
Price ran the HTF liquidity and got rejection from there.
Price created the Daily Demand after the run which confirms the price wants to seek higher liquidity.
Price made its first retest to Daily Demand and got rejection there, indicating that Daily Demand is valid and likely to send price higher.
Price is also supported by the Weekly Demand zone.
📌 Game Plan
1. Price to come back and retest the Weekly Demand zone at 0.0125$
2. Price to come back and retest the Daily Demand zone at 0.0117$
3. Price to run Equal Lows (purple line – 0.0117$) and close back above
4. Price to hit the 0.75 most discounted range level
🎯 Setup Trigger
I will be looking for a 4H break of structure before entering any position.
📋 Trade Management
Stoploss: Below the 4H swing low responsible for BOS
Targets:
• TP1: 0.0149$
• TP2: 0.016$
• TP3: 0.0175$
💬 Like, follow, and comment if you find this setup valuable!
⚠️ Disclaimer: This content is for informational and educational purposes only and does not constitute financial, investment, or trading advice. Always do your own research before making any financial decisions.

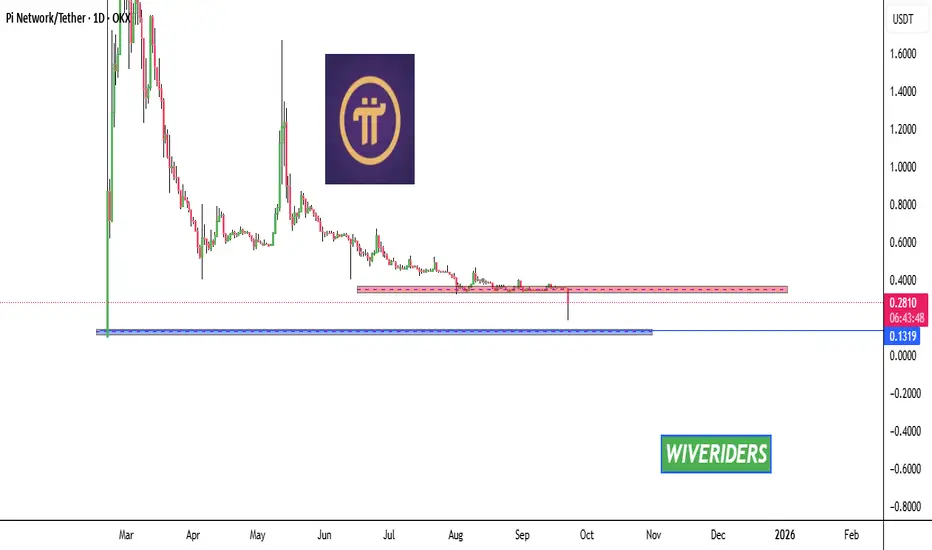
PI Market Update📊 PI Market Update
PI has moved strongly down, and there are two key levels to watch:
🔹 Support Zone – If the price keeps retracing into this level, it could potentially bounce up, as buyers previously accumulated here.
🔹 Red Resistance Zone – Still strong with sellers. If PI moves back here, it could face rejection and push down again.
⚠️ At the moment, there is no clear sign of stabilization. Entering now carries high risk of losses. Be smart and patient.
✅ If the red resistance zone breaks out with confirmation, it could signal the trend turning bullish again.
CAT - ASCENDING TRIANGLE BREAKOUT#1000CAT - Bullish breakout daily ✅🚀
As expected few days ago, price is tanking!
📈Ascending triangle breakout
📈Double bottom daily
📈Bullish trend ichimoku
Market looks also good to see a 10 - 15% bull move on #CAT !
#altcoins #1000cat #MEME

Pump doubles from here before year endWith a billion $ in annualized revenue, pumpfun in following in the footsteps of hyperliquid as crypto's second killer app with a massive buyback flywheel. As long as daily revenue does not drop off, this narrative should pick up steam over the next few months. If the team executes it will be crypto's first successful social app into the mainsteam, succeeded where so many projects before failed.
