$UFD: 100x Extremum Breakout SetupCHART ANALYSIS
Two fake-outs cleared. Year-long base complete. Bottom confirmed. Breakout imminent.
📊 KEY LEVELS:
Current: $0.014516
Resistance: $0.041121 (+183%)
Extremum Target: 100x zone
📈 PATTERN:
12-month accumulation base ✓
May + July fake-outs shook weak hands ✓
February 2025 bottom confirmed with BUY signal ✓
Clean resistance at 0.041121 ready to test
Historic breakout window: March-May 2025
THE FUNDAMENTAL EDGE
365 consecutive days of building. Zero days missed.
While 95% of crypto projects die within 6 months, UFD's developer has shown up EVERY. SINGLE. DAY. for an entire year to build and engage the community.
This isn't normal. This is top 1% commitment that creates:
Unshakeable community loyalty
Zero rug risk
Compounding product development
Cult-like holder conviction
WHY THIS COULD PARABOLIC
Technical + Fundamental Convergence:
When you get a developer building daily for 365 days AND a textbook accumulation pattern completing, you're not looking at a trade. You're looking at a generational setup.
🎯 The Math:
Entry: $0.014516 (NOW)
Target 1: $0.041121 = 183% gain
Target 2: 100x zone = 6,900% gain
Risk/Reward: 1:100+
🔥 The Narrative:
Once CT discovers "the dev that never missed a day for a year" + "the chart that bottomed perfectly," FOMO goes nuclear.
TIMELINE
Now - March 2026: Final accumulation, resistance test
March - May 2026: Breakout window opens
May - July 2026: Extremum 100x zone activation
THE SETUP
✓ 12-month base complete
✓ Weak hands eliminated via 2 fake-outs
✓ Bottom confirmed with technical signal
✓ 365 days proven developer commitment
✓ Battle-tested community
✓ Asymmetric risk/reward (1:100+)
⏳ Breakout pending
This is what accumulation looks like before the parabolic move.
The question isn't IF—it's are you positioned WHEN.
DYOR. Not financial advice. Chart patterns + fundamentals suggest rare alignment. Position accordingly.
Memecoin

MUBARAK/USDT at a Critical Trendline – Breakout or Rejection?On the 2D timeframe, MUBARAK/USDT remains in a medium to long-term downtrend. Since its previous peak, price action has consistently formed lower highs and lower lows, confirming sustained selling pressure.
Currently, price is attempting a recovery and is now approaching the main descending trendline, making this area a critical decision zone for the next major move.
---
Pattern & Structure Explanation
1. Descending Trendline (Major Dynamic Resistance)
The yellow trendline represents a key dynamic resistance that has rejected price multiple times in the past.
As long as price stays below this trendline, the overall structure remains bearish.
2. Bearish Continuation Structure
After the strong breakdown in October, price entered a weak recovery and consolidation phase.
The current upward move is still considered a pullback unless a confirmed breakout occurs.
3. Horizontal Key Levels
0.02660 USDT: Important horizontal resistance and previous reaction zone.
0.02320 USDT: Short-term equilibrium / minor resistance currently being tested.
0.02100 – 0.02000 USDT: Nearest support zone.
0.03800 USDT: Next major resistance if a bullish breakout happens.
---
Key Levels
Dynamic Resistance: Descending trendline
Horizontal Resistance:
0.02660 USDT
0.03800 USDT
Main Support:
0.02100 – 0.02000 USDT
0.01700 USDT (next downside support)
---
Bullish Scenario
The bullish scenario is only valid if price breaks and closes clearly above the descending trendline.
Bullish confirmation:
Strong 2D candle close above the trendline
Price holds above 0.02660 USDT
Potential upside targets:
TP 1: 0.02660 USDT
TP 2: 0.03200 USDT
TP 3: 0.03800 USDT
A breakout supported by increasing volume would signal a trend reversal from bearish to bullish.
---
Bearish Scenario
The bearish scenario remains dominant if price gets rejected at the descending trendline.
Bearish confirmation:
Clear rejection or long upper wicks near the trendline
Failure to close above 0.02660 USDT
Downside targets:
Support 1: 0.02100 – 0.02000 USDT
Support 2: 0.01700 USDT
Rejection at this level would confirm that the current rise is only a dead cat bounce or pullback within a broader downtrend.
---
Conclusion
MUBARAK/USDT is currently trading at a critical decision zone.
Trendline breakout → potential bullish reversal
Trendline rejection → continuation of the downtrend
Traders should wait for clear confirmation before entering large positions, as this area carries a high risk of false breakouts.
---
#mubarak #mubarakusdt #cryptotrading #technicalanalysis #downtrend #trendline #altcoinanalysis #binance #priceaction #supportresistance

MOST IMPORTANT LEVELS TO WATCH!!This is by far the biggest memecoin launch since #PEPE & #BRETT. Those were the two biggest most recent pumping memcoins.
I believe with the influence and the credibility #TheWhiteWhale has on CryptoTwitter, this will grown to be a 1 billion dollar marketcap project over the next few wekks or months.
Until it gets there we mark the key levels and enter the best trade set-ups.
Calculate Your Risk/Reward so you don't lose more than 1% of your account per trade.
Every day the charts provide new information. You have to adjust or get REKT.
Love it or hate it, hit that thumbs up and share your thoughts below!
This is not financial advice. This is for educational purposes only.

MEW Main Trend. Memcoin. 2025 07 02Logarithm. Time frame 3 days.
Cat in a dogs world (MEW)
X -133 thousand subscribers (this is not enough).
Reduction from the maximum -87%. For such assets, this is not enough.
I imposed a descending channel on the chart (current descending trend of the main trend), and a horizontal one, if by some miracle this local Ross hook is broken upwards (not forming a local head and shoulders), not only to the resistance of the secondary trend (red line), but to break through it. Percentages to key zones of support/resistance levels are shown for clarity.
After the downward trend is broken, such "psychological-fundamental" assets are usually pumped up by +800-1000% from the minimums or more. Low liquidity, and the contingent of people who subscribe to these projects, allows this to be done easily at the right time: "the hamster is not scared". After pumping — a slow death, with pumps an order of magnitude smaller. Therefore, do not forget to sell in the alt season.
When working with such cryptocurrencies by liquidity, observe money management, use partial entry or on a breakout. Do not use margin leverage, as there may be snot in any direction for a large percentage, which will lead to liquidation "out of the blue".

50 DAY $BTC WHALE FARM IN PROGRESS 50 Day Whale Farm, Community Challenge in Progress.
- Since the 30% decline from the October 2025 Bulltrap (See Sunday Oct 12th to Sunday October 26 Closers for reference)
BTCUSD has been in a 50 day whale farm with an average catch floor of 85k with a low of 81,600k.
This has been an endurance test by whales to see if the community can push past resistance without assistance from traditional finance. IMO I don't see many of them cashing out their gains to turn around and chase this market. This is a War between the 7% majority and it's OG Whales. I would rather have the floor break and continue a full -70% reduction from the top than let Corporations and Monopolies like MicroStrategy control the market with their Moby Dick Whale Size Bags this early in BTCUSD life cycle.
#NFA
CRYPTO:BTCUSD BITSTAMP:BTCUSD BINANCE:BTCUSDT COINBASE:BTCUSD

$BTC 2026 Wide Divergence Prediction 2026CRYPTO:BTCUSD
This prediction is simple, and based on the only Wide Divergence visible on the Weekly Candle chart through out the life span of CRYPTOCAP:BTC , which occurred roughly from June 2022 to December 2022 for an estimate of 203 days and is directly responsible for the price action that followed over the next 2.7 years.
- I believe that every crypto moves at its own individual rate depending on age, mcap, token circulation, holder count, ect... and that Bitcoin is the slowest moving of all.
- It is also my belief the 3x Meme Coin Pump is not only a naturally occurring phenomenon in Memes, But also Bitcoin. And we have just watched it unfold in real time over the last 2.7 years and are are in the -70% reversal from top right now.
3x Pump Date Range
- Start Date : 11/20/22 CRYPTOCAP:BTC @ 16k
- 1x Date : 3/10/24 CRYPTOCAP:BTC @ 70k
- 2x Date : 1/0/25 CRYPTOCAP:BTC @ 105k
- 3x Date : 11/5/25 CRYPTOCAP:BTC @ 125k
Start to 1x = 468 days / 1x - 2x Pump = 293 Days / 2x to 3x Pump = 249 Days
- For the last 50 days we have been tested in a whale farm with a 85k bottom and a 94k top, we are currently in the down trend from the third and final swing as the community was not able to break past the 93500k Resistance zone during this time. In the upcoming weeks we will see a sharp decline in price action breaking the 85k and create a new floor at 68k for a shorter period of time before finally completing our decent to roughly 55k.. This final bottom will be the start indicator for the next 200 day (estimated) Wide Divergence Set Up, before resetting the next 3x Pump.
Thank you for time, Hope for feedback!!
Profit > Cost Average
CRYPTO:BTCUSD

BITCOIN PREDICTION / WIDE DIVERGENCE 2026This prediction is simple, and based on the only Wide Divergence visible on the Weekly Candle chart through out the life span of CRYPTOCAP:BTC , which occurred roughly from June 2022 to December 2022 for an estimate of 203 days and is directly responsible for the price action that followed over the next 2.7 years.
- I believe that every crypto moves at its own individual rate depending on age, mcap, token circulation, holder count, ect... and that Bitcoin is the slowest moving of all.
- It is also my belief the 3x Meme Coin Pump is not only a naturally occurring phenomenon in Memes, But also Bitcoin. And we have just watched it unfold in real time over the last 2.7 years and are are in the -70% reversal from top right now.
3x Pump Date Range
- Start Date : 11/20/22 CRYPTOCAP:BTC @ 16k
- 1x Date : 3/10/24 CRYPTOCAP:BTC @ 70k
- 2x Date : 1/0/25 CRYPTOCAP:BTC @ 105k
- 3x Date : 11/5/25 CRYPTOCAP:BTC @ 125k
Start to 1x = 468 days / 1x - 2x Pump = 293 Days / 2x to 3x Pump = 249 Days
- For the last 50 days we have been tested in a whale farm with a 85k bottom and a 94k top, we are currently in the down trend from the third and final swing as the community was not able to break past the 93500k Resistance zone during this time. In the upcoming weeks we will see a sharp decline in price action breaking the current 85k floor and will create a new floor at 68k for a shorter period of time before finally completing our decent to roughly 55k.. This final bottom will be the start indicator for the next 200 day (estimated) Wide Divergence Set Up, before resetting the next 3x Pump.
Thank you for time, Hope for feedback!!
Profit > Cost Average
-MikeyLikesDips707

LIGHT| Pump & Dump Pattern | HIGH RISK WARNINGExecutive Summary
Bitlight (LIGHT) trading at $0.43 within a descending channel on the 4H timeframe. Classic pump and dump pattern: consolidate → pump → dump → repeat. Token crashed 74-80% after team wallets dumped $11M+ on exchanges. Only 10% of supply circulating with 90% locked until 2026 unlocks. Extreme caution advised.
BIAS: BEARISH - Pump & Dump Structure
⚠️ HIGH RISK WARNING ⚠️
Team wallets dumped $11.2M worth of LIGHT pre-crash
80% price crash in 24 hours after insider sell-offs
Only 10% of 420M supply circulating
90% supply locked - massive dilution risk in 2026
Official X account potentially compromised (Jan 4, 2026)
FDV $275M vs Market Cap $27M = 10x dilution risk
Price History - Pump & Dump Cycles
Pump 1: Rally to ~$4.50-$5.00 → Dump
Pump 2: Rally to ~$3.50 → Dump
Pump 3: Rally to ~$1.50 → Dump
Current: ~$0.43 (consolidating before next move)
Pattern: Lower highs, lower lows throughout
Red Flags
5 wallets dumped $8.2M in 24 hours during Jan 1 crash
Team-linked wallets moved 4.64M LIGHT ($11.2M) to exchanges
Thin liquidity amplifies volatility
0.81 turnover ratio = high trader churn
"Controlled dump" accusations from community
Technical Structure - 4H
Descending Channel:
Clear downtrend with lower highs and lower lows
Yellow dashed trendlines defining channel
Each pump rejected at descending resistance
Pattern suggests continuation lower
Key Levels:
Resistance:
$0.80 - $1.00 - Immediate resistance
$1.50 - Previous pump high
Descending trendline resistance
Support:
$0.40 - Current support
$0.00 - Potential target if pattern continues
SCENARIO ANALYSIS
BEARISH (Primary): Continuation Lower
Consolidation at current levels
Possible small pump to trap buyers
Then dump to new lows
Pattern repeats until liquidity dries up
BULLISH (Low Probability):
Break above descending channel
Would require major catalyst
RGB protocol adoption could help long-term
But tokenomics remain problematic
My Assessment
Classic pump and dump structure. Team wallets dumping on retail. 90% supply still locked = massive future dilution. Each rally gets sold into. Descending channel intact. Avoid or trade with extreme caution. Not worth the risk.
Strategy:
AVOID - High risk of further dumps
If trading: Short rallies to descending resistance
Never hold through consolidation phases
Take profits quickly on any pump
This is not financial advice. Be Careful! EXTREME CAUTION ADVISED.

DOGE Short-term analysis | Trading and expectationsCRYPTOCAP:DOGE
🎯 Price printed a bullish engulfing 3 white knight candle pattern. It is above the daily pivot, showing a bullish trend is emerging, but still below the daily 200EMA. Overcoming this will be very bullish. The Elliot wave count is tricky, so I will await more confirmation.
📈 Daily RSI has printed bullish divergence. The RSI shot up too hard and fast, which often results in a reversal, potentially testing the daily pivot as support.
👉 Analysis is invalidated below the swing low, keeping the downtrend alive
Safe trading

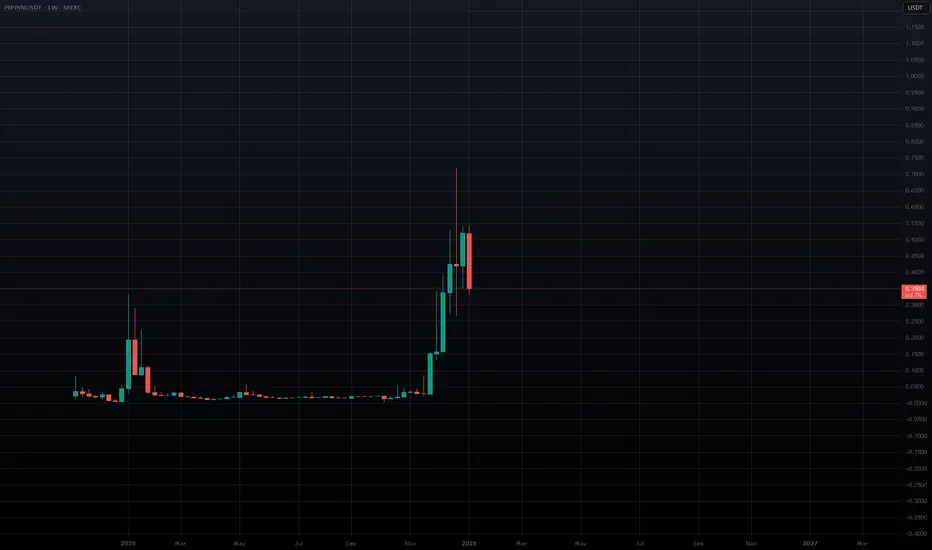
PIPPIN: Great example of institutional level value extraction.Have you seen these tokens which pump 20-50x (sometimes even 100x++) before violently crashing and flat lining for months on end, just to do it again or be abandoned forever?
They are handled by professionals, backed by deep pockets.
We aren't talking small ball, pump/dump groups.
These are institutional level, with some reaching up to $100M+ turnover, billions in market cap.
Handlers pay:
KOLs to shill buyers/long positions before big crashes, to extract value from panic sellers and long liquidations.
KOLs to shill sellers/short positions before big pumps, to extract value from FOMO buyers and short liquidations.
exchanges for listings, market makers for liquidity
Meanwhile they cleverly abuse the pump.fun AMM LP curve mechanics, index pricing and monitoring large perp buyers/sellers to hunt liquidations.
Once the game has run it's course, the token's AMM pool is dumped into, drained and the token goes back to marginal value.
Handlers hold on to large amounts of supply, while walking away with profits.
Reality of the pump.fun AMM bonding curve;
You can not sell more value than later buyers inject.
While early sellers drain real value, late sellers hold unrealizable paper gains.
In normal markets, price reflects belief, liquidity, and risk;
manipulation requires capital
In these pump.fun AMM plays, price reflects how far along the curve you are;
manipulation requires timing, not conviction
Early buyers acquire massive supply at minimal cost, while later buyers must pay exponentially more and affect price more than early buyers.
This is not conviction, price discovery or speculation, it’s mechanical value extraction.
The curve is built for this, it’s doing exactly what it was designed to do;
maximize early upside
compress price discovery
transfer value from late participants to early ones
PIPPIN is an interesting project, with a great mind behind it.
The problem is that pump.fun tokens like this are abused and exploited so hard, leaving an immense amount of dead money/bag holders.
It is uncertain to me if even a single one of these tokens will be able to carry value into the long-term.
PUMP/USDT: Memecoin at Critical Resistance – Doji Pattern Signal🚀 PUMP-USDT is back in the spotlight — and it’s hitting something big:
✅ 5-MONTH RESISTANCE (since Sept 2025)
✅ DOJI Pattern forming at key resistance level — a true battleground of sentiment
✅ The overall trend is falling since beginning
📊 What’s a DOJI?
A Doji is that neutral, indecisive moment on the chart where bulls and bears are locked in a stalemate.
- No clear momentum.
- Sentiment is split — bullish hopes vs bearish caution.
- The market is “thinking”… waiting for a trigger.
💥 This is EXACTLY what we see now:
A Memecoin with wild energy
Trapped at its strongest resistance since launch
And now, a Doji / Spinning Top forming right at the top
⚠️ That’s not a signal to go long. That’s a warning sign.
When a memecoin hits multi-month resistance and forms a DOJI?
→ Bull retracement is exhausted.
→ Bear pressure is building.
🎯 Our call: SHORT PUMP-USDT
Wait for confirmation — a rejection candle or volume spike down — then enter.
This isn’t FOMO. It’s smart timing.
💬 What’s your take?
Are you riding the wave… or preparing for the drop?
👇 Drop your view below — let’s see who’s thinking ahead!

Pepe: Where can I buy a frog?The asset showed strong momentum growth, so it is safe to buy in the areas indicated on the chart.
The most important thing is to look at the LTF before entering. If there is a long model, enter. Otherwise, skip it and wait for a lower price.
OKX:PEPEUSDT.P

BANANA GUN – Daily UpdateFrom the weekly perspective, price is still in a broader bearish structure.
The recent move is only a reaction after a prolonged downtrend — not a confirmed reversal yet.
On the Daily, price has broken the descending trendline, which is a first sign of potential change.
However, at this stage there is still no valid long trigger.
What I want to see next:
Price needs to print a higher high and then come back for a proper resistance → support flip.
Only after that reclaim would the structure shift be confirmed.
Until that happens, this remains a wait-and-see scenario.
No confirmation = no trade.
Patience first.
Let price prove itself before committing risk.
Are you waiting for the reclaim or already anticipating the move?
MrC

#MEME/USDT is Bullish#MEME
The price is moving in a descending channel on the 1-hour timeframe. It has reached the lower boundary and is heading towards breaking above it, with a retest of the upper boundary expected.
We have a downtrend on the RSI indicator, which has reached near the lower boundary, and an upward rebound is expected.
There is a key support zone in green at 0.001144. The price has bounced from this zone multiple times and is expected to bounce again.
We have a trend towards consolidation above the 100-period moving average, as we are moving close to it, which supports the upward movement.
Entry price: 0.001172
First target: 0.001194
Second target: 0.001229
Third target: 0.001271
Don't forget a simple point: money management.
Place your stop-loss below the support zone in green.
For any questions, please leave a comment.
Thank you.

MOGUSD — ULTRA BULLISH SETUP | Next Leg Up to 5x–10x from Here? Current Price (approx. Jan 4–5, 2026): ~$0.00000033 (recent +20% daily pump spotted, market cap pushing ~$130M+)Timeframe: Daily / 4H
Bias: Very Bullish — Accumulation phase ending, momentum flipping hardKey Technical Reasons for Bull Case: Channel Breakout Confirmed
MOG has finally broken out of the long descending channel that trapped it post-2024/2025 highs. Price flipped old resistance → support perfectly on retest. Holding above the 50 EMA like a boss.
Bull Flag / Cup & Handle Continuation
Classic meme coin pattern forming — we printed a massive bull flag after the accumulation zone. Breakout already happened on high volume. Retest of breakout zone respected (Golden Pocket Fib 0.5–0.618). This screams continuation to the upside.
Momentum Indicators Screaming Green RSI bouncing from oversold, now curling up (no bearish divergence)
MACD bullish crossover + histogram expanding
EMA 9/26 golden cross still intact
→ All pointing to acceleration phase (Wave 3 in Elliott speak if you're into that)
Macro Tailwinds
Bitcoin is likely gearing up for another leg (many calling $150k+ in 2026). Meme sector always 3–10× betas BTC moves. MOG is top-tier cat/meme culture play — strong community, viral potential, already survived multiple cycles.
Bullish Price Targets (measured move + Fib extensions): Short-term (next 2–6 weeks): $0.00000055 – $0.00000075 (first 2× pump, reclaim previous range highs)
Mid-term (Q1–Q2 2026): $0.0000010 – $0.0000015 (psychological 3–5× from here, new ATH zone)
Moon case (full send 2026 bull run): $0.000003 – $0.000005+ (10×+, market cap 1B+ territory if meme mania returns)

MUBARAKUSDT | Potential ReversalHello traders,
I'm seeing early bullish signs on MUBARAK's chart. Internal downtrend break + hidden bullish divergence on OBV
Entry, SL, TP marked on chart.
Good Luck

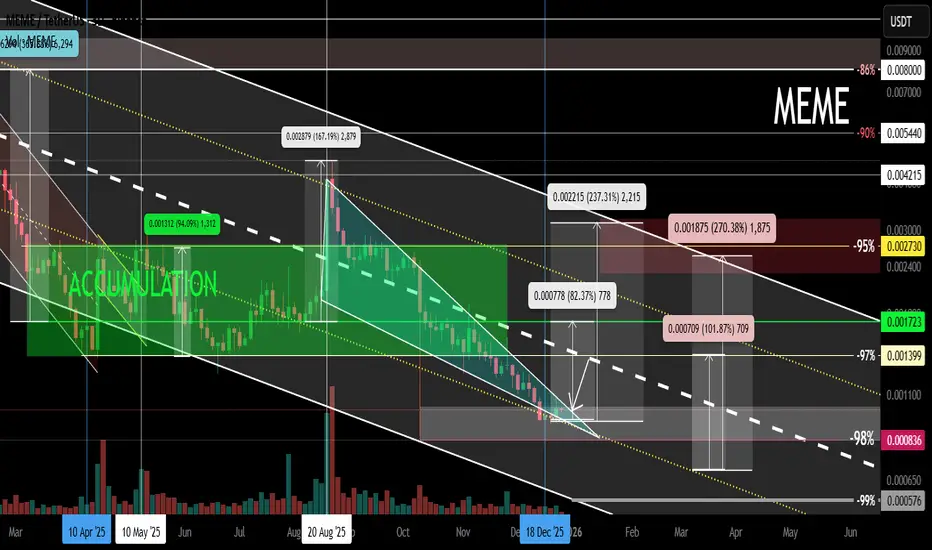
MEME Local Trend. Wedge. Reversal Zone. December 27, 2025Logarithm. 3-day timeframe.
The main trend is shown for clarity (dynamic support zone of the internal descending channel).
-98% decline from the high
The price is near the long squeeze zone, 10 10 2025. A descending wedge has formed, and the price is being squeezed. This is the local trend reversal zone if its resistance is broken, which can occur through sideways consolidation, i.e., a double bottom or dragon...
DOGE - Descending Channel at $0.127
Executive Summary
COINBASE:DOGEUSD is trading at approximately $0.127 on Christmas Day, down 58% YTD and trapped in a descending channel on the 4H timeframe. The performance metrics are brutal: -60.92% over the past year. However, multiple analysts are pointing to a cycle fractal that suggests DOGE may be in the "golden pocket" for accumulation before a major bull run. The key level to watch is $0.138 - a reclaim above this Fibonacci level could signal the start of a significant rally. Meanwhile, futures trading volume has surged 53,000% to $260 million, and spot DOGE ETFs are boosting demand.
BIAS: NEUTRAL - Bullish Potential with Current Bearish Structure
The chart structure is bearish (descending channel), but the cycle fractal and accumulation signals suggest this could be the calm before the storm. Wait for confirmation above $0.138 before turning bullish.
Current Market Context - December 25, 2025
Dogecoin is at a critical juncture:
Current Price: $0.127 (-1.22% in 24h)
Market Cap: $19.39 billion
52-Week Range (Market Cap): $15.59B - $64.11B
Volume: 590.15M (below 30D average of 1.13B)
Open Interest: $1.51 billion (11.8 billion DOGE)
Rank: #9 by market cap
Performance Metrics - MOSTLY RED:
1 Week: +0.83% (Green)
1 Month: -15.91% (Red)
3 Months: -42.45% (Red)
6 Months: -19.67% (Red)
YTD: -58.30% (Red)
1 Year: -60.92% (Red)
The numbers are ugly. DOGE has lost nearly 60% of its value this year. But is this the bottom?
THE BULL CASE - Cycle Fractal Points to Imminent Rally
The Dogecoin Cycle Fractal
Crypto analyst Cryptollica has identified a cycle fractal that shows DOGE may be at the point before it begins its bull run. The fractal has repeated itself at the macro level with four distinct structural points:
Zone 1 & 2: "Boredom phases" where volatility died and smart money accumulated
Zone 2: Was the launchpad for the massive 2021 parabolic run
Zone 4 (CURRENT): Same rounding-bottom formation playing out
Price is stabilizing and forming a heavy base just like before previous explosions
Key Insight: The analyst states this is the "Golden Pocket" for accumulation. If the fractal plays out as it did in 2020 (Zone 2), the current price action is simply the calm before the storm.
RSI at Historical Support
Weekly RSI at 32 level - acts as historical floor
DOGE has formed a macro bottom every time RSI touched this baseline
RSI has reset to this critical support level
Indicates sellers are exhausted
Momentum is primed to flip
The $0.138 Level - Key to Recovery
Analyst Kevin has identified $0.138 as THE critical level:
Must be reclaimed on 3-day to weekly timeframe closes
Would place DOGE back above macro 0.382 Fibonacci retracement
This Fib level divides bearish and bullish market phases
Also aligns with 200-week Simple Moving Average
A move above would signal long-term buyers regaining control
Next major target after reclaim: $0.46 (liquidity/resistance zone)
Futures Volume Surge - 53,000%
Dogecoin futures trading volume surged 53,000% to $260 million
Driven by Dogecoin ETF activity and derivatives
This surge came before recent price stability
Could be catalyst for upcoming trend reversal
Spot DOGE ETFs launched in late 2025, boosting demand
Analyst Price Targets
Cryptollica: DOGE could rally significantly and possibly exceed $1
Kevin: Next major resistance at $0.46 after $0.138 reclaim
Current resistance targets: $0.148 and $0.196
Support expected in $0.11 range
THE BEAR CASE - Descending Channel Still Intact
Current Technical Structure
The 4H chart shows a clear descending channel:
Lower highs and lower lows dominating
Price trapped between declining trendlines
Channel resistance capping rallies
Channel support providing temporary bounces
No confirmed breakout yet
Bearish structure until proven otherwise
Concerning Metrics
YTD: -58.30% - Massive underperformance
1 Year: -60.92% - Lost more than half its value
Market cap down from $64.11B high to $19.39B
Volume below 30-day average (590M vs 1.13B)
Open interest dropped 4.03% in last 24 hours
Lost crucial $0.13 support level
Market Headwinds
Broader crypto market in risk-off mode
Total crypto market fell below $3 trillion to $2.94 trillion
Fed rate expectations pushing out (rates on hold until April)
Holiday trading with thin liquidity
DOGE utility discussions (sidechains, L2) progressing slowly
Technical Structure Analysis
Price Action Overview - 4 Hour Timeframe
The chart shows a descending channel pattern:
Descending Channel Characteristics:
Upper trendline: Connecting lower highs (resistance)
Lower trendline: Connecting lower lows (support)
Channel slope: Bearish (declining)
Price oscillating between boundaries
Current position: Mid-to-lower channel
Recent Price Action:
Dec 19 surge to $0.134 high
Failed to break channel resistance
Pulled back to current $0.127 level
Now trading in tight range ($0.126-$0.135)
Consolidation setting stage for next move
Key Support and Resistance Levels
Resistance Levels:
$0.134-$0.135 - Immediate resistance / recent high
$0.138 - CRITICAL LEVEL (Fibonacci 0.382 + 200-week SMA)
$0.148 - Next resistance target
$0.196 - Secondary resistance
$0.46 - Major liquidity zone (if $0.138 reclaimed)
$1.00 - Analyst moon target
Support Levels:
$0.126 - Immediate support / range bottom
$0.125 - Key support (must hold for bullish setup)
$0.12 - Psychological support
$0.11 - Major support zone
$0.10 - Deep support / psychological
Range Analysis
Current consolidation range:
Range high: $0.135
Range low: $0.126
Range width: ~$0.009 (7%)
Breakout direction will determine next major move
Above $0.138 = Bullish confirmation
Below $0.12 = Bearish continuation
Moving Average Analysis
Price below major moving averages
200-week SMA at ~$0.138 area - key resistance
MAs sloping downward on shorter timeframes
Need to reclaim MAs for trend reversal
Currently bearish MA structure
RSI Analysis
4H RSI at 42 - showing growing buyer interest
Weekly RSI near 32 - historical support level
RSI breakthrough would boost momentum
Target resistance at $0.134 if RSI breaks higher
Oversold conditions on higher timeframes
Bitcoin Correlation - Key Catalyst
Analyst Kevin notes that DOGE's recovery is tied to Bitcoin:
Bitcoin needs to reclaim $88,000-$91,000 range
This would require BTC to rally 2-6% from current levels
BTC strength would support bullish momentum across crypto
Without BTC confirmation, DOGE may continue consolidating
Watch BTC as leading indicator for DOGE direction
SCENARIO ANALYSIS
BULLISH SCENARIO - Breakout Above $0.138
Trigger Conditions:
3-day or weekly close above $0.138
Bitcoin reclaims $88,000-$91,000
RSI breaks above 50 on weekly
Volume surge on breakout
Descending channel breakout confirmed
Price Targets if Bullish:
Target 1: $0.148 - First resistance
Target 2: $0.196 - Secondary resistance
Target 3: $0.46 - Major liquidity zone
Moon Target: $1.00+ (cycle fractal projection)
Bullish Catalysts:
Cycle fractal pointing to bull run
RSI at historical support (32 level)
"Golden Pocket" accumulation zone
Futures volume surge (53,000%)
Spot DOGE ETFs boosting demand
Smart money accumulation phase
Rounding bottom formation
BEARISH SCENARIO - Breakdown Below $0.12
Trigger Conditions:
4H close below $0.12
Bitcoin weakness below $85,000
Volume spike on breakdown
Descending channel continues
Open interest continues declining
Price Targets if Bearish:
Target 1: $0.11 - Major support zone
Target 2: $0.10 - Psychological support
Target 3: $0.08-$0.09 - Extended downside
Bearish Risks:
Descending channel still intact
YTD: -58.30% - Severe underperformance
Lost $0.13 crucial support
Volume below average
Open interest declining
Broader crypto market weakness
Fed rate expectations pushed out
Utility development slow
NEUTRAL SCENARIO - Continued Range Trading
Most likely short-term outcome:
Price continues in $0.126-$0.135 range
Consolidation before next major move
Wait for Bitcoin direction
Wait for $0.138 reclaim or $0.12 breakdown
Holiday trading keeps volatility low
MY ASSESSMENT - NEUTRAL with Bullish Potential
This is a genuinely mixed setup:
Bearish Factors (Current Reality):
Descending channel intact
YTD: -58.30%, 1Y: -60.92%
Below all major moving averages
Lost $0.13 support
Volume declining
Open interest dropping
Bullish Factors (Future Potential):
Cycle fractal pointing to bull run
RSI at historical support
"Golden Pocket" accumulation zone
Futures volume surge 53,000%
Spot ETFs boosting demand
Analysts targeting $0.46 to $1.00+
Rounding bottom forming
My Stance: NEUTRAL - Wait for Confirmation
The current structure is bearish, but the accumulation signals are compelling. This is NOT the time to short, but also not the time to go heavy long without confirmation.
Strategy:
Wait for $0.138 reclaim for bullish confirmation
Or wait for $0.12 breakdown for bearish confirmation
Small accumulation positions acceptable in $0.125-$0.127 zone
Don't chase - let the market show its hand
Watch Bitcoin for direction
Trade Framework
Scenario 1: Bullish Breakout Trade
Entry Conditions:
3-day or weekly close above $0.138
Volume confirmation
Bitcoin above $88,000
Trade Parameters:
Entry: $0.138-$0.142 on confirmed breakout
Stop Loss: $0.125 below recent support
Target 1: $0.148 (Risk-Reward ~1:0.5)
Target 2: $0.196 (Risk-Reward ~1:4)
Target 3: $0.46 (Extended)
Scenario 2: Accumulation in Range
Entry Conditions:
Price tests $0.125-$0.127 support
Bullish rejection candle
RSI holding above 30
Trade Parameters:
Entry: $0.125-$0.127 at range support
Stop Loss: $0.118 below $0.12 psychological
Target 1: $0.134-$0.135 (range high)
Target 2: $0.138 (key Fibonacci level)
Target 3: $0.148+ (if breakout occurs)
Risk-Reward: ~1:1.5 to first target
Scenario 3: Bearish Breakdown Trade
Entry Conditions:
4H close below $0.12
Volume confirmation
Bitcoin weakness
Trade Parameters:
Entry: $0.118-$0.12 on confirmed breakdown
Stop Loss: $0.128 above recent consolidation
Target 1: $0.11 (Risk-Reward ~1:1)
Target 2: $0.10 (Risk-Reward ~1:2)
Target 3: $0.08-$0.09 (Extended)
Risk Management Guidelines
Position sizing: 1-2% max risk per trade
DOGE is highly volatile - use appropriate size
Wait for confirmation before large positions
Respect the descending channel until broken
Watch Bitcoin correlation closely
Holiday trading = thin liquidity
Scale into positions rather than all-in
Take profits at targets
Invalidation Levels
Bullish thesis invalidated if:
Price closes below $0.11
Descending channel breaks down further
Bitcoin crashes below $80,000
Weekly RSI breaks below 25
Bearish thesis invalidated if:
Price closes above $0.138 on weekly
Descending channel breaks to upside
Bitcoin reclaims $91,000
Volume surge on breakout
Conclusion
COINBASE:DOGEUSD is at a critical inflection point. The current structure is bearish with a descending channel and -58% YTD performance. However, multiple analysts are pointing to a cycle fractal that suggests this could be the "golden pocket" for accumulation before a major bull run.
The Numbers:
Current Price: $0.127
YTD Performance: -58.30%
1-Year Performance: -60.92%
Market Cap: $19.39 billion
Key Level: $0.138 (Fibonacci 0.382 + 200-week SMA)
Key Levels:
$0.138 - CRITICAL (reclaim = bullish confirmation)
$0.134-$0.135 - Immediate resistance
$0.127 - Current price
$0.125-$0.126 - Immediate support
$0.12 - Psychological support (breakdown level)
$0.11 - Major support
The Setup:
Dogecoin is consolidating in a descending channel with the cycle fractal suggesting accumulation. The $0.138 level is THE key - a reclaim would signal the start of a potential rally to $0.46 and beyond. Without that confirmation, the bearish structure remains intact.
Strategy:
NEUTRAL stance - wait for confirmation
Small accumulation acceptable at $0.125-$0.127
Bullish above $0.138 (targets $0.148, $0.196, $0.46)
Bearish below $0.12 (targets $0.11, $0.10)
Watch Bitcoin for direction
As analyst Cryptollica says: "Ignore Dogecoin now, chase it later." The spring is loading - patience is required.

M Sell/Short Setup (4H)Considering the filling of the MUSDT price gap and the reaction to the originating order block, along with the formation of an FVG at the lower part of the chart, we can look for sell/short opportunities.
Targets and stop loss are marked on the chart.
At the first target, secure partial profits and move the stop loss to breakeven.
Do not enter the position without capital management and stop setting
Comment if you have any questions
thank you

Pepe Gann Fann Bottom LevelDoing a quick up and down gann on Pepe shows us the best possible entry:
0.033 to 0.034 as a possible bottom not he weekly.
The move would then takes us to 1/1 of the red downward facing gann for next breakout and TP

Too Quiet to Be Dead, Too Strong to Ignore401JKUSD is doing exactly what you want to see from a token that’s still early but not fragile. It’s not ancient, but it’s clearly past the danger zone where things just nuke after launch. Price has cooled off without collapsing, which already says a lot. This isn’t a dump chart, it’s a patience chart. The kind where nothing flashy happens for a while and people who understand structure just sit there and let it cook.
The move up already happened once, and instead of giving everything back, price just compressed. Lower highs, tight range, no chaos, no death wicks, no mass exits. That’s not fear, that’s holders chilling. Sellers have tried, but they’re not getting follow-through. Every push down gets absorbed and price just keeps hanging around the same zone like it’s refusing to die. That’s strength, even if it looks boring on the surface.
What really stands out is how clean this is for a newer token. No obvious liquidity grab, no violent retrace, no “oh it’s over” moment. It feels more like quiet accumulation than distribution. The market isn’t screaming, it’s whispering. And those are usually the charts that surprise people later when they least expect it.
The vibe around 401JKUSD matches the chart too. The community isn’t gone, it’s not coping, it’s not panicking. People are still there, still talking, still believing, but without forced hype. That’s honestly one of the most bullish combos in crypto. No overpromising, no exit liquidity energy, just steady conviction and patience.
This setup feels like one of those “you either get bored and leave, or you wait and get paid” situations. Compression like this doesn’t last forever. When it finally decides to move, it usually doesn’t ask for permission. Not saying moon tomorrow, but this is exactly how things look before they stop being quiet.
Overall, 401JKUSD feels alive, healthy, and underestimated. Not cooked, not dumped, not forgotten. Just building, slowly, while most people scroll past it. And in this market, that’s lowkey where the best moves usually start.

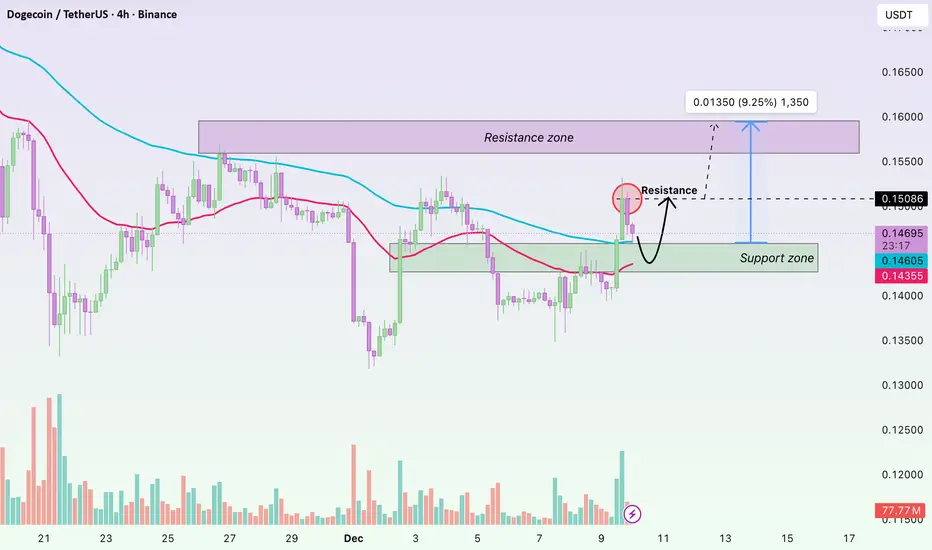
DOGE – Short-Term Breakout: EMA and Volume Support the UptrendHi everyone, Domic here. Dogecoin is showing a strong bullish move after breaking key EMA levels, accompanied by rising volume, indicating that buyers are in control. On the H4 chart, the 34 EMA (red) and 89 EMA (blue) serve as markers of the short-term trend. DOGE moving above both EMAs while forming higher lows suggests a high probability of continued short-term gains. Price is currently approaching the 89 EMA, a key technical resistance, and its reaction around this level will determine the next leg of the uptrend.
Trading volume on December 9 surged, reflecting active buying and support for the breakout from the accumulation zone around $0.146 to above $0.147. This signals that DOGE has the potential to extend its rally, but attention should be paid to its reaction near the $0.150 resistance level.
Currently, the market anticipates a clear breakout above $0.150. Positive sentiment from external factors — such as Elon Musk’s tweets, renewed interest in meme coins, DOGE adoption as a payment method, and expectations of a dovish Fed — is supporting inflows.
Wishing you all a successful trading day!
PUMPUSDT = Time to buy?🐸 NYSE:PUMP #PumpFun ➖ Time to buy?
Chart (PUMPUSDT):
PUMP is down 72% from its all-time high. Looking at the liquidation map, this looks like a solid entry point to grab some PUMP for part of the portfolio with around +150% upside potential.
Take-profit target is $0.007 ➖ right where the biggest cluster of short liquidations sits.
