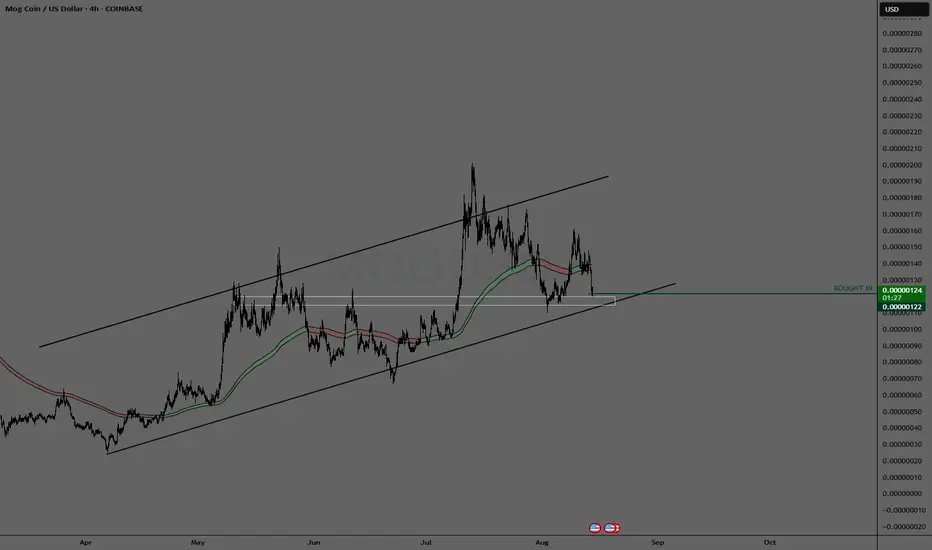
Babydoge - 1 Month+ falling wedge breakout#Babydoge - 1Month+ falling wedge brekout ✅
Bullish setup with a pump potential > 20% here 📈
A bullish consolidation & retest of the 0.0xx1220 - 0.xx1200$ would be pretty bullish for the next!
Memecoin

Dejitaru Tsuka: A Puritan of Decentralized Finance?I've made other UNISWAP:TSUKAUSDC_67CEA3 posts prior to this one. The targets are all over the place. This is partly due to TradingView's Fibonacci tool sometimes acting erratically, but also due to premature assumptions on my part.
re: $777 target
This one was very much wild, especially in near term. This was due to my belief that TSUKA would be printing an impulsive wave (I was still growing in my Elliott Wave studies, as I am now too). My belief is now different, and I think the chart has confirmed the same.
re: sub $100 targets
These were totally due to a glitching Fib tool. Thanks TradingView.
re: targets between $100-$130
These are fully expected to be in order based on the Fibs and form of TSUKA's macro fractal. The only thing that could negate such targets in my opinion is Bitcoin breaking below $75,000 before October - December 2026 . I think this would be a strong and decisive indication that altseason is officially over (and the first major fractal for Bitcoin's macro chart).
Between today and the end of altcoin season, I expect that Dejitaru Tsuka will outperform 99% of all available tickers, of all available markets .
*Key price levels and expected periods of transitional moves are very likely to change. Surf carefully/closely.

Moodeng Meme Coin sell-off happening as expectedMoodeng Meme Coin sell-off is happening as expected. It's taking some weeks and this meme coin is dropping as a reaction to the very strong supply imbalance in the bigger timeframes. This trade idea has been shared in the past and for those swing traders holding this meme coin it's time to manage the short positons.

SHIB Swing Long IdeaSHIB Swing Long Idea
📊 Market Sentiment
Market sentiment remains constructive, backed by the potential of a 0.25% rate cut at the upcoming FOMC meeting. With the USD weakening and global risk appetite improving, conditions continue to support upside momentum across crypto markets.
📈 Technical Analysis
Price has broken the LTF bullish trendline and is retracing lower.
However, the broader HTF trend remains strongly bullish, so I’m focused only on long setups.
I expect price to test the daily demand zone and sweep liquidity within it before initiating a move higher.
📌 Game Plan
1)Price to reach the daily demand zone at 0.00001177
2)Price to run the 0.00001164 daily swing liquidity level (major liquidity pool)
3)Price to retrace into the 0.75 max discount zone for confluence
🎯 Setup Trigger
I will look for a confirmed 4H break of structure before entering.
📋 Trade Management
Stoploss: Below the 4H swing low responsible for the BOS
Targets:
• TP1: $0.00001350
• TP2: $0.00001420
• TP3: $0.00001595
💬 Like, follow, and comment if you find this setup valuable!
⚠️ Disclaimer: This content is for informational and educational purposes only and does not constitute financial, investment, or trading advice. Always do your own research before making any financial decisions.

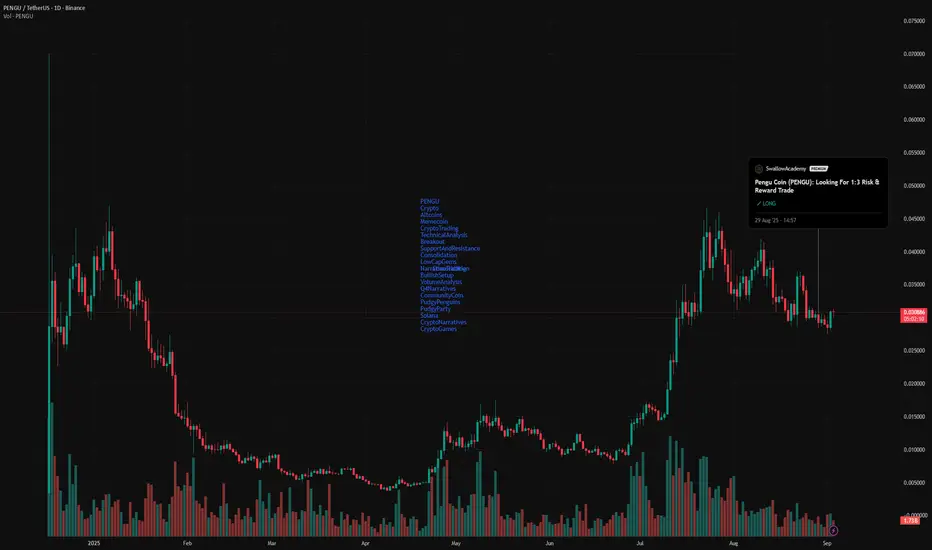
Is $PENGU about to send?TL;DR
Pengu is holding up strong around $0.030 after a big run-up. It’s been consolidating here for a bit, and it’s starting to look like we might be gearing up for the next leg. Plus, the community is super active, and there’s a lot going on behind the scenes.
So what’s Happening?
Price is chilling around ~$0.030
Strong support holding at $0.029 and I've seen multiple bounces there
Had a big run-up to $0.07+, followed by a healthy cooldown
Currently in a classic consolidation phase
Volume looks solid buyers stepping in under $0.030 every time
Why Are People Still Bullish?
Pudgy Penguins just sponsored a NASCAR team. Actual race cars with penguins on them.
The Pudgy Party mobile game is blowing up. On-chain interactions, tournaments, great reviews, and people are actually playing.
X (Twitter) is full of believers stacking more at these levels. The meme game is strong, but so is the real use case stuff.
Some guy even said this in a post:
“In a few months we’ll laugh at these prices.” He might be right.
If you're thinking of jumping in, here’s a simple setup, but always do your own research first:
Buy Zone: $0.030–$0.031
Take Profit: First target at $0.036, second target around $0.045
Stop Loss: ~$0.028
Good risk/reward if you think the sideways chop is ending soon.
Final Thoughts:
Pengu has meme energy, but it also has a growing ecosystem. Between the mobile game, the merch, the community, and real brand exposure.
You don’t have to ape, but if you're watching this one… stay close. This penguin could be heating up!
TRUMP TRADE PLANLooking forward to accumulate trump in the grey zone. It will have massive pumps during the memecoin rally!
Lets see the price action in the grey zone and do some DCA.

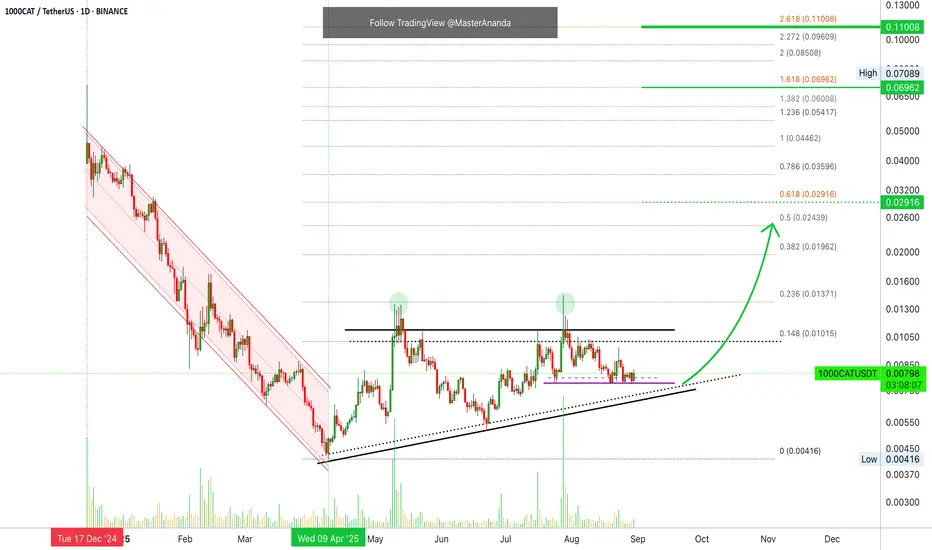
1000CAT Bullish Price Action & Chart Patterns · 1,280% TargetThis is so very interesting... I've seen this chart.
I've seen this setup, i've seen the signals and i've seen the results. The result is a very strong bullish jump and I have everything you need to read to agree with me.
QTUMUSDT. Did you read the analysis I just published?
The chart looks something like this but before the consolidation pattern breakout.
1000CATUSDT. The purple line is the main support for those who like high leverage. This should be the stop.
1000CATUSDT is showing really high volume as a it moves within a rising channel. This channel is producing higher lows with a relatively flat top. There are two rejections around 0.01300. The first one led to the 22-June low and the second one much higher, which is the current price zone. The lack of sellers looks pretty good for the bulls.
If you consider the really high green volume bars in the past few months, you know that behind the scenes there is a bullish bias even if 1000CAT is only consolidating.
All that is needed here is patience and this pair will soon move. Can happen right away, conditions are good but momentum is lacking; or, it can take a while. In both cases, a rise as the next major move is certain.
Namaste.
#MEME/USDT#MEME
The price is moving within a descending channel on the 1-hour frame and is expected to break and continue upward.
We have a trend to stabilize above the 100 moving average once again.
We have a downtrend on the RSI indicator that supports the upward break.
We have a support area at the lower boundary of the channel at 0.002644, acting as strong support from which the price can rebound.
We have a major support area in green that pushed the price upward at 0.002447.
Entry price: 0.02929.
First target: 0.003232.
Second target: 0.003604.
Third target: 0.004113.
To manage risk, don't forget stop loss and capital management.
When you reach the first target, save some profits and then change the stop order to an entry order.
For inquiries, please comment.
Thank you.

#MEME/USDT#MEME
The price is moving in a descending channel on the 1-hour frame and is adhering to it well and is heading to break it strongly upwards and retest it
We have a bounce from the lower limit of the descending channel, this support is at a price of 0.00284
We have a downtrend on the RSI indicator that is about to break and retest, which supports the rise
We have a trend to stabilize above the moving average 100
Entry price 0.00309
First target 0.00334
Second target 0.00355
Third target 0.00381

Smart Money Eyes $PENGU – Breakout Watch ON$PENGU/USDT looks healthy on the weekly chart. Price is currently rejecting from the major resistance zone.
A pullback toward the golden Fibonacci level at 0.618 would be healthy before a potential continuation to the upside.
A clean breakout above this resistance could open the door for a new all-time high.
DYOR, NFA

ANI/USDT - LONGAni Grok Companion
It will take about two weeks to realize the asset.
(This is not an investment recommendation).

BITTY "OG" – Btc Mascot to Become the Next PEPE, Shib or Doge🚀 BITTY "OG" – The Bitcoin Mascot Ready to Become the Next PEPE, SHIBA or DOGE?
The crypto market has already proven that meme coins are more than just hype – they are a powerful narrative that unites communities and moves billions in market cap. What started with Dogecoin, got followed by Shiba Inu, and most recently PEPE, each of them reaching massive growth and adoption. Now, there’s a new contender rising fast: $BITTY, the official Bitcoin mascot.
🔥 Why BITTY?
✅ Narrative 100% – Bitcoin is the #1 brand in crypto, and BITTY brings a recognizable mascot directly tied to it.
✅ Community 100% – Already over 10,000 holders with a hyper-active community growing by the day.
✅ Positioning – The first true OG meme directly linked to Bitcoin itself.
The potential profits? INSANE.
📈 The Chart – Next Phase: +373%
On the 4H chart, BITTY has built strong support and looks ready for the next breakout.
The short-term target? Around +373% from the current level.
The technical setup confirms this with:
EMA ribbon support
Higher lows forming
Breakout from consolidation
🐸 Meme Giants Comparison
What if BITTY follows the path of previous meme legends?
PEPE Marketcap ≈ $3.5B
→ BITTY would see a potential ~200x from here.
SHIBA Marketcap ≈ $15B (ATH)
→ BITTY could climb ~800x.
DOGE Marketcap ≈ $85B (ATH)
→ BITTY could reach a mind-blowing ~4500x.
🌐 Conclusion
BITTY is more than just another meme coin. It’s the Bitcoin-native mascot with:
Strong branding
A highly active community
A narrative with massive reach
With this setup, BITTY has the chance to become the next big meme runner. Gains here aren’t just possible – they could be legendary.
💡 Question to the community: Could BITTY be the next PEPE or SHIBA – or even rival DOGE as the true OG meme coin?

$PWEASE will go to the moon$ PWEASE go to the moon.
The daily RSI retested the 50 line, indicating the start of an uptrend after a long period of accumulation with well-defined support. BTC dominance is falling, which is essential for the rise of altcoins.
The political scenario also helps, with JD Vance increasingly in the media spotlight (even appearing on South Park).
At least 100 million is expected.
If Trump slips and falls, we will expect at least 10 billion.
$ PWEASE market cap today: only 4.5 million
Easy Money!

Potential reversal in sight - x100 Potential MEME CoinAs a price action trader im still waiting for confirmation and/or liquidity sweep however overall
chart looks great with a tons of confluence for a POTENTIAL reversal 😉
We are still bullish on a daily. Yesterday printed a doji candle in high confluence area - daily and 4-hours order block responsible for the last breakout .
We are playing around 200 SMA on 4H and strong volume support area and we are definitely in discount area considering the last leg up.
I would like to see a change of character on 30 min - 1 H and /or a liquidity sweep before calling a trade entry cause we are still in a downtrend until proved otherwise.
ON fundamental side of things - the team is very active and doing everything to bring this coin to BONK market cap.
Keep an eye on this x100 gem is all i am saying 🤑🥸

Moo Deng Crypto Meme Coin is dropping as expectedMoo Deng Crypto Meme Coin is dropping as expected. There is still a lot of room for this crypto to keep on dropping with the help of the strong monthly supply imbalance mentioned in a previous update.

MEME Main trend -97% Channel. Reversal or scam zone.Logarithm. Time frame 3 days (less is not needed).
🟡 The price has reached a decline from the highs (not a listing squeeze) -97%. These are practically the maximums of declines after the hype for cryptocurrencies of such liquidity (96-98), after which there is only a complete scam. At the moment, there is a reaction from this zone (the lower zone of the main trend channel) (impulse buyback), and a rollback after it, which forms the canvas of a potential ascending flag. If there is a breakthrough, then locally - the implementation of the ascending flag.
⚠️🔼 These are high-risk cryptocurrencies of such liquidity (that's why such declines are big), but the percentage of price growth in them, for the same reasons (liquidity/volatility) is an order of magnitude greater in the case of their implementation. When working with such assets, observe money management.
🟣 Implementation of the flag's goals (essentially to the channel median) +80-100%
🟡 To the resistance of the descending channel of the main trend +325%
🔵 To potential highs (one of the previous consolidations) +1000-1300%.

15% for MEME soonMEME is showing strength as market is bullish, I am expecting continuation with 15% minimum gain tomorrow.
NOT A FINANCIAL ADVICE
MANAGE YOUR RISK AND ALWAYS USE STOPLOSS

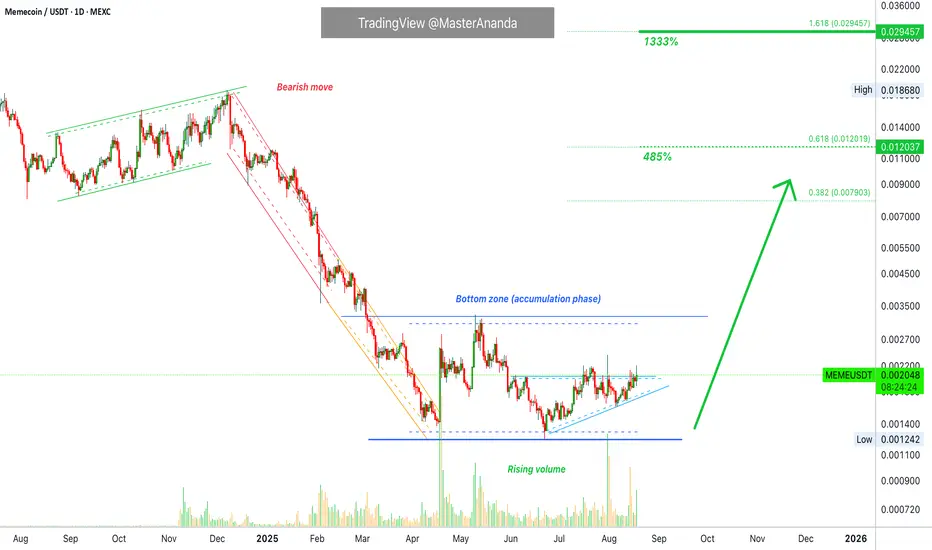
Memecoin Bottom Zone Activated · 1333% Profits PotentialThe bottom zone was activated mid-March and trading volume started to rise immediately...
Memecoin (MEMEUSDT) has been calling my attention recently. I am getting the feeling that this one will produce a strong cycle in the coming months. We have very strong targets as it is usual for memes.
The bottom zone being active is nothing more than good news.
We can appreciate in two ways how the bearish wave is over. (1) No new lows and (2) trading volume. The trading volume signal comes from the fact that the last major low had no bearish volume and bull volume has been rising.
Memecoin also has the same pattern as other pairs that moved ahead. A major low in April followed by a second low in June. This double-bottom sequence marks the end of the Q1-Q2 2025 correction. Thus the start of the next uptrend.
1,333% potential for growth in the coming months. Can be mid-term.
Focus on the goal. Aim high. Long haul.
Namaste.
$BONK: my green zones are back. Time to refill our bags.💥 SEED_DONKEYDAN_MARKET_CAP:BONK – The Solana Meme King 💥
SEED_DONKEYDAN_MARKET_CAP:BONK is the Solana meme coin. It was launched when CRYPTOCAP:SOL was at the bottom, and every CRYPTOCAP:SOL whale remembers it. With a strong community of holders, when SEED_DONKEYDAN_MARKET_CAP:BONK pumps, it does it massively. 🚀
🔹 This altseason shouldn’t be different. If SEED_DONKEYDAN_MARKET_CAP:BONK retraces into my green buy zone, it’s a great “refill your bag” setup.
🔹 Meme coins are not long-term holds – buy as low as possible and take profits once RSI overheats.
🔹 Currently, SEED_DONKEYDAN_MARKET_CAP:BONK has retraced ~50% of its last pump. From here, either:
1️⃣ It starts flying now (then it’s too late to buy), or
2️⃣ It retraces fully – which it has done in every past pump cycle.
📊 Like many altcoins, SEED_DONKEYDAN_MARKET_CAP:BONK is in a descending range and recently got rejected. A solid entry often comes when price hits my green zone with RSI bottoming and confirmed by my RSI Divergence indicator (Daily timeframe).
⚠️ Reminder: Meme coins retrace faster and deeper than most alts, but they also pump higher and sharper than expected. Patience is key.
👉 DYOR & trade safe!
#BONK #Solana #Altseason #CryptoTrading #MemeCoins #RSI #TradingView

MOGUSD Bullish trend maybe $0.00001We can see that MOG has been in a down trend for quite sometime.
Now my bias is that right now it is creating great trend to the upside.
I bought not too long ago and sold my SHIB coins.
This is not financial advise but I see MOG coin progress even higher.
Now I am not saying $1. But around $0.00001 or if we are lucky $0.0001.
But the reasoning for investing is because well we can see meme coins as something volatile.
Not necessarily long term but a nice short term gain.
I think MOG will push for higher highs.
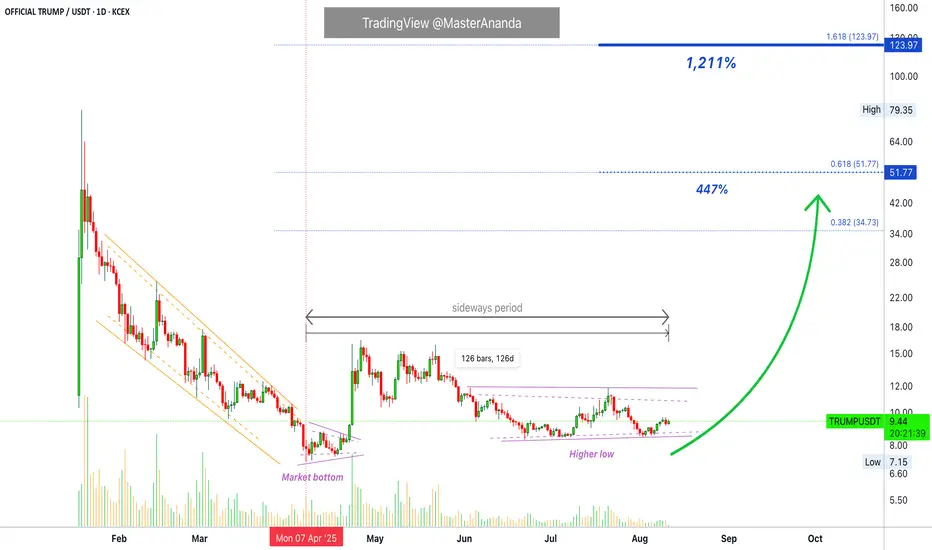
OFFICIAL TRUMP Updated · New Numbers, New Targets & 1,211%Hello my dear follower, it is my pleasure to write for you. I have an update on this memecoin, TRUMPUSDT, and you are going to like it.
Are you one of the many holding long-term?
Have you been able to do it?
What does it feel like?
Is it hard or was it an easy process?
The entire market is in the same situation; either consolidating or growing slowly.
Some pairs can be more advanced than ours but there is no difference if we are only willing to sell high. Some can be behind and catch up or even go beyond one that has been rising for months.
It is a mixed bag. It is better to plan and follow the plan. Opportunities are many and good but you have to make your choice. Your own choices, your own decisions, your results, your responsibility. We are all adults.
TRUMPUSDT has been sideways for four months and nothing changes. The longer this sideways period lasts the stronger the bullish wave that follows. We go straight to a bullish wave because we clearly have a higher low and we know Ether, XRP and Cardano are trading high up. The rest of the market will catch up.
The numbers on the chart have been updated. These are good and valid now and these numbers do not change. You can use it now and forever more they work long-term.
The levels on the chart are main resistance points. $35, $52 and $124.
It will be a nice rise.
It will be a strong rise.
Today the price can be $9.46, in just two months it can be $65. It can be more, it can be less.
There can be a two months long correction after a very strong wave of growth. After these two months long correction we get another advance, the famous bull run.
We are looking at bottom prices now, August 10 2025. It is already late.
It is early to buy, there is still time. But the market will not wait.
The wait is over.
Namaste.
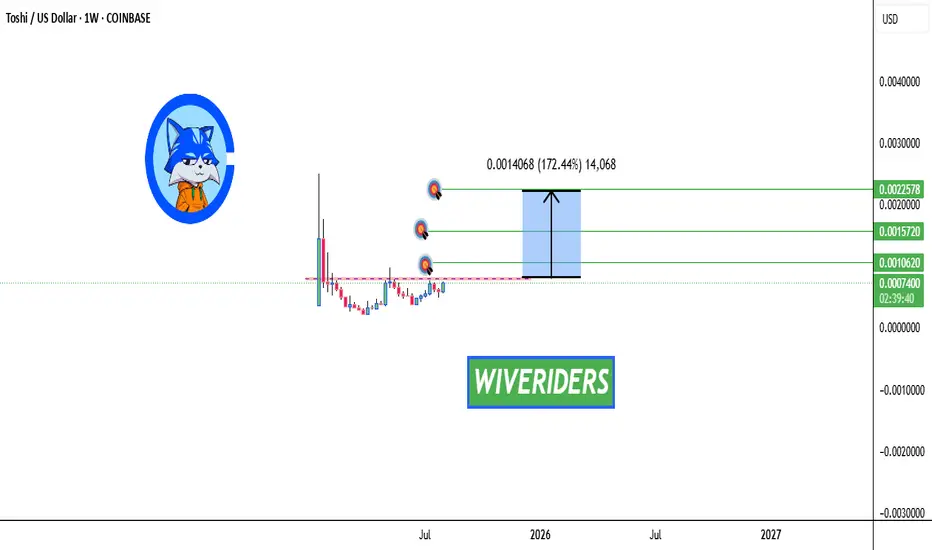
TOSHI Breakout Watch – Testing Red Resistance Again!🚨 $TOSHI Breakout Watch – Testing Red Resistance Again! 🔴⏳
$TOSHI is testing the red resistance zone again.
📊 If breakout confirms, realistic targets in this bull market are the green line levels.
💡 If you have $TOSHI, don’t sell now — at this moment, there’s no sell signal. Best move is to hold and wait for a breakout.
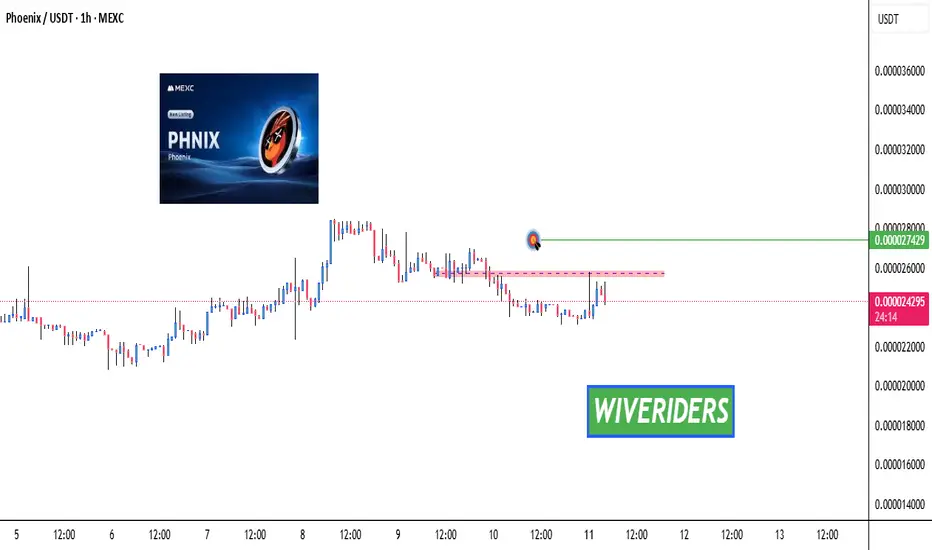
PHNIX Breakout Watch – Red Resistance Being Tested!🚨 PHNIX Breakout Watch – Red Resistance Being Tested! 🔴⏳
PHNIX is testing the red resistance zone.
📊 If breakout confirms, next move could target:
🎯 First Target → Green line level
A breakout could trigger bullish continuation and upside momentum.