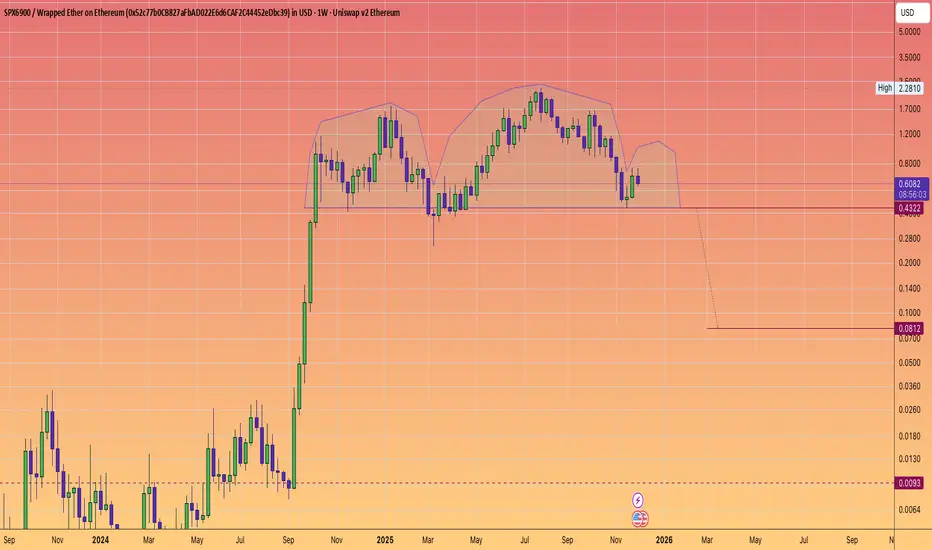
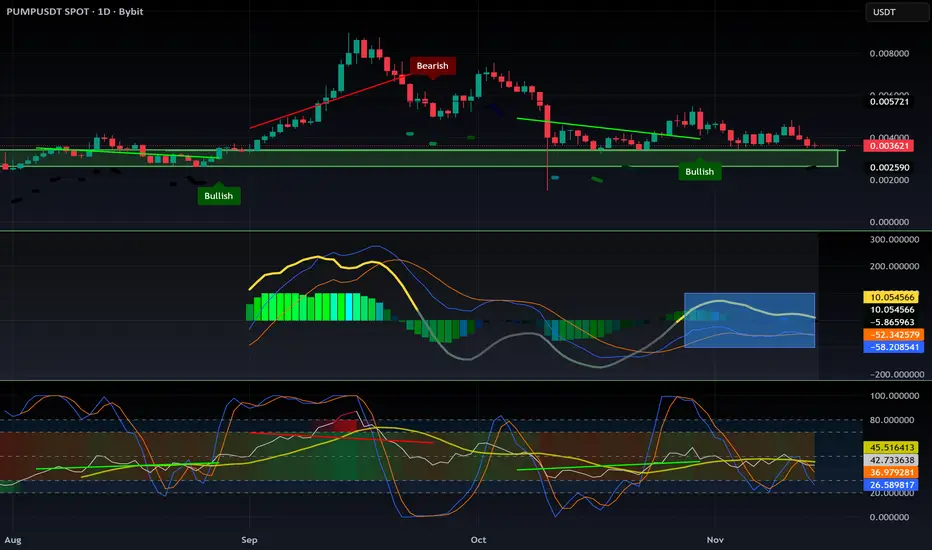
SPX6900 The meme with no community and doomed to crash.The S&P500 is at 6900
so why hold a memecoin for a target that has already been met.
SELL!
SELL!
SELL!
In true Cramer fashion :)
You will be glad you did if you are still holding, hoping and praying.
Memecoins
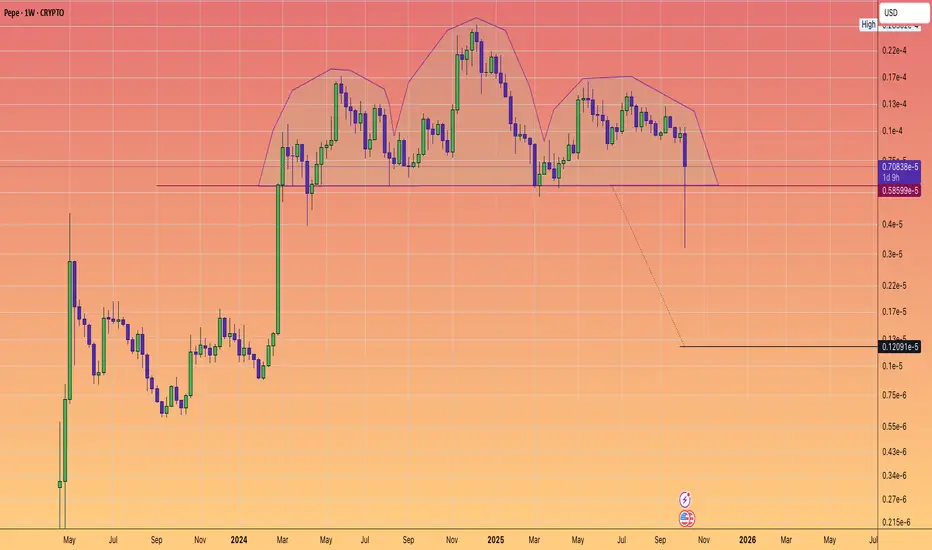
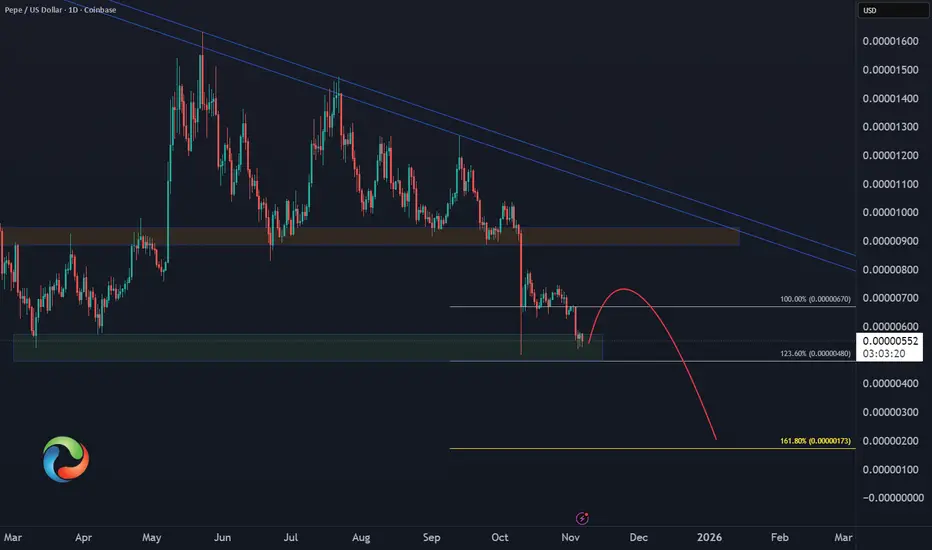
$PEPE: MAJOR HEAD and SHOULDERS BREAKDOWN WARNING.🐸🐸🐸
⚠️⚠️⚠️
Pattern formed, Big Move Ahead?
The weekly chart of #Pepe has confirmed a classic head and shoudlers pattern - a powerful bearish setup.
After over 1.5 years of building this structure, price decisively pierced the neckline with a sharp drop.
Suggesting that a weekly close below the neckline could trigger an accelerative towards the pattern target.
Key Levels
Neckline: $0.0000058599
Target: $0.0000012091
Why does it matter?
Head and shoulders are the most trusted reversal technical patterns. Coupled with declining and weakening sentiment. This pattern warns of more downside--- unless buyers can mount a quick rescue.
What's your strategy?
Are you shorting the breakdown, waiting for the target, or looking for a fake-out reversal?
Drop your thoughts/Analysis or questions in the comments!
FLOKI Potential Correction Soon ! RSI at 99If you haven't read my article about meme coins:
Then the heightened RSI level of 99 for FLOKI signals a potential correction on the horizon.
Such an extremely high RSI often indicates overbought conditions, suggesting that the asset may be due for a pullback.
The price target, as per the Fibonacci retracement tool, is: $0.00000697

TOTAL3: Altcoins Prepare for $8.6T Market Cap by 2029Based on fractals and fibs, considering common possibilities and eliminating those which were deemed unlikely, TOTAL3 appears primed to extend its run throughout 2028. The waves may not produce pure verticals as it did in the past and instead, we could see years of overlapping, ping-pong action. With a market cap of $8.9T (predicted), this suggests that institutions and larger than retail players may find the risk/reward presented in the altcoin space as desirable. My surfboard is ready.

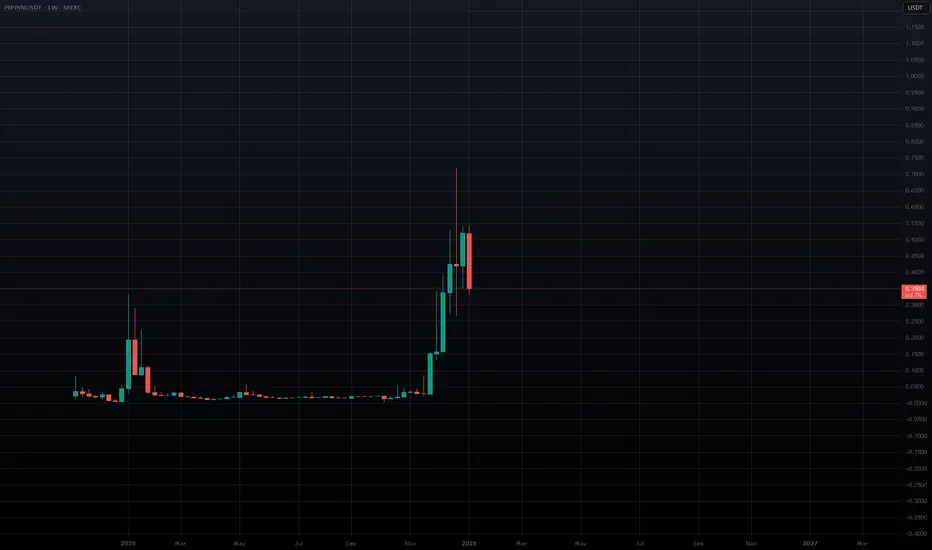
PIPPIN: Great example of institutional level value extraction.Have you seen these tokens which pump 20-50x (sometimes even 100x++) before violently crashing and flat lining for months on end, just to do it again or be abandoned forever?
They are handled by professionals, backed by deep pockets.
We aren't talking small ball, pump/dump groups.
These are institutional level, with some reaching up to $100M+ turnover, billions in market cap.
Handlers pay:
KOLs to shill buyers/long positions before big crashes, to extract value from panic sellers and long liquidations.
KOLs to shill sellers/short positions before big pumps, to extract value from FOMO buyers and short liquidations.
exchanges for listings, market makers for liquidity
Meanwhile they cleverly abuse the pump.fun AMM LP curve mechanics, index pricing and monitoring large perp buyers/sellers to hunt liquidations.
Once the game has run it's course, the token's AMM pool is dumped into, drained and the token goes back to marginal value.
Handlers hold on to large amounts of supply, while walking away with profits.
Reality of the pump.fun AMM bonding curve;
You can not sell more value than later buyers inject.
While early sellers drain real value, late sellers hold unrealizable paper gains.
In normal markets, price reflects belief, liquidity, and risk;
manipulation requires capital
In these pump.fun AMM plays, price reflects how far along the curve you are;
manipulation requires timing, not conviction
Early buyers acquire massive supply at minimal cost, while later buyers must pay exponentially more and affect price more than early buyers.
This is not conviction, price discovery or speculation, it’s mechanical value extraction.
The curve is built for this, it’s doing exactly what it was designed to do;
maximize early upside
compress price discovery
transfer value from late participants to early ones
PIPPIN is an interesting project, with a great mind behind it.
The problem is that pump.fun tokens like this are abused and exploited so hard, leaving an immense amount of dead money/bag holders.
It is uncertain to me if even a single one of these tokens will be able to carry value into the long-term.
1W WIF Chart: Potential bottom on WIF? I’m watching WIF cautiously on the weekly, but it’s now firmly on my radar for a potential bottoming process, along with other SOL ecosystem meme coins.
After a prolonged and aggressive downtrend from the highs, downside momentum has slowed materially. Price is no longer cascading lower and is instead compressing near the lows, which is often how these assets begin transitioning from distribution into early accumulation. This isn’t a reversal yet, but it is a change in behavior.
Structurally, WIF is spending time building value near the bottom of its range rather than bouncing and failing immediately. Volatility has contracted significantly compared to prior selloffs, and each push lower is attracting quicker responses from buyers, even if they’re still cautious.
I’m not assuming this is a bottom, but this is the zone where bottoms typically form if they’re going to form at all. The key for me will be time and confirmation: higher lows, reduced sell pressure, and eventually a reclaim of prior weekly resistance. Until then, patience is critical.
This same dynamic is starting to show up across several SOL meme names, which makes it worth monitoring as a group rather than in isolation. For now, this remains a watch-and-wait situation, with risk management front and center and no need to force exposure before the structure proves itself.

Crypto: Risk on! Memes gonna lead, PEPE on the way!Crypto appears to have formed a local bottom, with reversal structures developing across the majority of major assets.
Bitcoin is currently constrained in terms of upside expansion, which increases the probability of capital rotation into altcoins. In this environment, select altcoins are likely to significantly outperform BTC on a relative basis.
Liquidity is stacked higher, and if momentum accelerates, the market may expand aggressively without offering deep pullbacks. From a positioning standpoint, this creates a clear choice: enter at current levels with defined risk, or remain patient and wait for a shallow retracement that may never materialize.
Meme coins are likely to lead the initial phase of the move. While they carry the highest risk profile in the market, they also offer the strongest short-term returns. These should be approached strictly as momentum trades — enter during expansion and exit into strength, as seen in previous cycles (PONKE being a recent example).
Follow for more trading ideas

DOGE Analysis (1D)Dogecoin has entered the correction phase from the point we marked on the chart.
Based on the structure, an ABC pattern has been identified on the chart, and after wave C is completed, we expect retracement movements to the upside.
Wave C still needs more time to complete, and it is expected to finish between the two vertical time lines drawn on the chart.
Within the time lines and the green zone, one can consider buy/long positions.
As long as wave C has not finished, buying is not wise
For risk management, please don't forget stop loss and capital management
When we reach the first target, save some profit and then change the stop to entry
Comment if you have any questions
Thank You

PEPE price analysis🐸 “Altseason is here!” — at least that’s what the CRYPTOCAP:PEPE market maker decided, printing +46% on a single 3D candle.
📊 With a market cap around $2.4B and daily trading volume close to $1.2B, liquidity is clearly not an issue anymore.
📈 From a technical perspective, OKX:PEPEUSDT still has room for a step-by-step (“saw-like”) continuation higher.
The key zone to watch is $0.0000090, where:
a descending trendline
and a strong historical mirror level intersect.
⚠️ This area could easily become a decision point
🤔 What do you think — is this just a hype-driven spike, or the beginning of a new impulsive leg for CRYPTOCAP:PEPE ?
______________
◆ Follow us ❤️ for daily crypto insights & updates!
🚀 Don’t miss out on important market moves
🧠 DYOR | This is not financial advice, just thinking out loud

TRUMP Coin Still Looks Bearish (1D)It seems to be in a triple correction, and we are currently in the second X wave. The first part was a symmetrical pattern and the second part was a zigzag, and now after the second X wave, the third correction will appear.
Each correction has been strong and has caused an 80–90% price retracement, and the third part, the Z wave, can also create a deep correction.
To enter a position on the hourly timeframes, you need confirmation and triggers. It appears there are many sell orders in the red zone.
A daily candle closing above the invalidation level will invalidate this analysis.
For risk management, please don't forget stop loss and capital management
When we reach the first target, save some profit and then change the stop to entry
Comment if you have any questions
Thank You

FARTCOIN RoadMap (1D)It seems the price is in an ABC correction, and we are now at the end of wave C.
The green zone is a suitable area for spot buying. We need to see whether the price will make a deeper pullback into the green zone or if it will break out from the red descending trendlines from here.
It appears that one bullish wave in the form of wave C is still remaining on the chart.
Keep in mind that this is a highly volatile memecoin, so you must control your risk and position size.
Since the target for this coin is a large one, the invalidation level is also far away. Therefore, you should pay special attention to the timeframe and risk management.
Let’s see what happens | this is our outlook on FARTCOIN.
For risk management, please don't forget stop loss and capital management
When we reach the first target, save some profit and then change the stop to entry
Comment if you have any questions
Thank You

Bertram the Pomeranian MemeCoin Project is holding well over the time and I am convinced the performance will go well the coming months.

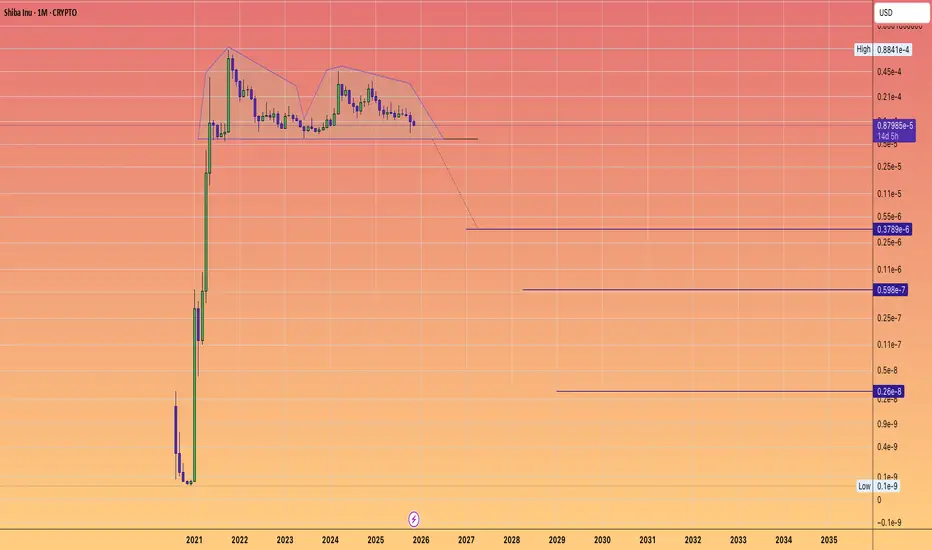
The most significant chart of inefficiency: SHIBA INUCould Shiba have created one of the most significant Double Tops in the history of assets?
Shib, along with a large portion of the Memecoin sector, is currently entering a crypto winter that COULD potentially reset nearly all tokens, coins, and memes lacking inherent utility, broad adoption, or significant social awareness.
Consider the 38 million coins that have been produced.
Which ones are truly necessary to you?
Which ones offer you real value or utility?
Which ones might be able to substitute certain elements of traditional finance?
A casino can certainly be entertaining.
But is living in a casino every day what you really want?
$PUMP: when to accumulate?There’s a strong support zone between $0.02900 and $0.03300.
At the current price, NYSE:PUMP already looks like an attractive buy in my opinion — but if it drops into the green box, I’ll definitely go long.
The lower it goes, the better the entry.
My plan is simple:
➡️ Enter
➡️ Take profit on a quick +10% move
➡️ Fire and forget
This asset is extremely volatile. There will be many more dips and plenty of trading opportunities — so stay cautious, get in and out fast, and don’t get greedy.
DYOR.
PEPE – Relief Rally, Then More Pain?CRYPTO:PEPEUSD is still testing the 2025 lows, which could trigger a short-term bounce in the coming weeks. However, unless the rally breaks above the October high, the structure suggests this is just a corrective move before further downside resumes.
📉 Key Levels to Watch:
Support: 2025 lows – potential bounce zone
Resistance: October high – likely cap for relief rally
Outlook: Bearish continuation favored unless bulls reclaim key resistance
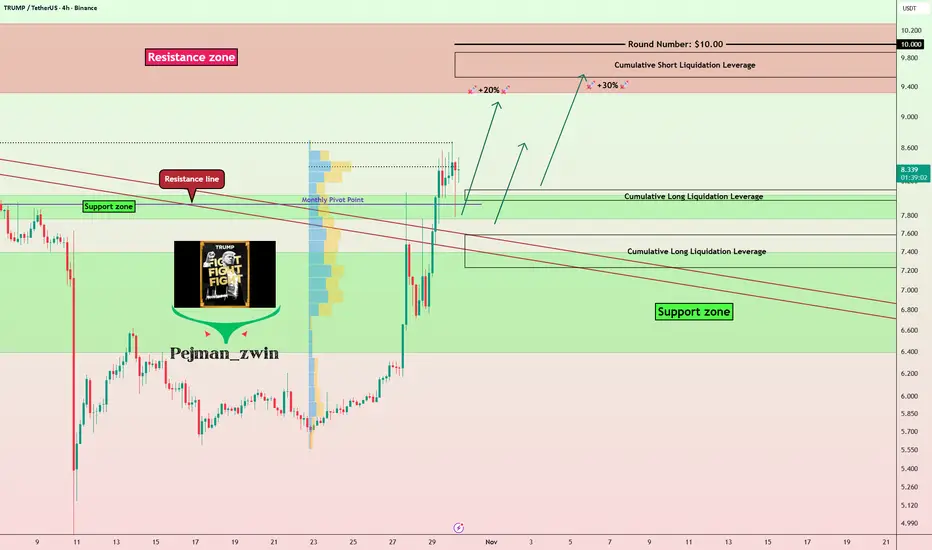
TRUMP Token Ecosystem Expanding – Real Utility Incoming(+30%)?The Official Trump ( BINANCE:TRUMPUSDT ) token has recently shown strong resilience and even outperformed the broader crypto market — and there are several interconnected reasons behind this momentum :
1. Whale Accumulation and Investor Confidence
Large holders have increased their TRUMP balances from roughly 3.97M to 4.88M tokens. This accumulation suggests renewed confidence and long-term positioning by influential investors, providing a strong base of support.
2. Expansion of the Trump Crypto Ecosystem
The ecosystem around Trump-linked assets is growing:
World Liberty Financial, connected to the Trump family, announced a distribution of 8.4M WLFI tokens to users of its USD1 stablecoin on the Enso blockchain.
This strengthens cross-project connectivity and gives TRUMP indirect exposure to new on-chain activity and liquidity.
3. Strategic Business Moves
The TRUMP token issuer, Fight Fight Fight LLC, is reportedly in talks to acquire the U.S. operations of Republic, a regulated investment and crowdfunding platform.
If completed, this deal could:
Add real utility to TRUMP (e.g., payments, fundraising, platform fees).
Expand adoption beyond speculation.
Reinforce the token’s legitimacy within U.S. financial infrastructure.
Summary
While the broader crypto market has dipped, TRUMP is supported by:
Whale accumulation,
Expanding ecosystem ties,
A potential acquisition bringing real-world utility, and
These factors together explain why the TRUMP token could continue to rise — or at least remain relatively strong — even in a weakening crypto environment.
-------------------------------------------------------
After reviewing the recent news around the TRUMP token , let's take a look at its 4-hour time frame chart.
Currently, the TRUMP token has successfully broken through its Resistance lines with strong momentum and is now moving near a Support zone($8.30-$7.76) and a Cumulative Long Liquidation Leverage($8.10-$7.97) .
I expect that even if the crypto market and Bitcoin ( BINANCE:BTCUSDT ) experience some decline, the TRUMP token might be able to hold its ground thanks to the positive news and the strong momentum it showed when breaking those resistance lines. We could see it potentially rise another +20%/+30% and reach its next Resistance zone($10.30-$9.32) .
Note: A key price level to watch for TRUMP is around $8.70, which has served as both strong support and resistance over the past few months and has been notable in terms of trading volume.
Stop Loss(SL): $7.19(Worst)
Cumulative Long Liquidation Leverage: $7.58-$7.23
Cumulative Short Liquidation Leverage: $9.88-$9.53
Please respect each other's ideas and express them politely if you agree or disagree.
OFFICIAL TRUMP Analyze (TRUMPUSDT), 4-hour time frame.
Be sure to follow the updated ideas.
Do not forget to put a Stop loss for your positions (For every position you want to open).
Please follow your strategy and updates; this is just my Idea, and I will gladly see your ideas in this post.
Please do not forget the ✅' like '✅ button 🙏😊 & Share it with your friends; thanks, and Trade safe.
I'm seeing a pretty good long setup on PEPEI'm seeing a pretty good long setup on CRYPTOCAP:PEPE #PEPE 🤔.
The trade is 1 to 4.
Entry: $0.0066162
Take Profit: $0.0079400
Stop Loss: $0.0062400
Based on the liquidation map, the trade is justified. You can give it a try.
Meme Coins: Gambling or Genius? The Untold Psychology!Hello Traders!
From Dogecoin to Shiba Inu to PEPE, meme coins have turned ordinary investors into overnight millionaires… and just as quickly, wiped them out.
But behind all the hype, memes, and moonshots, lies a deeper question:
Are meme coins pure gambling, or is there actually a kind of genius hidden inside this madness?
Let’s explore the real psychology that drives the meme coin phenomenon and what it teaches us about market behavior.
1. The Allure of “Quick Rich” Dreams
Meme coins sell emotion, not utility. They trigger the most powerful desire in human nature, the dream of instant wealth.
Traders jump in not because of fundamentals, but because of FOMO (Fear of Missing Out).
When people see others getting rich on Twitter or Telegram, logic disappears, replaced by hope and greed.
Meme coins don’t just trade on charts; they trade on human emotion.
2. The Hidden Genius of Community Psychology
While most treat meme coins as jokes, their creators understand one truth, markets move on attention .
Every meme coin is a masterclass in viral marketing.
They combine humor, belonging, and financial dreams, creating powerful communities that believe, promote, and act together.
It’s not fundamentals, it’s faith.
And when millions believe at the same time, even a joke becomes valuable, at least for a while.
3. The Bubble Psychology – Why It Repeats
Each meme coin cycle starts the same: early adopters accumulate silently.
Then comes the hype wave, influencers, trends, and social media buzz.
Late buyers rush in, liquidity explodes, and eventually, the supply outpaces the demand.
Finally, prices collapse, but the story repeats with a new name next month.
Humans never learn because our emotions never evolve. The pattern stays the same, only the logos change.
4. Genius or Gambling – The Thin Line
If you treat meme coins as “investments,” you’re gambling.
But if you treat them as short-term speculative plays with strict risk limits, you’re being strategic.
The key difference is not in the coin, it’s in your mindset.
Even BNF-level discipline can’t save someone trading emotionally in meme markets.
The real genius is not in predicting the next PEPE, it’s in managing risk when emotions run wild.
Rahul’s Tip:
Meme coins reveal more about human behavior than any economic theory ever will.
If you can understand why people chase hype, and control the urge within yourself, you’ll already be ahead of 90% of traders.
Conclusion:
Meme coins are not just digital jokes, they are mirrors reflecting our collective greed and hope.
They remind us that markets are not rational, they are emotional.
In the end, whether meme coins make you rich or broke depends less on the coin, and more on your ability to stay grounded while everyone else loses control.
If this post gave you a new perspective on meme coins, like it, share your view in comments, and follow for more deep trading psychology insights!

MemeCore – Ready to Burst HigherMEXC:MUSDT consolidated throughout October, dipping into the buying zone and now holding above the key support at $1.52. As long as this level remains intact, the setup favors a resumption of the rally toward new highs, with bullish momentum building beneath the surface.
🚀 Next advance will be toward the $3.33–$3.90 zone, which could mark the completion of wave 5 in the current bullish sequence. Once this impulsive leg wraps up, expect a larger degree correction to follow, offering potential re-entry opportunities for trend traders.

$PUP IN STRONG SUPPORT - ACCUMULATION ZONEGETTEX:PUP looks like it is forming its bottom nicely at these levels
Accumulate
P

Fartcoin Wyckoff ReaccumulationCRYPTO:FARTCOINUSD looks to be in Wyckoff reaccumulation. Honestly, there’s nothing more to say, the chart speaks for itself.
We’re currently sitting in the spring zone, waiting for a bounce, retest, and move up. In my opinion, that should unfold over the coming months.
The risk here is that the spring I’m seeing might not actually be the spring, in that case, price could go lower. Still, I doubt it breaks below the current low; if it does, I’d say the downside risk sits around $0.5.
The trend is slowly curling upward, and I’m looking at potential targets of:
- Bear case: $2
- Base case: $3
- Bull case: $4

WIF back to $3Complete look at Dog WIF Hat
We had some pretty nice technical setups on this meme.
#HVF
#DoubleTop
#InverseHeadandShoulders
#BullFlag
Currently it has two active patterns ...

Dogecoin: Uptrend Intact, Eyeing $0.90–$1.00 ZoneCRYPTOCAP:DOGE #Crypto #Memecoin #ElonMusk — September 24, 2025.
Price (Sept 24, 2025): $0.24700
Chart (1D):
•
•
💡 Entry & Exit:
Entry: $0.24700
🎯 Take Profit: $0.8900 (+260.32%)
My View:
Dogecoin pulled back nicely, but the overall uptrend is still intact. We’re seeing that rounded base start to tilt toward acceleration. Remember, this is Elon Musk’s meme coin = and it’s also tradable on Robinhood.
Looking at Coinbase order books, there’s a grid of buy orders stacked all the way up to $2.50. If we factor in a light breakout and the 1.618 Fibonacci extension, the $0.90–$1.00 range looks like a logical zone to lock in gains and move on from this coin.
The recent dip across crypto definitely shook a lot of people = myself included.
