$PEPE: my green zones are back. Time to refill our bags.Here’s my green box for CRYPTOCAP:PEPE : It’s behaving perfectly, mirroring BTC dominance like a loyal puppy 🐶. If Altseason hits, expect it to shine.
----------------
The altcoin market just saw a solid pump, following the massive CRYPTOCAP:BTC and CRYPTOCAP:ETH institutional billion-dollar purchases.
On the Daily timeframe, we’re actually printing higher lows, showing clear market strength. The top of the range was rejected, and now it’s highly probable that the crypto market will enter a consolidation phase — a move that could push several altcoins into my buying zones.
💡 Reminder: My buying zones are areas where it’s statistically safer to buy and hold, with an almost guaranteed chance of making a solid profit on the next bounce.
What could spark the infamous Altseason?
Many altcoins share one thing in common: a major resistance line (marked in yellow). For them to pump to the moon, this line needs to be broken.
We’re also seeing a price compression — meaning the breakout could be imminent. This pullback might be your last chance to enter a long position before the real Altseason kicks off.
Possible Altseason catalysts:
📉 FED Interest Rate Cut of 1% or more.
📈 Institutional adoption through altcoin index ETFs — imagine BlackRock launching ALT10, ALT50, ALT100 ETFs, attracting massive institutional money into the altcoin market.
I believe both events could happen before the end of the year.
DYOR — but the window might be closing fast. 🚀
Memecoins

Moodeng Meme Coin sell-off happening as expectedMoodeng Meme Coin sell-off is happening as expected. It's taking some weeks and this meme coin is dropping as a reaction to the very strong supply imbalance in the bigger timeframes. This trade idea has been shared in the past and for those swing traders holding this meme coin it's time to manage the short positons.

Goatseus Maximus Hooves the Dust. Ready to Buck Up Soon!Goatseus Maximus looks like an entry win here. Check out that long accumulation period. Bullish, or should I say, "GOATish"? Additionally, I have a signal to buy from my proprietary indicator. I will be a bit more aggressive on this one with a 1:4 rrr, targeting around .16 cents and stopping out at around .07. On this one, I may sell half a little earlier. Once we reach that ascending trendline, I will be watching price action closely. Keep an eye on my trade tracker for more.

Melania Meme · 877% Profits Potential & Technical AnalysisAfter 22-April, trading volume starts to go up, hard. MELANIAUSDT starts a final descent.
8-July marks the downtrend bottom and once more trading volume goes up, hard. It goes up really high but still, sideways. Not very strong bullish action but at least the downtrend is gone.
Yesterday, 25-August; MELANIAUSDT produces a higher low compared to July, and again my dear friend and reader trading volume starts to go up. Really strong.
We are ready for a new bullish wave.
MELANIAUSDT is moving above EMA8 and EMA34 today on the daily timeframe. This chart setup can lead to some very good results. This is exactly what we like to find on a chart.
The first thing is low prices, the action happening near support. This is a positive here and we have a higher low.
We not only want low prices but we want to see recovery signals, reversal signals and confirmation signals.
» The recovery signal is the higher low. The reversal signal is the move above the moving averages and the confirmation signal is the rising volume. This is a strong combination.
A medium strength bullish wave can hit a target of $1.26 for a nice 487% profits potential. MELANIAUSDT can easily go higher. You can notice on the chart a target at $2.10 for 877%. There is room for more, this is only mid-term. I am showing only a portion of the chart.
Namaste.

$PWEASE will go to the moon$ PWEASE go to the moon.
The daily RSI retested the 50 line, indicating the start of an uptrend after a long period of accumulation with well-defined support. BTC dominance is falling, which is essential for the rise of altcoins.
The political scenario also helps, with JD Vance increasingly in the media spotlight (even appearing on South Park).
At least 100 million is expected.
If Trump slips and falls, we will expect at least 10 billion.
$ PWEASE market cap today: only 4.5 million
Easy Money!

Moo Deng Crypto Meme Coin is dropping as expectedMoo Deng Crypto Meme Coin is dropping as expected. There is still a lot of room for this crypto to keep on dropping with the help of the strong monthly supply imbalance mentioned in a previous update.

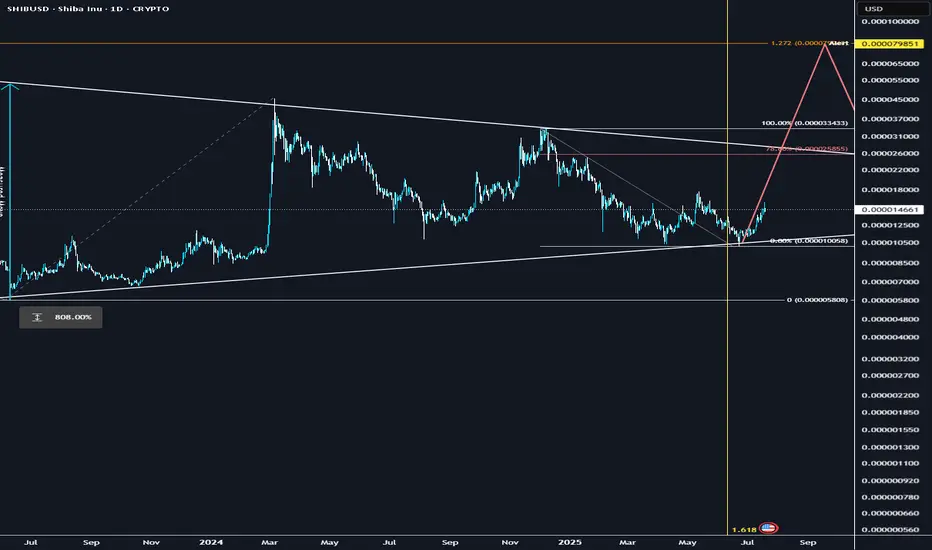
Shiba Inu Trades at Bottom Prices, Can't Go Much LowerShiba Inu (SHIBUSDT) is already trading at bottom prices, this is good news because it means that it can't go much lower. We also know from the bottom we grow.
For example, look back to May 2022 - February 2024. SHIBUSDT was sideways and trading at bottom prices, what happened? This bottom consolidation period led to a strong bullish breakout. Expect the same.
Now in Feb. - August 2025 we have the same market conditions but within a higher low. The same. As SHIBUSDT consolidates at bottom prices, what follows is a wave of growth.
Notice how five weeks of bearish action produced only a tiny 22% retrace. This is quite stable for a Cryptocurrency since this is a very volatile market.
The next positive signal comes from marketwide action. Cardano had a similar chart but started to move forward. Chainlink had the exact same chart but is already moving ahead. The same with many others. That is, the action for SHIBUSDT is happening weekly below EMA55/89 but with the mentioned higher low and consolidation phase. Since the market is one and interconnected, we know Shiba Inu will do the same. Dogecoin is also trading at bottom prices, relatively low. We are only weeks away from a massive bullish run.
Patience is key.
Thanks a lot for your continued support.
Namaste.

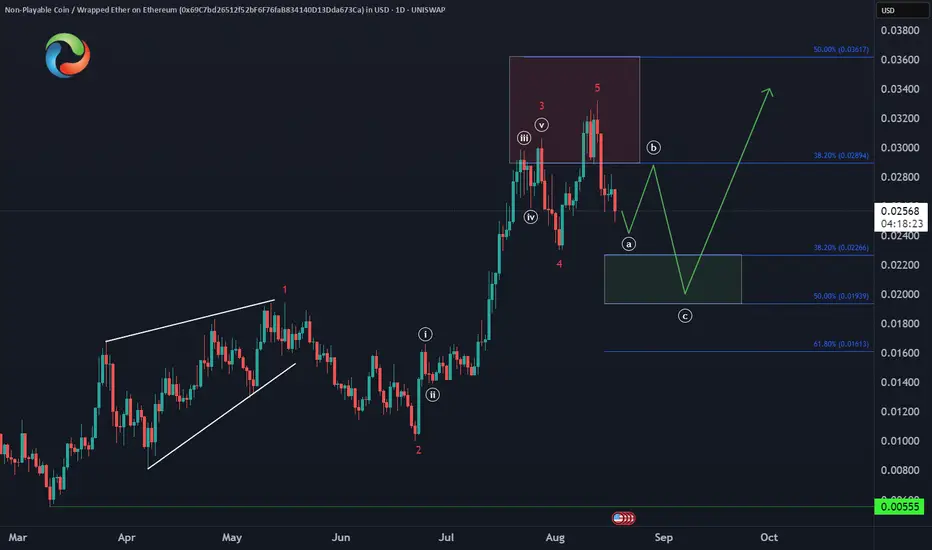
NonPlayableCoin NPC Bullish Setup in PlayBITGET:NPCUSDT has completed a 5-wave advance off the March low, and is now in a 3-wave pullback.
📍 Watch for buyers to step in around the $0.022–$0.019 zone, setting the stage for the next leg higher.
🚀 Structure favors continuation once support holds.
Dogecoin Correction Going According to Plan🐶 CRYPTO:DOGEUSD is unfolding a 3-wave pullback, with the equal legs zone at $0.204–$0.195 acting as the next key support.
📈 A bullish reaction is expected from this area as the structure completes.
Will Dogecoin Hold the August Low at $0.18?
Are you ready to load your bags when it matters most?
🎯 Smart money waits for structure.

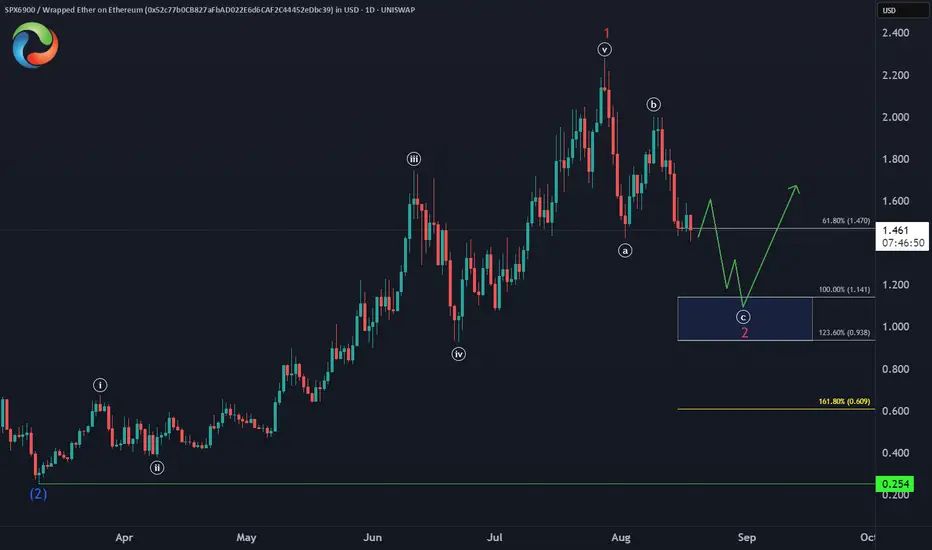
SPX6900 Buying Opportunity🚨 UNISWAP:SPXWETH_52C77B.USD is correcting against the March low within a potential Zigzag structure, eyeing the equal legs zone at $1.14–$0.93 for a bullish setup.
📐 Structure suggests a high-probability bounce from this area.
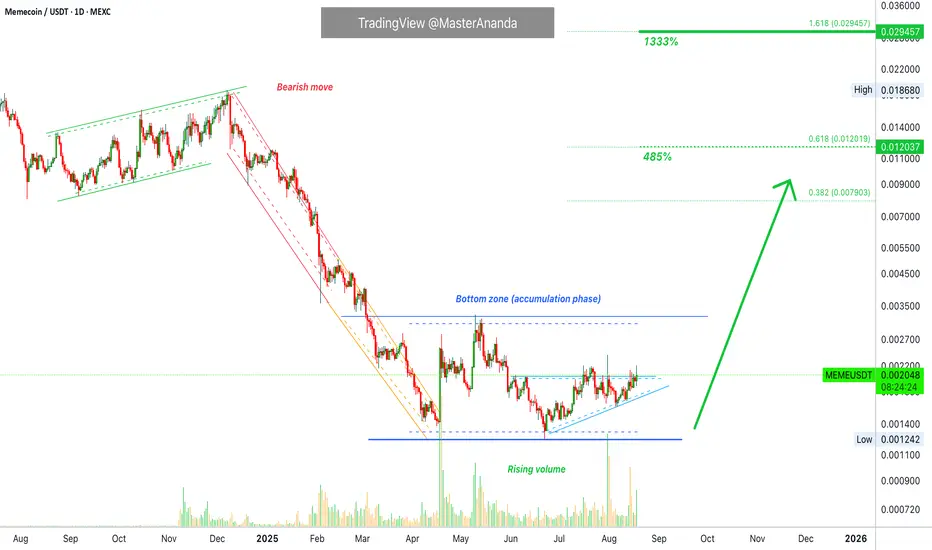
Memecoin Bottom Zone Activated · 1333% Profits PotentialThe bottom zone was activated mid-March and trading volume started to rise immediately...
Memecoin (MEMEUSDT) has been calling my attention recently. I am getting the feeling that this one will produce a strong cycle in the coming months. We have very strong targets as it is usual for memes.
The bottom zone being active is nothing more than good news.
We can appreciate in two ways how the bearish wave is over. (1) No new lows and (2) trading volume. The trading volume signal comes from the fact that the last major low had no bearish volume and bull volume has been rising.
Memecoin also has the same pattern as other pairs that moved ahead. A major low in April followed by a second low in June. This double-bottom sequence marks the end of the Q1-Q2 2025 correction. Thus the start of the next uptrend.
1,333% potential for growth in the coming months. Can be mid-term.
Focus on the goal. Aim high. Long haul.
Namaste.
DOGE Whales Are Back! $500M Buy Triggers Bullish BreakoutDogecoin CRYPTOCAP:DOGE is now again on the rise, thanks to a large increase in accumulation by whales. In the last week, addresses with 100 million to 1 billion DOGE boosted their holdings by 2 billion DOGE (roughly USD 500 million), indicating high confidence among major holders in the meme coin's long-term prospects.
Technical analysis on the monthly period shows that Dogecoin has the potential to maintain its bullish trend as long as the price stays above the lower trendline level around $0.15678. The movement's initial goal is classic resistance at $0.4688, with the possibility of further increases to the all-time high around $1.03 if strong momentum continues.

600 Days of Consolidation — $BONK Finally Wakes UpCRYPTOCAP:BONK has been consolidating inside a wide range for over 600 days. Price recently broke above a short-term downtrend line, showing renewed bullish momentum.
Holding above the mid S/R zone could trigger a move toward the range highs, while a drop back below may send it toward the lower range.
DYOR, NFA

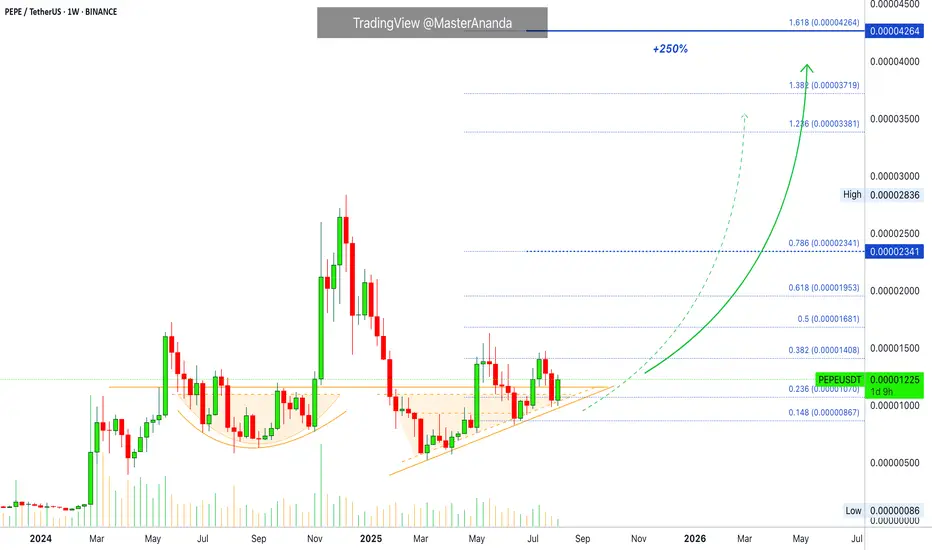
Pepe Update · 5th Dimensional Technical Analysis & Rising PricesThe energy changes. Do we really have to look at a chart?
The market sentiment is so different when the market is trending compared to when the market is sideways. The energy is very different when the market is dropping compared to when it is rising. We can tell what is coming based on how the market feels, but it is a bit paradoxical.
Good feelings, greed and a high level of certainty doesn't necessary means that the market will move in your direction. These are your feelings but not necessarily the market sentiment, how the market is feeling.
The first step then is to learn to distinguish between the market sentiment, how the market and its participants are doing and our own feelings, intuitions, perceptions, ideas, impulses and emotions.
Well, maybe that is too hard. Since it is very hard to learn to be aligned with the market and interpret the correct meaning of the different feelings we get in relation to prices, we can just use a chart.
Pepe produced a rounded bottom followed by a bullish jump. Pepe now again produced a new bottom pattern but this time a rising triangle and has been moving up for months, five months to be exact.
Five months rising but there is no rise. This is a very strong accumulation phase. Accumulation leads to a massive bullish jump. How are you feeling? Are you feeling low or are you feeling great?
The calm before the storm. The market tends to become depressed before a major bullish run. If not in prices, people become depressed in feelings, that is because all of their bearish friends are gone. We suffer because they are getting liquidated but there is light at the end of the tunnel, our profits are going up.
Stay bullish. Choose wisely. Keep reading. Bet LONG.
There is no point in being bearish when the market is going up.
Only now we are preparing for a massive bullish run.
Join the wave and you will profit, have fun and grow. It is very simple, we all buy and hold.
Namaste.
SOLANA's Situation, A Comprehensive Analysis !!!The price on the 3d timeframe is within an ascending triangle, which can be promising. If the price breaks this pattern with bullish candles, it could easily rise by the distance of AB=CD .
Best regards CobraVanguard.💚

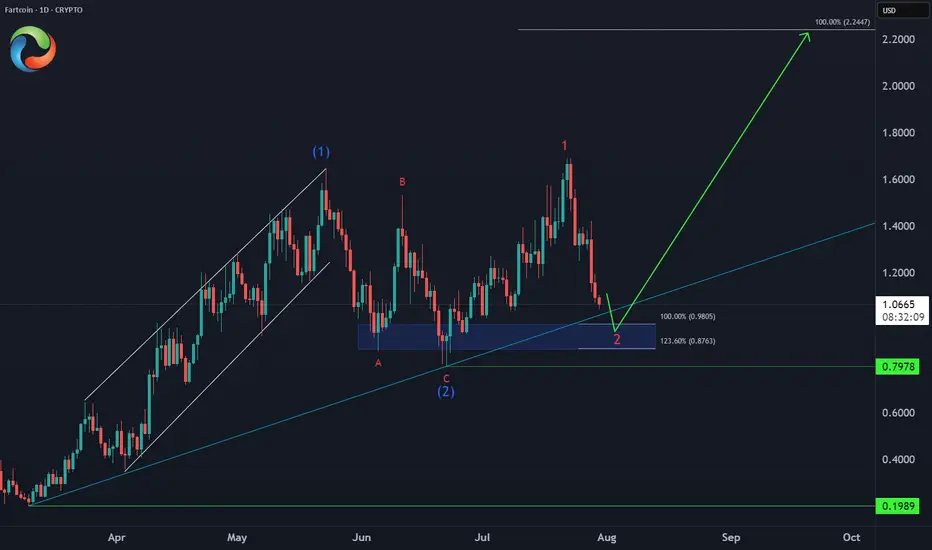
Opening A Small Position In FARTCOIN HereGood Morning Trading Family,
I may be a little early here, but at $1.00, I can't resist. I am picking up a small position in FARTCOIN here. I have three targets above. Each will eventually be hit IMO, but for now, I will only be shooting for TARGET #1. I may sell half at that point and let the rest ride.
Now, here are the technical reasons for making my entry here without waiting for my indicator to signal.
First of all, there are three trendlines, all significant, all converging at this one particular point, making this a powerful area of confluence!
Secondly, we broke to the topside of that descending trendline but never really came back to kiss mamma goodbye. Today we are doing that! This is a patent technical move that indicates healthy price fluctuation and is exactly what I have been waiting for.
Third, the VRVP indicates a ton of volume in this area (mostly buyer), which will be tough to break below without significant FUD, which, of course, is always a possibility.
Finally, all of my lower indicators show this thing is starting to get oversold: RSI, MACD, Chalkin MF, HA.
If we do dip lower, I will simply increase my position unless I hit my SL first. My SL is around .78 with my projected first target at 1.66 for a nice 1:3 rrr.
Good luck, all!
✌️Stew

FARTCOIN Bullish Setup 📈 CRYPTO:FARTCOINUSD Entering an extreme buying area:
✅ Key support zone: $0.98-$0.87 (April trendline + equal legs)
⛔ Invalidation: $0.79
🎯 Target: $2.20 (124% upside)
This is how explosive meme setups look before liftoff.
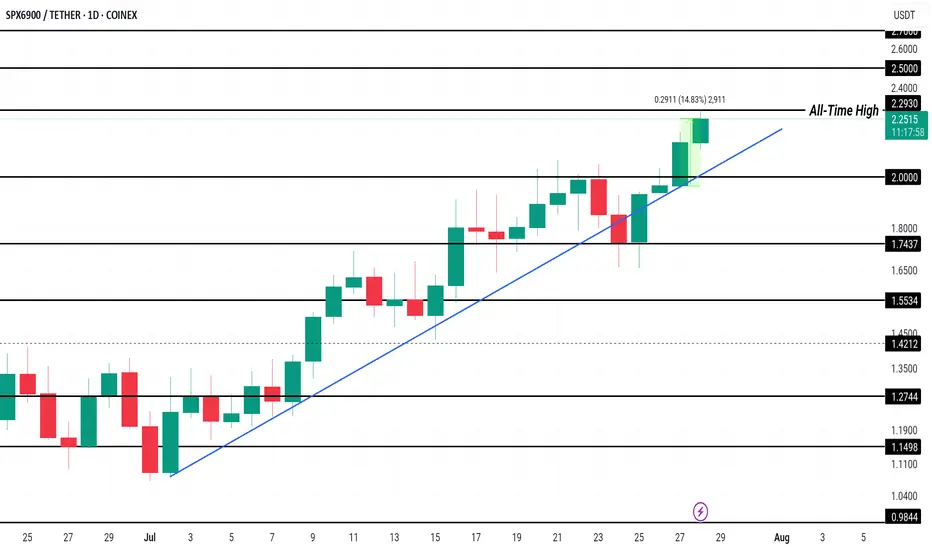
SPX Price Hits New All-Time High, $2.50 Up NextCOINEX:SPXUSDT has been experiencing a consistent uptrend since the beginning of the month, leading to the formation of multiple all-time highs, including one today at $2.27 . This price action reflects strong investor interest, pushing the altcoin to new levels and generating a positive market sentiment.
Currently trading at $2.23, COINEX:SPXUSDT has gained 14% in the past 24 hours . The Ichimoku Cloud, acting as support, signals bullish momentum. This suggests that SPX could rise further, with the potential to reach $2.50 or higher if market conditions remain favorable and investor confidence persists.
However, if selling pressure intensifies, COINEX:SPXUSDT could experience a reversal . A dip below the $2.00 support could push the altcoin toward $1.74 or lower, invalidating the bullish outlook.
From Hype to Hesitation: What’s Next for Pump Fun ($PUMP)?Today, I want to break down the recent developments and fundamentals of Pump fun ( BYBIT:PUMPUSDT ) and its token PUMP — a project that initially launched with strong hype but is now facing serious investor concerns .
What is Pump fun?
Pump fun is a memecoin launchpad that allows users to launch and trade memecoins in a gamified, simplified environment. The idea was to create a frictionless way for anyone to generate and speculate on meme tokens, leveraging viral growth and community culture.
Its native token, PUMP , was introduced via an ICO priced at $0.004, with 12.5% of the total 1 trillion supply offered during the sale.
Latest Updates – Past 24 Hours Recap
PUMP Crashes Over 50% After ICO :
The token initially spiked to $0.0068 on launch day (July 16) , but has now dropped over 50%.
This is roughly 14% below its ICO price , creating concerns for short-term investors.
Founder Confirms No Airdrop Anytime Soon:
In a livestream with ThreadGuy , project founder Alon Cohen confirmed:
“ The airdrop is not going to be taking place in the immediate future. ”
While the team still plans to deliver an airdrop, Alon emphasized it must be well-executed and meaningful, not rushed for hype.
The current focus is on long-term growth and ecosystem sustainability, not short-term incentives.
Mixed Investor Sentiment:
High-profile trader Machi Big Brother ( Jeffrey Huang ) reportedly increased his long position in PUMP — even though he’s down over $5.8M on his position.
Meanwhile, two wallets linked to private sale investors dumped over 1.2B PUMP at $0.003 , taking a combined loss of $1.19M.
Declining Volume and Market Cap:
Trading volume has dropped significantly.
PUMP has lost over 40% of its value in the past 7 days.
Short-term holders appear uncertain, while the project team asks for patience and long-term vision.
Fundamental Outlook:
Pump fun’s future now heavily depends on:
The real utility of the platform as a meme coin incubator.
The team’s ability to regain trust after delaying the airdrop.
Whether new features or hype can revive volume and user engagement.
-------------------------------
Now, let's examine the PUMP token from a technical analysis perspective
From the outset, I must say that due to the small number of candlesticks that create the PUMP token, technical analysis may be a bit difficult , but we will use technical analysis tools to analyze this token.
The PUMP token seems to be moving in a descending channel since the beginning of its correction (over -50%) until now, we need a second price bottom to confirm the descending channel.
I expect the PUMP token to rise from the Potential Reversal Zone(PRZ) and near the Support lines to $0.0029(+15%) . PUMP Token increase can also be from the bottom of the ascending channel .
Second target: the upper line of the ascending channel.
Cumulative Long Liquidation Leverage: $0.002810-$0.002530
Cumulative Short Liquidation Leverage: $0.003498-$0.00327
Note: Stop Loss(SL): $0.002391
Please respect each other's ideas and express them politely if you agree or disagree.
Pump fun Analyze (PUMPUSDT), 1-hour time frame.
Be sure to follow the updated ideas.
Do not forget to put a Stop loss for your positions (For every position you want to open).
Please follow your strategy and updates; this is just my Idea, and I will gladly see your ideas in this post.
Please do not forget the ✅' like '✅ button 🙏😊 & Share it with your friends; thanks, and Trade safe.

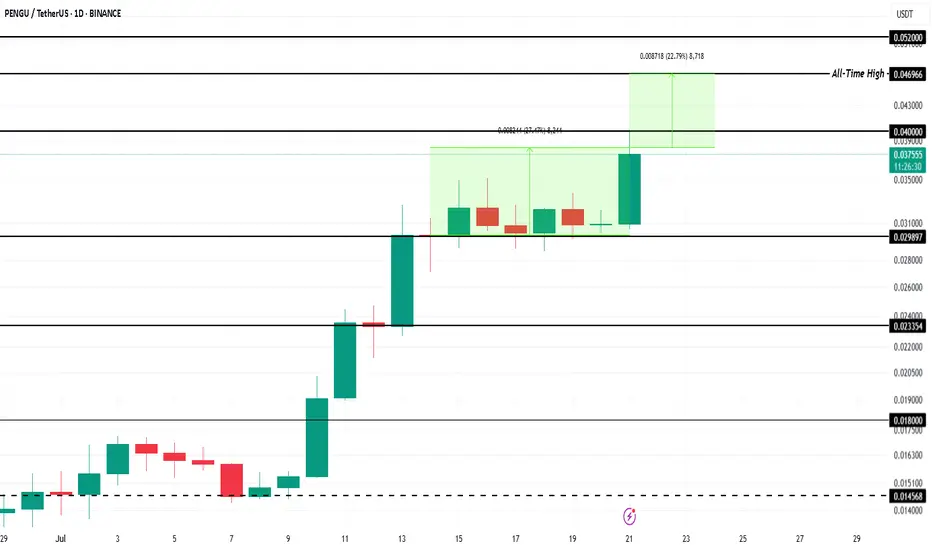
Meme Coin To Watch This Week - Pudgy Penguin (PENGU)BINANCE:PENGUUSDT price has surged 27% in the past week , currently trading at $0.038. The meme coin is inching closer to its all-time high of $0.046 . Strong bullish sentiment and market participation are fueling this rally, signaling that PENGU could soon retest resistance levels if momentum remains intact.
The meme coin is now just 22% away from hitting its record high . A Golden Cross pattern formed last week adds to the bullish outlook. If BINANCE:PENGUUSDT successfully flips $0.040 into a stable support level, the rally could continue, pushing the altcoin higher toward reclaiming its historical peak.
However, downside risks remain. If investors begin booking profits, selling pressure could drag BINANCE:PENGUUSDT lower . The critical support level of $0.029 will come into play. Losing this support could halt the upward trend and invalidate the optimistic price projection in the near term.
SHIB could explode soon.Multi year accumulation, crossing a significant fib-time pivot, similar set up to XRP.. could follow DOGE once it takes the lead as a catch up trade and rip..
Technical breakout: Above 200-day MA + golden cross formation
Volume surge: Social + trading volume spiking, driving demand
Ecosystem catalysts: Shibarium L2, metaverse progress, aggressive token burns cutting supply
Macro tailwinds: ETH rally + broad altcoin strength
I think it could be one of the leaders before capital rotates into the lower caps
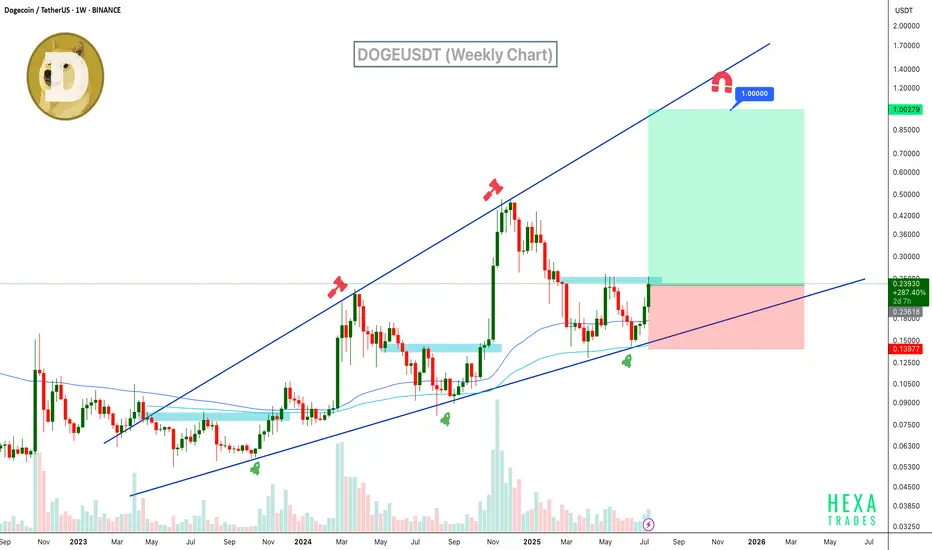
Will DOGE Hit $1? Ascending Broadening Wedge in PlayDogecoin is trading within a clear ascending broadening wedge on the weekly chart. The price has bounced strongly from wedge support and the 100 and 200 EMAs, now pushing upward with growing volume and bullish candles. If momentum sustains, DOGE could rally toward the $1 psychological target and broadening wedge resistance.
Resistance 1: $0.35
Resistance 2: $0.60
Resistance 3: $1.00
Stop Loss: $0.14
Cheers
Hexa
COINBASE:DOGEUSD BINANCE:DOGEUSDT
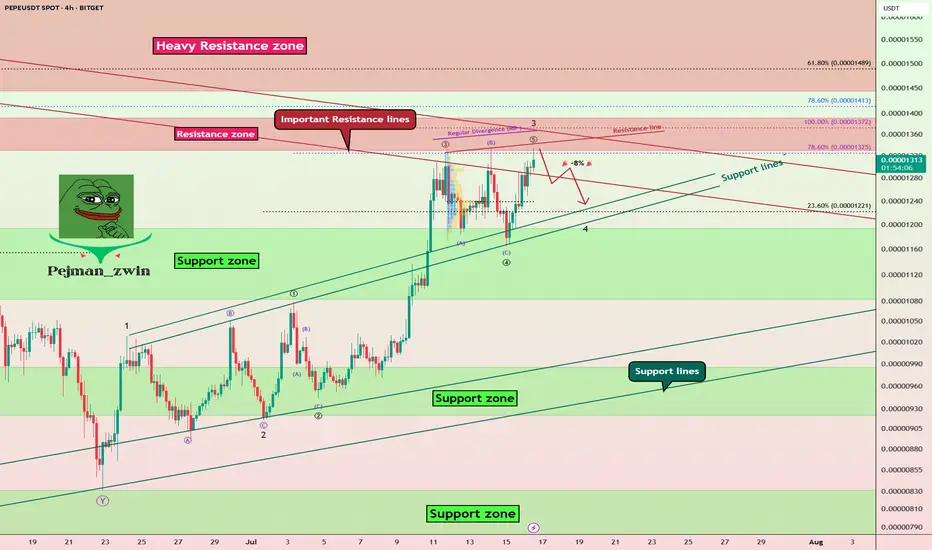
PEPE Faces Key Resistances – Is a -8% Pullback Coming?The PEPE memecoin ( BINANCE:PEPEUSDT ) is currently near the Resistance zone($0.00001392-$0.00001330) and Important Resistance lines . This is the third time that PEPE has attacked the Important Resistance lines .
In terms of Elliott wave theory , it seems that PEPE is completing the microwave 5 of the main wave 3 , so that the main wave 3 is of the extended type .
Also, we can see the Regular Divergence(RD-) between Consecutive Peaks.
I expect a -8% drop for PEPE in the coming hours.
First Target: $0.00001251
Second Target: $0.00001212
Note: Stop Loss(SL)= $0.00001400
Please respect each other's ideas and express them politely if you agree or disagree.
PEPE Analyze (PEPEUSDT), 4-hour time frame.
Be sure to follow the updated ideas.
Do not forget to put a Stop loss for your positions (For every position you want to open).
Please follow your strategy and updates; this is just my Idea, and I will gladly see your ideas in this post.
Please do not forget the ✅' like '✅ button 🙏😊 & Share it with your friends; thanks, and Trade safe.