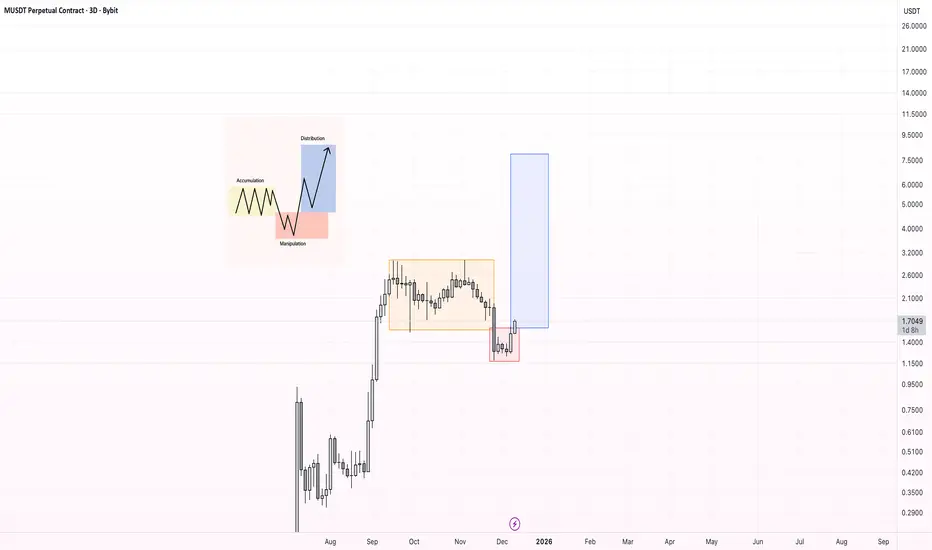
Memecore - AMD Structure | Manipulation, Distribution📊 Market Structure Overview
Memecore is currently respecting a classic AMD (Accumulation → Manipulation → Distribution) structure on the higher timeframe.
🔹 Accumulation
After the impulsive move up, price entered a prolonged range. During this phase, smart money was accumulating positions while retail participation faded and volatility compressed.
🔹 Manipulation (Liquidity Sweep)
Price then performed a clean downside sweep, breaking below the range and triggering:
Stop-losses of late longs
Panic selling
Aggressive short entries on the breakdown
This move effectively reset market positioning, allowing large players to accumulate at discount prices.
🔹 Distribution / Markup
Price quickly reclaimed the range and is now holding above the manipulation low — a strong sign that the breakdown was false.
With ~90% of MEME supply concentrated in a few wallets, upside moves can be fast and violent due to thin liquidity above.
This sets the stage for a strong distribution phase to the upside.
🎯 Price Targets
$2.50 — First expansion target
$5.00 — Mid-term distribution level
$7.00 — Full distribution / macro target
⚠️ Invalidation
A sustained breakdown and close below the manipulation low would invalidate the bullish scenario.
📌 Conclusion
This setup reflects classic Smart Money behavior:
Accumulation → Liquidity grab → Expansion into low-liquidity zones.
As long as price holds structure, higher prices remain the primary scenario.
Memecore
MEMECOREUSD - Buy the Double BottomThis coin will likely hit the upper white line and double bottom as it did on the prior or lower white line
Double bottoms are considered bullish
This is the Hourly timeframe so a small timeframe
Another move up when the double bottom is triggered

MEMECORE Could Break Back Above Support? – Eyes on 0.56 Target📊🔥 MEMECORE Could Break Back Above Support? – Eyes on 0.56 Target 💥🟢
I’ve been trading (went short nicely, thank you) in on $MEMCOR lately — and it’s been paying off. After charting these Fibonacci levels few days ago, we’ve seen price action respect them beautifully. Today’s move back above the key support zone around 0.455 signals strength, especially after a clean bounce and a shift in momentum on the 15-minute chart. 🧠📈
I’m currently in a long position with my stop loss tight at 0.44 — not risking the house here. The chart is offering a possible relief move into the 0.56 zone, which aligns perfectly with one of the higher fib retracement levels and prior structural resistance.
🟢 Trade Plan:
Entry: Long now, shorts closed
Stop Loss: 0.44
Target: 0.56
Risk-Reward: Smart & balanced — letting the fibs guide the way.
The sharp selloff seems to be losing steam, and if bulls can hold above this golden zone, the bounce could be solid. Watching for follow-through volume to confirm the setup. Let’s see how this plays out. 🔍🚀
One Love,
The FXPROFESSOR 💙
Disclosure: I am happy to be part of the Trade Nation's Influencer program and receive a monthly fee for using their TradingView charts in my analysis. Awesome broker, where the trader really comes first! 🌟🤝📈
