#MEME/USDT is Bullish#MEME
The price is moving in a descending channel on the 1-hour timeframe. It has reached the lower boundary and is heading towards breaking above it, with a retest of the upper boundary expected.
We have a downtrend on the RSI indicator, which has reached near the lower boundary, and an upward rebound is expected.
There is a key support zone in green at 0.001144. The price has bounced from this zone multiple times and is expected to bounce again.
We have a trend towards consolidation above the 100-period moving average, as we are moving close to it, which supports the upward movement.
Entry price: 0.001172
First target: 0.001194
Second target: 0.001229
Third target: 0.001271
Don't forget a simple point: money management.
Place your stop-loss below the support zone in green.
For any questions, please leave a comment.
Thank you.
Memeusdtsignal

MEMEUSDT — The Bull Last Stand: Accumulation or Total Surrender?📉 Overview
MEME/USDT is standing on the edge — between a massive accumulation opportunity and complete market capitulation.
The price is now sitting right above the major support zone (0.0012 – 0.00165 USDT), a key defensive area that has been tested multiple times since April 2025.
Each visit to this zone has triggered liquidity absorption and stop hunts, followed by short-lived recoveries — but never a sustained reversal.
Now, once again, the market is testing this zone for survival.
---
🧩 Price Structure & Technical Context
Primary trend: Long-term downtrend since late 2024, forming consistent lower highs and lower lows.
Dominant pattern: Potential accumulation base following a liquidity sweep — a classic signal of possible smart-money accumulation.
Recent wick reaction: Sharp downward wick that was quickly absorbed — often a sign of institutional defense or smart buyer entry.
Highlighted zone: This yellow box is more than just support — it’s the psychological boundary between recovery and collapse.
---
📈 Bullish Scenario — “Rebirth from the Bottom”
If the price manages to close above 0.0017 and successfully flip this zone into support, it may trigger the beginning of a structural reversal phase.
Potential targets:
Target 1: 0.002167 → first resistance / short-term profit zone.
Target 2: 0.002914 → key validation level for continuation.
Target 3: 0.004117 → structural confirmation of trend reversal.
Key confirmation:
A 2D candle close above the box, followed by a clean retest and sustained momentum.
If volume expands, a mid-term rally could unfold.
Technical narrative:
This setup could evolve into a textbook case of “liquidity sweep followed by a reversal.”
If confirmed, it might mark the start of a major accumulation cycle ahead of the next hype phase.
---
📉 Bearish Scenario — “The Final Floor Breaks”
If the price fails to hold above 0.0012, the next meaningful support lies near 0.000836, the previous low.
A confirmed breakdown below this zone would imply:
The end of the accumulation phase,
Entry into full capitulation,
And a likely panic-driven selloff as retail stop-losses are triggered en masse.
Bearish confirmation: 2D candle close below the support zone with a strong follow-through.
If that happens, bulls are temporarily out of the game until a new structure forms at lower levels.
---
🎯 Summary
This yellow zone is not just another support area — it’s the psychological battlefield where smart money decides the next chapter.
The market is now in a quiet tension before the storm:
Either we witness a legendary rebound from deep accumulation,
Or the final breakdown of a fading trend.
For disciplined traders, this is not the time to guess — this is the time to prepare for both outcomes with precision and patience.
---
⚙️ Risk Management Strategy
Only enter after clear confirmation (2D close + retest).
Risk per trade: 1–3% of total capital.
Take partial profits at each target.
Move stop-loss to breakeven once Target 1 is reached.
---
🧭 Additional Notes
Mid-term bias remains bearish, but early signs of re-accumulation are emerging.
This isn’t just another random bottom — it’s a strategic battlefield between smart buyers and aggressive sellers.
---
#MEME #MEMEUSDT #AltcoinAnalysis #CryptoReversal #LiquiditySweep #SupportZone #BreakoutWatch #CryptoTechnicalAnalysis #SwingTrading #SmartMoneyConcepts #MarketStructure

#MEME/USDT#MEME
The price is moving within a descending channel on the 1-hour frame and is expected to break and continue upward.
We have a trend to stabilize above the 100 moving average once again.
We have a downtrend on the RSI indicator that supports the upward break.
We have a support area at the lower boundary of the channel at 0.002644, acting as strong support from which the price can rebound.
We have a major support area in green that pushed the price upward at 0.002447.
Entry price: 0.02929.
First target: 0.003232.
Second target: 0.003604.
Third target: 0.004113.
To manage risk, don't forget stop loss and capital management.
When you reach the first target, save some profits and then change the stop order to an entry order.
For inquiries, please comment.
Thank you.

#MEME/USDT#MEME
The price is moving in a descending channel on the 1-hour frame and is adhering to it well and is heading to break it strongly upwards and retest it
We have a bounce from the lower limit of the descending channel, this support is at a price of 0.00284
We have a downtrend on the RSI indicator that is about to break and retest, which supports the rise
We have a trend to stabilize above the moving average 100
Entry price 0.00309
First target 0.00334
Second target 0.00355
Third target 0.00381

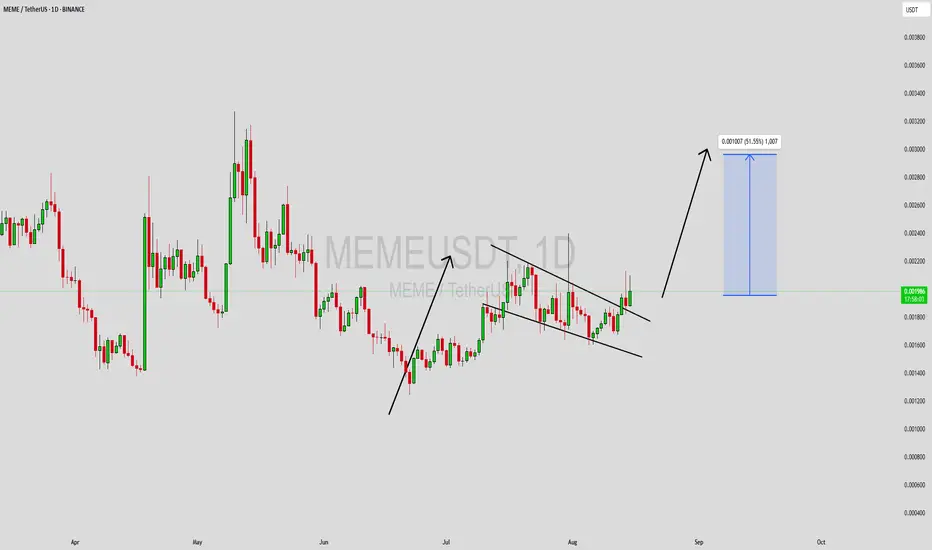
MEMEUSDT UPDATE#MEME
UPDATE
MEME Technical Setup
Pattern: Symmetrical Triangle Breakout
Current Price: $0.001925
Target Price: $0.00373
Target % Gain: 90.15%
Technical Analysis: MEME is breaking out of a symmetrical triangle on the 1D chart, signaling strong bullish momentum. Price has held higher lows and is pushing above trendline resistance, with volume supporting the move. A sustained breakout above $0.002 confirms continuation toward the $0.0037 target.
Time Frame: 1D
Risk Management Tip: Always use proper risk management.

MEMEUSDT Forming Falling ChannelMEMEUSDT has recently broken out from a falling channel pattern, a structure that typically signals a bullish continuation. This breakout is backed by rising trading volume, which further validates the strength behind the move. As the price pushes above the channel resistance, the projected upside suggests a potential gain of 40% to 50%+, making it a coin of interest for short-term traders looking for high-probability setups. The price action also reflects growing buyer confidence, with consecutive higher lows forming a strong technical base for further momentum.
The chart structure highlights MEME's ability to hold key support levels even during minor pullbacks, suggesting that accumulation has been ongoing during the consolidation phase. The pattern of previous impulsive upward movements, followed by controlled corrections, fits the classic framework of bullish price cycles. If MEME continues to trade above the breakout level, a rally towards the 0.0030 USDT zone becomes increasingly likely.
Investor sentiment around MEME is shifting positively, as reflected in social metrics and increased spot trading activity. This interest isn't just retail hype—it's also attracting strategic participants positioning for potential
✅ Show your support by hitting the like button and
✅ Leaving a comment below! (What is You opinion about this Coin)
Your feedback and engagement keep me inspired to share more insightful market analysis with you!
Trend Reversal Confirmed? MEME/USDT Bulls Take ControlThe MEME/USDT chart is showing a highly compelling technical setup. Here are the key points of the analysis:
1. Breakout from Long-Term Downtrend:
Price has successfully broken above a descending trendline that has been in place since November 2024. This breakout marks a potential end to the prolonged bearish phase and opens the door for a new bullish trend.
2. Strong Accumulation Zone:
A clear accumulation zone is visible between $0.00130 – $0.00160, lasting from May through late June 2025. This zone now serves as a strong support area.
3. Formation of Higher Lows:
After the breakout, price action has begun to form higher lows — a bullish signal indicating that buyers are stepping in.
4. Potential Upside Targets (Key Resistance Levels):
The chart outlines several key resistance levels that may serve as short- to mid-term targets:
$0.001996
$0.002608
$0.003074
$0.003987
$0.004764
$0.007136
$0.010259
$0.017863
$0.018690 (previous high)
5. Bullish Scenario:
If bullish momentum continues with strong volume, price could follow the projected upward zigzag pattern and move through these resistance levels progressively.
6. Risk Management Note:
A breakdown below the accumulation zone ($0.00130) would invalidate the bullish scenario and should be watched closely.
✅ Conclusion:
MEME/USDT is displaying strong reversal signals after breaking out of a long-term downtrend and consolidating in a solid accumulation range. If buyer momentum continues, we could see significant upward moves toward key resistance zones.
#MEME #MEMEUSDT #CryptoBreakout #AltcoinAnalysis #BullishReversal #TrendlineBreakout #CryptoTrading #TechnicalAnalysis #AltcoinSeason #ChartPattern #CryptoSignals

MEMEUSDT 1D AnalysisMEME ~ 1D Analysis
#MEME Buy back gradually from here if you still have confidence in this coin with a short term target of at least 15%+ from here.

MEMEUSDT 1D AnalysisMEME ~ 1D Analysis
#MEME Buy on retest of this support block with short term target of at least 15%+ from here.

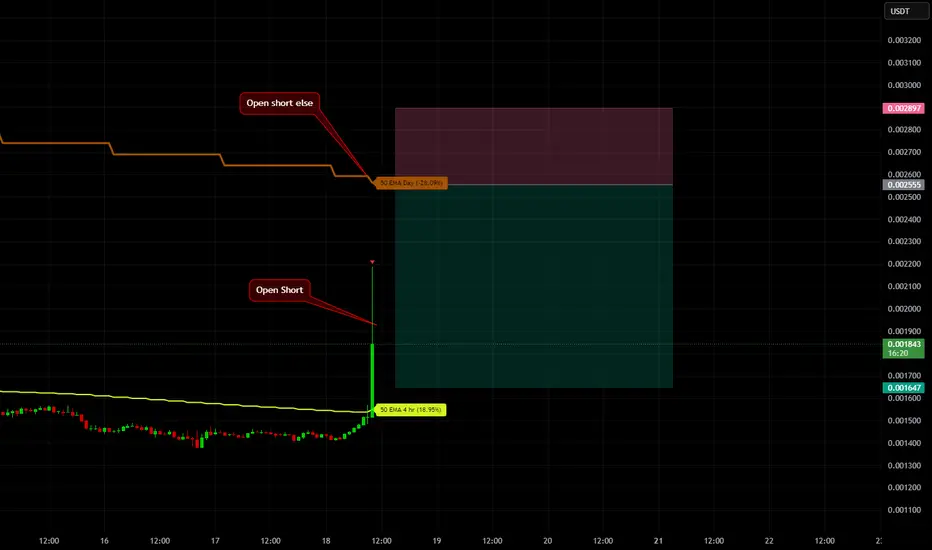
MEMEUSDT ShortMEMEUSDT had a strong breakout from the 4H EMA50 — up 23%! This setup is perfect for a short without a stop, using scaling in.
There’s a chance price might reach the daily EMA50 — if it does, I’ll add more to the short from there. The target will be adjusted based on how the 4H EMA50 moves.
MEMEUSDT 4DMEME ~ 4D
#MEME This trade is high risk. But if you still have Conviction on this coin,. This is a very good support block for now,. Buy in stages with a minimum target of 20%++

MEME target 0.01314h time frame
-
Entry: $0.0097
TP: $0.0131
SL: $0.00885
RR: 4
-
(1) Double bottom is creating
(2) Bullish engulfing triggered reversal on 1h time frame
(3) For bottom structure like this, fib projection 2.0 is the general target around $0.0124
(4) Considering the ongoing big consolidation structure, set target higher at $0.0131
(5) Stop loss once going below $0.00885

MEMEUSDTMEME ~ 2D ✅
#MEME If you ask when this coin will stop falling,. The answer is, When this descending channel is successfully broken,. So wait for this pattern to be successfully broken, to make a purchase.

MEMEUSD 1DAMEX:MEME ~ 1D
#MEME Make purchases gradually from here. with a ratio of -21% / +375%.
This is the Bottom zone on this chart. it's time to start accumulation from here for the long term.

MEMEUSD 1DMEME ~ Updated
#MEME What a perfect chart. Don't tell me you missed a trade here. it was only a matter of time until the pump came.

MEMEUSD 1DMEME ~ 1D
#MEME Make purchases gradually after breaking through the resistance line of this pattern, or buy if the price returns to the demand zone if possible.
Minimum target 20%+

MEME/USDT It looks promising movement if success break supply!💎 Paradisers, #MEME is indeed displaying promising movements that warrant close attention.
💎 Currently, MEME is encountering a supply area ranging from 0.0313 to 0.0327. In the previous attempt to break above this supply zone, MEME experienced rejection.
💎 If MEME faces rejection again at this supply zone, there's a potential for the price to test the demand area around 0.026. This retracement to the demand area could serve as an opportunity for MEME to gather momentum for another attempt to break out above the supply area.
💎 However, if MEME manages to break above the supply area without a retracement to the demand zone, it could signal significant upward movement, potentially leading to the attainment of our target area.
💎 On the other hand, if MEME fails to bounce off the demand area and even breaks below it, there's a possibility of further downward movement, revisiting the key support area.
💎 Historical data suggests that MEME has bounced when reaching this zone in the past, and a similar scenario might occur if MEME revisits the key support.
💎 Nevertheless, it's essential to closely monitor MEME's price action and its ability to hold above critical support and resistance levels. A breakdown below the support zone, confirmed by a daily candle close below it, would indicate bearish momentum, potentially leading to further downward movement.
MyCryptoParadise
iFeel the success🌴
