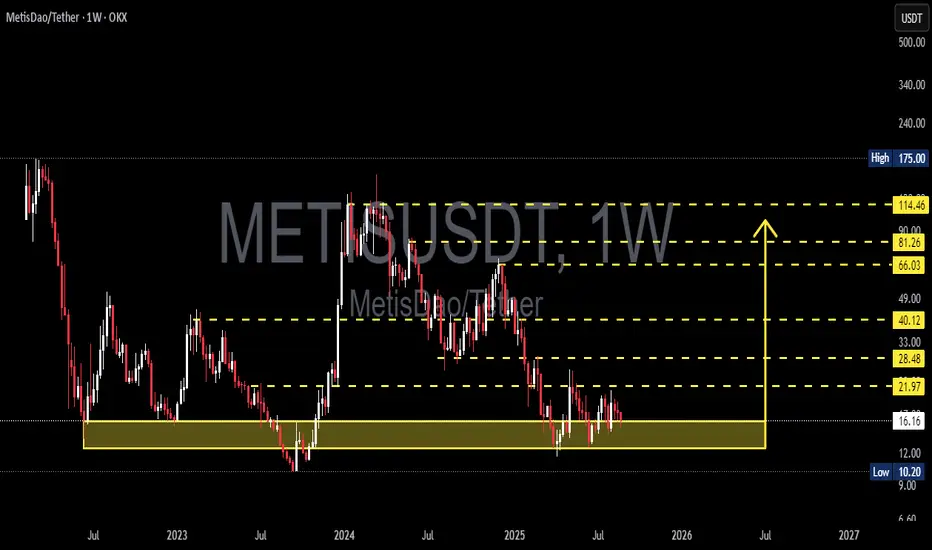
METIS/USDT — Major Accumulation or Breakdown Ahead?Currently, METIS/USDT is trading inside a very crucial demand zone at $10.20 – $16.16 (highlighted in yellow). This area has acted as strong support multiple times since 2022–2025, preventing deeper sell-offs. In other words, this is the last line of defense for buyers and a potential accumulation zone before a major move.
---
🔎 Technical Structure & Pattern
Macro trend: Since the 2024 peak, METIS has been forming a series of lower highs, signaling that the medium-term downtrend is still intact.
Key zone: The $10–16 range is a historical demand zone where buyers have consistently stepped in. Holding above this area increases the probability of a trend reversal.
Current formation: Price action shows a sideways movement within this demand zone → often referred to as a base-building phase or accumulation phase. Historically, such phases are followed by explosive moves either upward or downward.
---
🚀 Bullish Scenarios
1. Rebound from demand zone
If METIS holds above $10.20–$16.16 and prints a strong bullish weekly candle, a rally could begin.
Short-term upside targets: $21.97 → $28.48 → $40.12 (weekly resistances).
2. Medium-term reversal
A true reversal becomes more likely once price breaks and closes weekly above $40.12.
If confirmed, higher targets could unfold: $66.03 → $81.26 → $114.46.
This would mark the transition from lower highs to higher highs — a signal of a new bullish cycle.
---
🔻 Bearish Scenarios
1. Breakdown of demand zone
If price fails to hold and weekly closes below $10.20, the structure breaks down.
This opens the door for deeper declines, potentially towards $7–8 psychological levels.
2. False rally / rejection
If price rallies to $21–28 but gets rejected with strong bearish weekly candles, it would suggest weak buyers.
In that case, price could revisit the demand zone, keeping the downtrend intact.
---
🎯 Key Takeaways
The $10–16 zone is the most critical area on this chart → both a last defense for bulls and a potential golden accumulation zone for long-term positions (with strict risk management).
Bullish confirmation: A weekly close above $21.97 – $40.12.
Bearish confirmation: A weekly close below $10.20 → signaling a full breakdown.
---
📌 Important Note
Trading around such critical zones requires patience and confirmation. Avoid chasing moves blindly — wait for weekly candle confirmations (breakouts or breakdowns). Remember: accumulation phases can last longer than expected before a big move unfolds.
#METIS #METISUSDT #CryptoAnalysis #Altcoin #TechnicalAnalysis #PriceAction #SupportResistance #SwingTrading #CryptoMarket
METISUSD
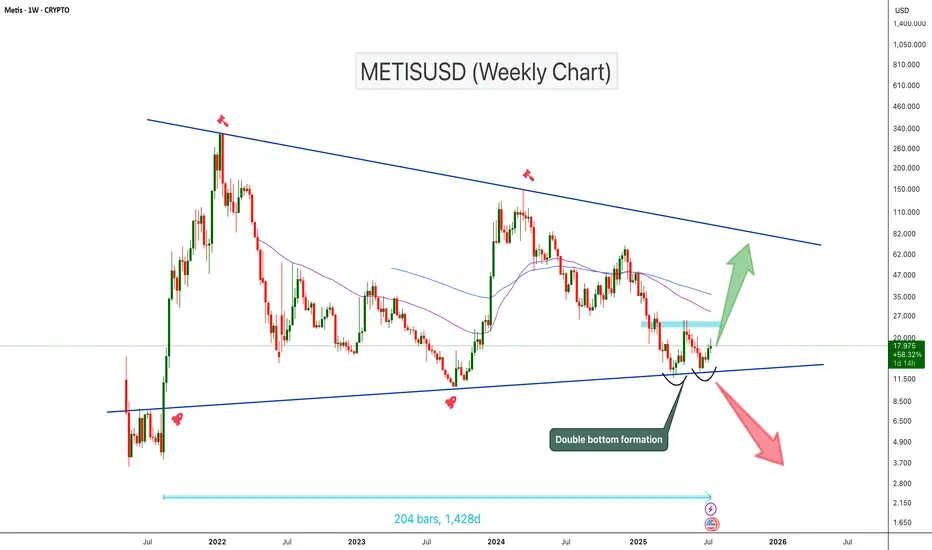
METISUSD Double Bottom at Triangle Support!METISUSD has been trading inside a symmetrical triangle for the past 1,400 days. The price is currently sitting at the triangle support and forming a potential double bottom pattern. The double bottom can be confirmed once the price breaks the neckline resistance zone. If the price breaks this key resistance zone, we could expect a 100%–250% bullish move toward the triangle’s upper resistance
Cheers
Hexa🧘♀️
BINANCE:METISUSDT SEED_DONKEYDAN_MARKET_CAP:METIS
METISUSDT 1W AnalysisMETIS ~ 1W Analysis
#METIS Buy back gradually from here if you still have confidence in this coin with a short term target of at least 20%+ from here.

#METIS/USDT#METIS
The price is moving within a descending channel on the 1-hour frame, adhering well to it, and is heading for a strong breakout and retest.
We are seeing a bounce from the lower boundary of the descending channel, this support at 14.73.
We have a downtrend on the RSI indicator that is about to be broken and retested, supporting the upward trend.
We are looking for stability above the 100 moving average.
Entry price: 18
First target: 19.78
Second target: 22
Third target: 25

METISUSDT 1WMETIS ~ 1W Analysis
#METIS Buy gradually from here with a short -term target of at least 20%+. This is the lowest support for now.

METIS Rebuy Setup (2D)The METIS token, after experiencing significant drops, is approaching a strong support level.
We are looking for buy/long positions within the green zone.
A daily candle closing below the invalidation level will invalidate this analysis.
Do not enter the position without capital management and stop setting
Comment if you have any questions
thank you

METISUSDT 4DMETIS ~ 4D
#METIS So far it still maintains this support block,. If you still have Conviction on this coin,. Buy from here with a minimum target of 20%+

METIS is a racket (3D)METIS now seems to be in wave c of C, which is a bullish wave.
The targets of this wave based on the big wave A and wave a of C can be very attractive.
The time frame is 3 days, which means that this analysis needs time to be realized.
The green area is our BUY area.
Closing a daily candle below the invalidation level will violate this analysis
invalidation level: 28.08$
For risk management, please don't forget stop loss and capital management
Comment if you have any questions
Thank You

METISUSDT Breaks Out of Descending Channel: Bullish Rally ExpectMETISUSDT technical analysis update
METIS has broken the descending channel resistance line on the daily chart and is now preparing to break the previous higher low. If the price successfully breaks the previous higher low, we can expect a strong bullish move. Additionally, the price is about to cross above the 100 EMA on the daily chart.
Regards,
Hexa

METISUSDTMETIS ~ 5D ✅
#METIS Make purchases gradually after successfully breaking through this descending pattern.

METIS || Targets and PathsEverything you have to know about Metis is plotted on this chart.
We are still developing an AI Smart ( All in One ) indicator that will expertise your chart cleanly and effectively.

METISUSD 1WMATIS ~ 1W
#METIS We see price will Retest this Support Block, we will place a small buy here. with a long-term target of at least 25%.

METIS || Targets and Paths || UpdateThe price path is going as we predicted in the previous idea,
Now, these are the updated targets and paths.
We are still developing an AI Smart ( All in One ) indicator that will expertise your chart cleanly and effectively.

METIS is Very BullishIt looks like we have an ABC on the chart. Wave B has just ended and we are now entering Wave C. We are at the beginning of wave C.
Wave B looks like a triangle.
We have identified two short-term targets for METIS.
Closing a daily candle below the invalidation level will violate the analysis.
For risk management, please don't forget stop loss and capital management
When we reach the first target, save some profit and then change the stop to entry
Comment if you have any questions
Thank You

METIS Can get back to $100 Wyckoff Accumulation pattern
appears to have formed
after the Spring ... it theoretically should have a strong move breaking previous resistance ... where it should stall
Before gathering new energy for the move to the key number of $100

METIS Surges After Announcement of Ecosystem Development Fund
The Ethereum Layer 2 scaling protocol Metis has dedicated 4.6 million $METIS tokens toward the new Metis Ecosystem Development Fund. The Fund will begin disbursing grants in the first quarter of 2024.
The Metis Ecosystem Development Fund was allotted 4.6 million METIS, worth over $100 million, that will be used to fund grants for dApps, sequencer mining and other product development projects, the protocol said in a statement. Metis will begin giving out funding starting in the first quarter of 2024.
Metis aims to be the first fully decentralized Ethereum Layer 2 by the end of 2023.
