MEWU/USDT — Symmetrical Triangle: A Major Breakout is Coming?📝 Summary
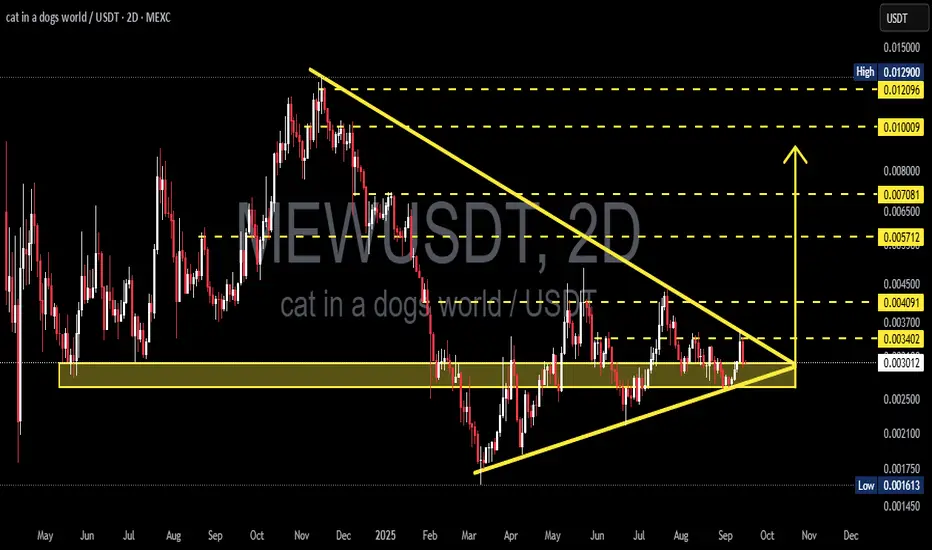
The MEWU/USDT pair is currently consolidating after a strong downtrend since early 2025. Price has been compressing into a symmetrical triangle pattern, trapped between a horizontal support zone at 0.0027–0.0033 and a descending resistance trendline.
The structure is now very close to its apex → meaning a major breakout (up or down) is imminent. The next move will likely set the medium- to long-term direction of this token.
---
🔎 Pattern & Market Structure
Main pattern: Symmetrical Triangle — formed by higher lows and lower highs.
Market context: Appears after a steep downtrend. Symmetrical triangles are technically neutral, but the initial bias leans slightly bearish until proven otherwise.
Accumulation zone: 0.0027–0.0033 has acted as a key battleground between buyers and sellers.
Key levels:
Supports: 0.0027 → 0.0021 → 0.00175 → 0.001613 (major low)
Resistances: 0.003402 → 0.004091 → 0.005712 → 0.007081 → 0.010009 → 0.012096
---
🚀 Bullish Scenario (If Breakout Upward)
1. Confirmation: A 2D close above 0.0034–0.0035 with strong volume.
2. Healthy retest: Price retests 0.0034–0.0030 as new support. If it holds → bullish confirmation.
3. Targets:
🎯 TP1: 0.00409 (+35%)
🎯 TP2: 0.00571 (+89%)
🎯 TP3: 0.00708
🎯 Extended target: 0.0100 – 0.0120 (if momentum/FOMO enters).
4. Risk management: Stop loss below 0.0027; aim for R:R ≥ 1:2.
> An upside breakout would signal a major trend reversal after months of consolidation. The move could be explosive.
---
🐻 Bearish Scenario (If Breakdown Downward)
1. Confirmation: A 2D close below 0.0027 with heavy selling volume.
2. Failed retest: Price retests 0.0027–0.0029 from below and gets rejected → bearish continuation.
3. Targets:
🎯 TP1: 0.0025
🎯 TP2: 0.0021
🎯 TP3: 0.00175
🎯 TP4: 0.00161 (major historical support).
4. Risk management: Stop loss above 0.0034 if shorting.
> A downside break would confirm trend continuation, exposing MEWU to another 30–50% decline.
---
📌 Key Notes
The longer the triangle compresses, the stronger the breakout tends to be.
Volume is the key indicator → no volume = high risk of false breakout.
On the 2D timeframe, any breakout can drive a trend lasting weeks to months.
Expect high volatility due to relatively low liquidity in smaller tokens.
---
📢 Conclusion
MEWU/USDT is at a critical crossroads. The symmetrical triangle formed since March is nearing its apex, and a directional breakout is imminent.
Breakout upward → potential rally of +100% toward 0.0057–0.0070.
Breakdown downward → risk of a 30–50% drop toward 0.0016.
📌 Best approach: wait for confirmation (close + volume + retest) before entering. Patience here can prevent being trapped in a false move.
---
#MEWU #MEWUUSDT #CryptoAnalysis #Breakout #TrianglePattern #Altcoin #TechnicalAnalysis #BullishScenario #BearishScenario
Mewanalysis
MEW/USDT Retesting Key Zone, Ready for the Next Move?📊 Technical Analysis:
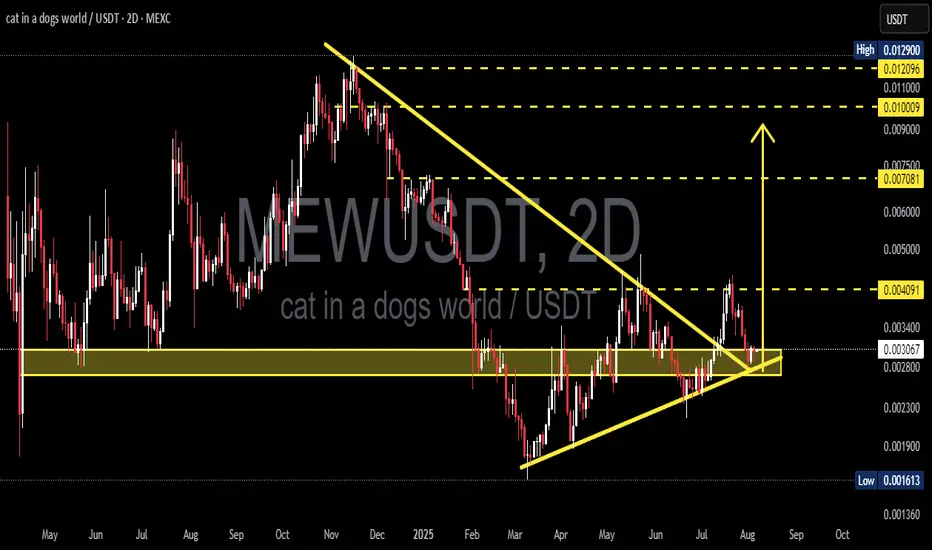
MEW/USDT on the 2D timeframe shows a compelling structure with a Symmetrical Triangle pattern breakout that occurred in late July 2025. This breakout indicates a potential trend reversal from bearish to bullish.
Currently, the price is performing a retest of the breakout level while sitting within a strong support zone between 0.00280 – 0.00310 USDT (highlighted in yellow). This area previously acted as accumulation and now serves as a key support.
---
📈 Bullish Scenario:
Price holds and bounces from the 0.00280 – 0.00310 zone, forming a new higher low.
Potential upside targets include:
0.004091 (minor resistance)
0.007081
0.010009
And extended targets at 0.012096 – 0.012900 if bullish momentum continues.
Bullish confirmation strengthens if price reclaims above 0.004091 with strong volume.
---
📉 Bearish Scenario:
If the price fails to hold the 0.00280 support and breaks below the ascending trendline (rising yellow line), then:
It may revisit the next support zone at 0.002300
Possibly retest the historical low at 0.001613
Bearish case invalidated if price pushes back above 0.0040 with a strong bullish candle.
---
📐 Pattern & Structure:
Symmetrical Triangle Breakout: Signals a consolidation phase that resolved to the upside.
Breakout Retest: Price is now retesting the breakout level — a crucial phase to validate trend continuation.
Support-Resistance Flip: The yellow zone is key in determining whether bulls maintain control.
---
🧠 Summary:
MEW/USDT is currently in a critical retest phase after a bullish breakout from a symmetrical triangle pattern. If support holds, this could be a solid swing opportunity toward higher resistance levels. However, a breakdown below the key support would invalidate the bullish setup and open room for further downside.
#MEWUSDT #CryptoAnalysis #BreakoutRetest #SymmetricalTriangle #AltcoinSetup #BullishScenario #BearishScenario #TechnicalAnalysis #SwingTrade
MEW : A meme coin that hasn't grown yetHello friends🙌
Given the decline we had, you can see that buyers entered the specified support area and entered the price into the ascending channel. That is why we can buy with risk and capital management and stay with it until the specified targets.
🔥Follow us for more signals🔥
*Trade safely with us*

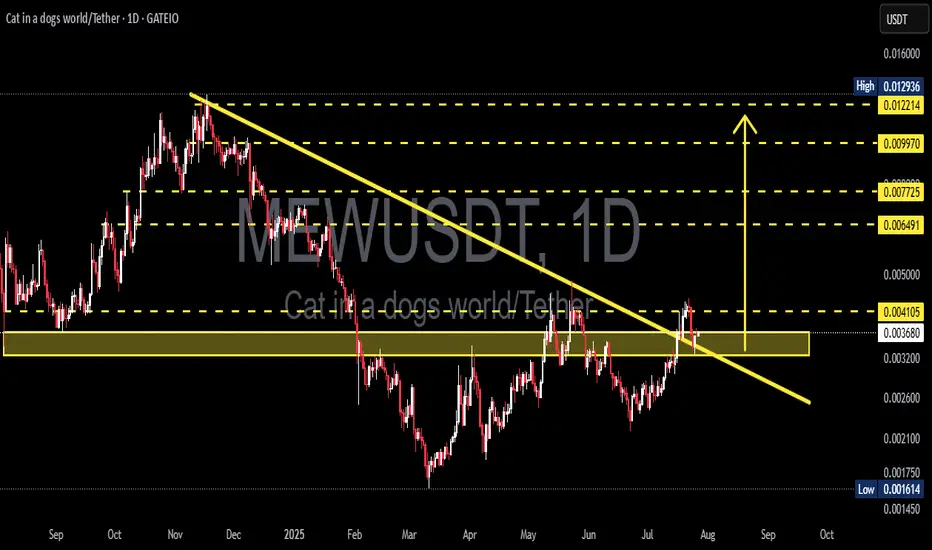
MEWUSDT Breakout! Rounded Bottom Reversal and Key Retest Zone!MEWUSDT has officially broken out of a long-term descending trendline that has capped price action since December 2024. The formation of a Rounded Bottom (Cup) suggests a strong accumulation phase and potential for trend reversal. The current retest of the breakout zone will be crucial in determining the next big move!
---
🔍 Technical Analysis Details:
1. Chart Pattern: A clear Rounded Bottom (Cup) pattern has formed, often signaling a bullish reversal. Price has broken through the descending trendline, and is now retesting the breakout zone (highlighted in yellow), which previously acted as resistance and is now turning into key support.
2. Resistance Levels (Upside Targets):
⚡ 0.004105 – First breakout point
🟡 0.006491 – Mid-level resistance
🟡 0.007725 – Previous local high
🟡 0.009970 – Strong resistance zone
🔵 0.012214 – Psychological resistance
🔵 0.012936 – Major swing high
3. Key Support Levels:
🟡 0.003200 – Current demand zone (yellow box)
🔵 0.001614 – Historical bottom
---
✅ Bullish Scenario:
If MEWUSDT holds above the 0.0032–0.0041 support zone and confirms it as a new base:
🎯 Target 1: 0.00649
🎯 Target 2: 0.0077
🎯 Higher targets: 0.0099 up to 0.0129 This breakout may be the start of a strong bullish rally, especially if accompanied by increasing volume.
---
⚠️ Bearish Scenario:
If price fails to hold the breakout zone and falls back below the trendline:
Price may revisit 0.0026 – 0.0020 support
Further weakness could push it back to the 0.001614 historical low
---
🧠 Conclusion:
MEWUSDT is showing early signs of a bullish reversal after breaking out of a long-term descending trendline and forming a rounded bottom pattern. The current retest zone is critical — holding this level could confirm the start of a bullish trend with multiple upside targets.
#MEWUSDT #CryptoBreakout #TechnicalAnalysis #Altcoins #MemeCoin #CryptoTrading #BullishSetup #RoundedBottom #TrendReversal #SupportAndResistance
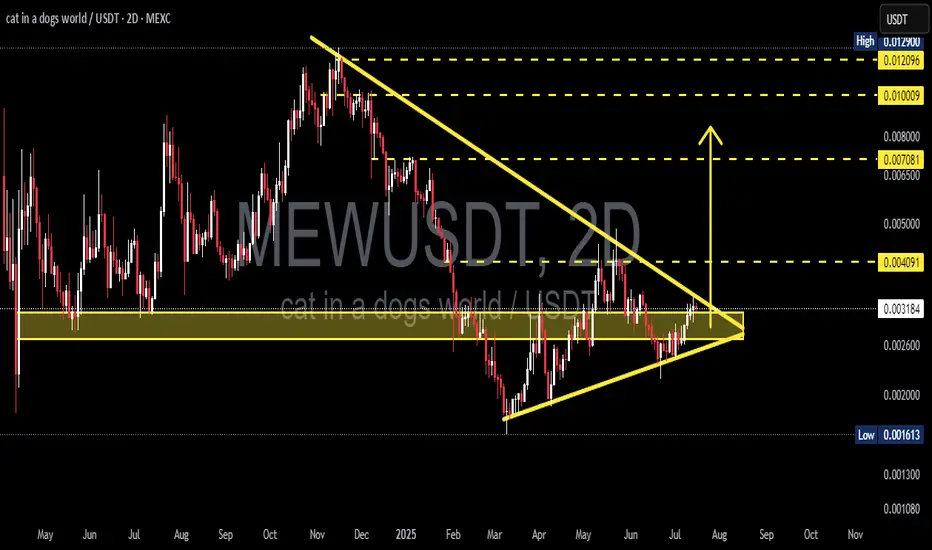
MEW/USDT Ready to Explode? Major Breakout from Symmetrical!After weeks of tight consolidation, MEW/USDT is showing signs of a major breakout from a well-formed Symmetrical Triangle pattern on the 2D time frame. This could mark the beginning of a powerful expansion phase if confirmed by volume and price action.
🔍 Pattern Analysis & Technical Structure
Main pattern: Symmetrical Triangle – a classic formation characterized by lower highs and higher lows, indicating a battle between buyers and sellers before a major move.
MEW has now broken through the triangle’s descending resistance line, signaling that buyers may be taking control.
The breakout occurred near the apex of the triangle, which often leads to explosive moves.
🟢 Bullish Scenario: Multi-Stage Upside Potential
If the breakout holds and gains confirmation (via volume or a successful retest), the next potential price targets are:
1. Initial Target: 0.0049 – nearest horizontal resistance and previous reaction level.
2. Mid Target: 0.0070 – measured move based on the height of the triangle from base to breakout.
3. Major Target Zone: 0.0090 – 0.0130 – previous distribution zone and high-confluence resistance.
📈 Upside potential exceeds +300% from current price if all bullish targets are hit!
🧠 Note: Symmetrical triangle breakouts are known to result in strong momentum-driven rallies, especially if supported by a rise in volume and broader market sentiment.
🔴 Bearish Scenario: Watch for Fakeout Risk
Despite the breakout, there’s always a risk of a false move:
If MEW fails to hold above the 0.0032 breakout zone and falls back inside the triangle, it may signal a bull trap.
A breakdown below the ascending support line could open the door for deeper downside:
Support Level 1: 0.0025 – recent accumulation base.
Support Level 2: 0.0016 – major low and strong demand zone.
Losing these levels would invalidate the current bullish setup.
⚙️ Key Confirmation Signals:
Volume: A breakout with strong volume = high conviction. Low volume = higher fakeout risk.
Successful Retest: A bounce from the breakout zone confirms strength and may provide a solid long entry.
Macro Sentiment: Watch Bitcoin dominance and market mood to confirm sustainability.
📊 Quick Technical Summary:
Pattern: Symmetrical Triangle
Breakout Level: 0.0032
Short-Term Trend: Bullish
Mid-Term Outlook: Neutral → Turning Bullish (if confirmed)
Key Resistance Levels: 0.0049 – 0.0070 – 0.0090 – 0.0129
Key Support Levels: 0.0025 – 0.0016
💬 Final Thoughts:
MEW/USDT is at a make-or-break moment. A validated breakout from this triangle could kick off a massive uptrend. But as always, stay alert to false breakouts — proper risk management is essential.
📌 Don’t just chase the breakout — watch the retest, volume, and broader context.
#MEWUSDT #MEWBreakout #SymmetricalTriangle #CryptoBreakout #AltcoinSetup #TechnicalAnalysis #TradingView #CryptoChart #BullishPattern #BreakoutAlert
MEW Looks Bliish (4H)An important trendline has been broken, and the price has pulled back to it. Within the internal structure of the pullback, a bullish iCH has also formed.
During minor pullbacks, it’s possible to look for buy/long positions on the MEW pair.
A daily candle closing below the invalidation level would invalidate this analysis.
For risk management, please don't forget stop loss and capital management
When we reach the first target, save some profit and then change the stop to entry
Comment if you have any questions
Thank You

cat in a dogs world #MEW price analysis🍿 Despite all the "trash" that has been happening on the crypto market lately and will continue at least today, someone decided to try their luck or has a clearly calculated plan!?)
1️⃣ Trading volumes of OKX:MEWUSDT are growing smoothly but steadily and now the price is at a critical point, so buying is dangerous.
2️⃣ But it is most likely worthwhile to “take a pencil” and monitor the future behavior of the $MEW price.
3️⃣ If the #MEW price manages to stay above $0.0030-0.0031 in the next few days, you can try buying with a growth prospect of x2 to 0.0056-0.0058.
_____________________
Did you like our analysis? Leave a comment, like, and follow to get more

Cat in a dogs world MEW price is pleasantly surprisingIt seems that MM algorithms are still comfortable trading #memecoins and their capital is there. The price moves very clearly from level to level, for example $MEW 👇
The preliminary impulse from our purchase zone in a very short time gave a +150% price movement OKX:MEMEUSDT
Of course, now the price of this #SolanaMemeCoin is “a little bit high”, but you can try your luck and pick up a long in the range of $0.0063-0.0075.
What do you think, will it be possible to take away +100-130% of the price movement?
Yes 👍 No 👎

MEW target 0.009534h time frame
-
Entry: $0.004
TP: $0.00953
SL: $0.003375
RR: 8.88
-
(1) Creating an ascending channel pattern
(2) Getting support on the channel bottom again, also a great entry
(3) Target is set at the channel top based on time and space analysis
(4) Fib extension 1.13 provides the same target as (3) at $0.00953
(5) Stop loss once going below $0.003375

MEWUSDT.P - SHORTBOS formed i'll go short from the OTE Mention as it has to retest before heading down hopefully we get filled there if not then moving on to next one cheers!
