November 20 Bitcoin Bybit chart analysisHello
It's a Bitcoin Guide.
If you "follow"
You can receive real-time movement paths and comment notifications on major sections.
If my analysis was helpful,
Please click the booster button at the bottom.
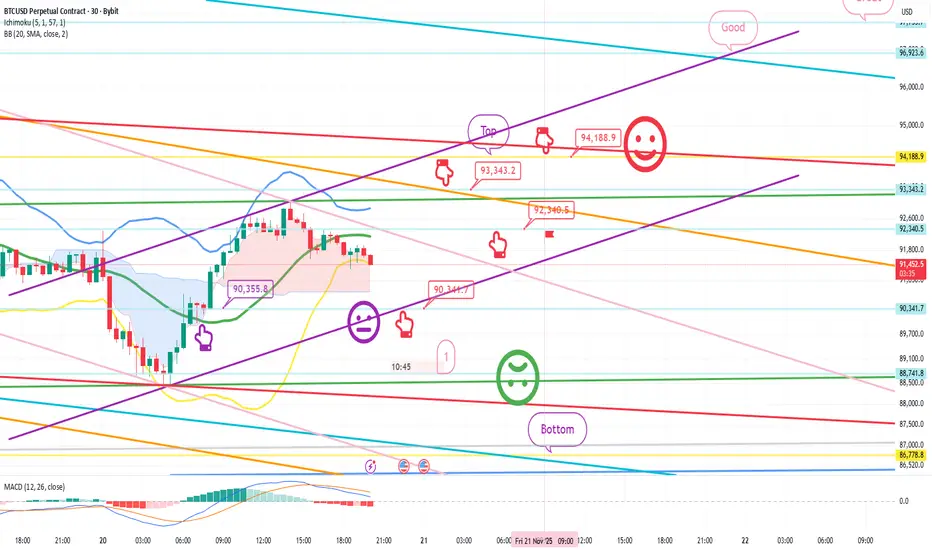
Here's a Bitcoin 30-minute chart.
Shortly, at 10:30 AM and 12 PM, the Nasdaq indicators will be released.
At the bottom left, the purple finger indicates the final long position entry point on the 19th, at $90,355.8. I've linked the strategy to that level.
The bottom area at the bottom is what I consider to be the major support line for this week.
(The center line of the Bollinger Bands monthly chart has moved from the previous $87,665.3.)
Everyone knows this and is waiting for it.
In my experience, if you wait at the bottom,
it generally doesn't come down easily. + Nasdaq volatility
Of course, we'll have to watch today's movement,
but please watch until the very end.
Because today could be a day with a significant move,
I kept my strategy as safe and simple as possible.
*Red Finger Movement Path:
One-Way Long Position Strategy
1. $90,341.7 long position entry point / Stop loss price if the purple support line is completely broken
2. $93,343.2 long position primary target -> Top, Good target price in that order
If the strategy is successful, you can utilize the 92.3K long position re-entry point indicated.
Since the 4-hour Bollinger Bands are repeatedly hitting the center line,
barring a sharp decline in the Nasdaq,
it is poised for a strong upward trend.
Note that the first point at the bottom is a double bottom.
If it falls to this level,
it is more likely to reach the bottom than to rebound.
Today, the Nasdaq and Bitcoin must move as far upward as possible to avoid falling to 86.7K this week. In the event of a weak sideways movement or correction,
I recommend keeping the bottom open until 9:00 AM next Monday.
Please use my analysis to this point for reference only.
I hope you operate safely, with a clear focus on principled trading and stop-loss orders.
Thank you.
Mexc
November 11 Bitcoin Bybit chart analysisHello
It's a Bitcoin Guide.
If you "follow"
You can receive real-time movement paths and comment notifications on major sections.
If my analysis was helpful,
Please click the booster button at the bottom.
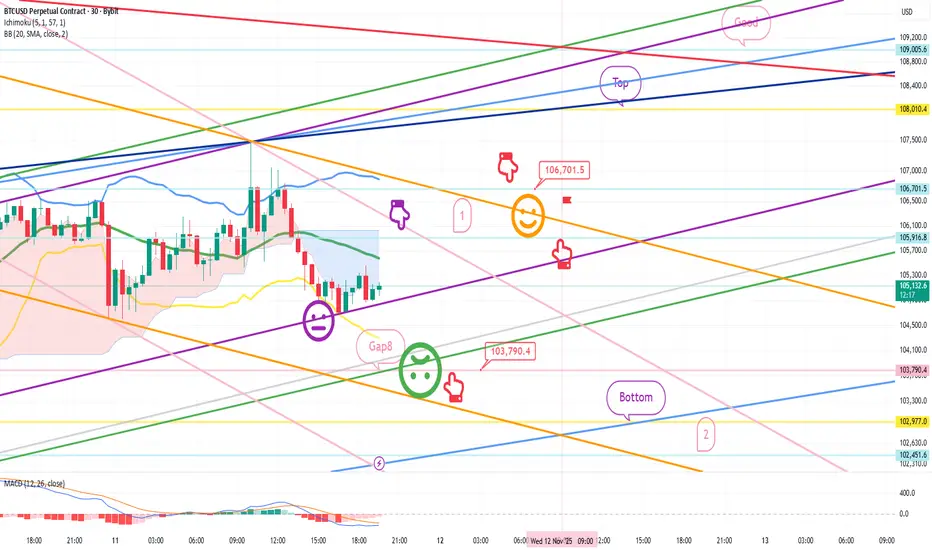
This is a Bitcoin 30-minute chart.
There are no separate Nasdaq indicators.
I developed a strategy based on the lower gap retracement of both Bitcoin and Nasdaq.
*Conditional long position strategy when the red finger moves
1. Confirm the first touch of the purple finger at the top (autonomous short)
Switch to a long position at the bottom at $103,790.4 /
Stop-loss price if the green support line is completely broken or the bottom is touched
2. First target for a long position at $106,701.5 / Target prices are Top and Good in that order.
If the strategy is successful, the first section is used to re-enter the long position.
If a correction occurs immediately without touching the first section at the top,
I'll wait for a long position at the bottom. Looking at the overall picture today, if the price drops to the bottom,
the medium-term pattern will be broken.
The purple support line must be maintained or the upper limit must be reached at 106.7K.
A rebound in the 1+4 range is required without breaking the green support line.
The Nasdaq variable is important, so please keep a close eye on the movement.
I hope you operate safely, with principled trading and stop-loss orders essential.
Thank you.
November 4 Bitcoin Bybit chart analysisHello
It's a Bitcoin Guide.
If you "follow"
You can receive real-time movement paths and comment notifications on major sections.
If my analysis was helpful,
Please click the booster button at the bottom.
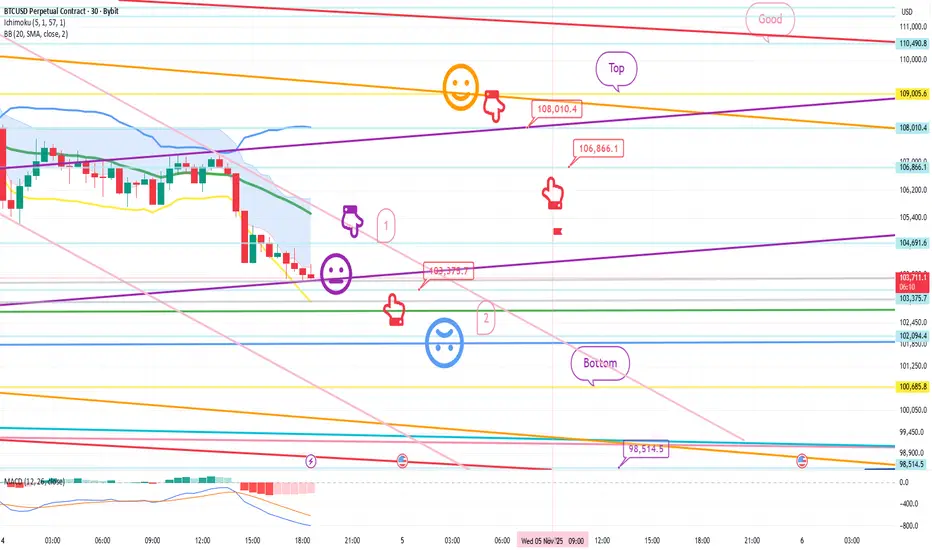
This is the Bitcoin 30-minute chart.
The Nasdaq indicators will be released shortly at noon.
Due to the end of Daylight Savings Time, we need to move back an hour from the previous chart.
Based on the pattern, the weekly chart reached the Bollinger Band support line,
which is a major support line.
However,
there's also pressure from the MACD dead cross on the monthly chart,
and the possibility of a Nasdaq coupling appears high during a decline.
So,
I developed today's strategy centered on the Nasdaq's lower gap retracement.
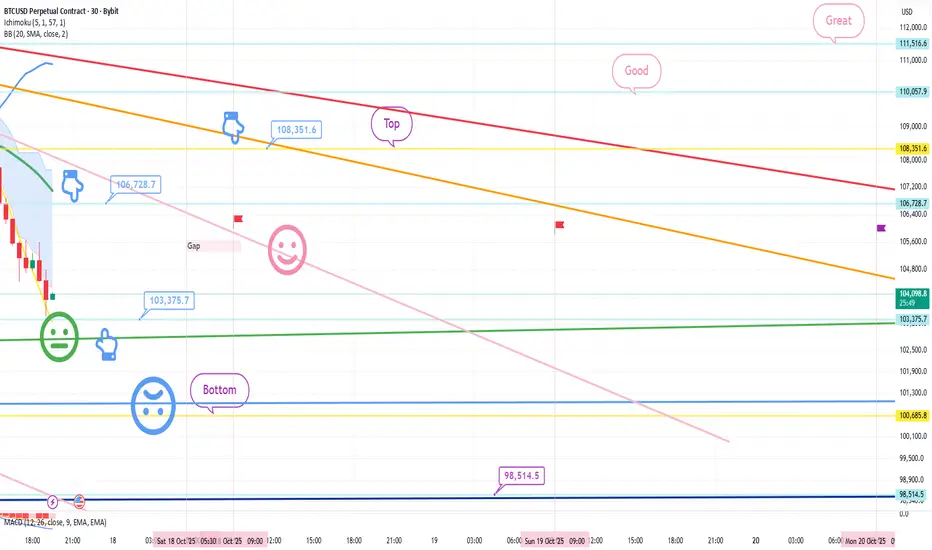
*When the red finger moves,
this is a conditional long position strategy.
1. Confirm that the purple finger touches the first section (autonomous short).
$103,375.7 long position entry point / stop loss if the light blue support line is broken.
2. $108,010.4 long position primary target -> Target prices are set at Top, then Good in that order. If the strategy is successful, 106.8K will be the point where you can re-enter a long position.
If the price falls immediately without touching the first point at the top, then the second point is the final long position.
The second point is a double bottom based on the low of this uptrend.
Based on the lower tail, the price is open from the bottom to 98.5K.
It would be wise to prepare for a failure of the Nasdaq decline and rebound.
Please use my analysis to this point for reference only.
I hope you operate safely, with a strict trading strategy and stop-loss orders.
Thank you.
October 29 Bitcoin Bybit chart analysis (FOMC)Hello
It's a Bitcoin Guide.
If you "follow"
You can receive real-time movement paths and comment notifications on major sections.
If my analysis was helpful,
Please click the booster button at the bottom.
Here's a 30-minute Bitcoin chart.
Shortly, at 11 AM, there will be Nasdaq data releases.
At 3 AM, the FOMC releases data.
Unfortunately, yesterday's BTC move, which involved long and short positions, led to a strategy failure, so today's analysis will be completely public.
I ask for your support.
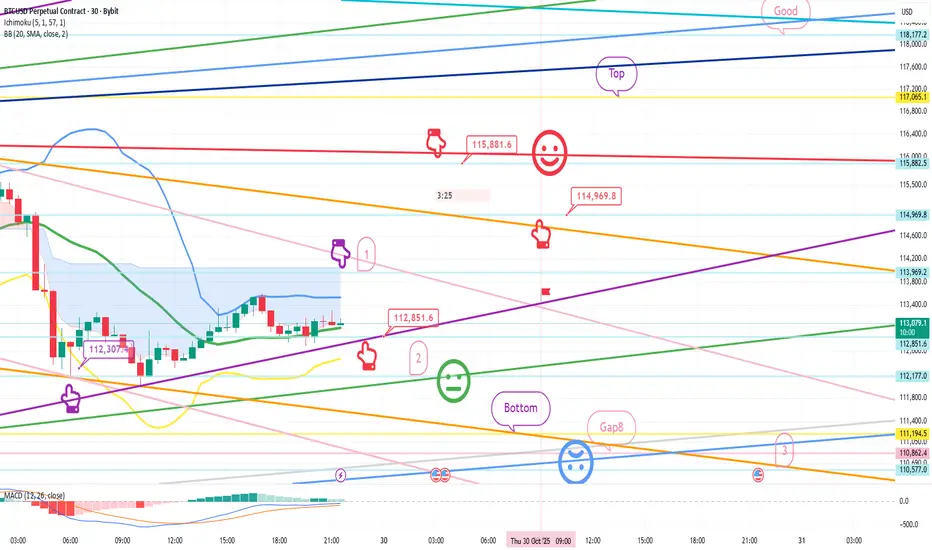
On the left, the purple finger connects yesterday's final long position entry point, the third section at $112,307.4.
While the interest rate cut is fundamentally positive,
I calculated the Nasdaq price fluctuations and implemented my strategy.
While there may be significant movements early in the morning,
BTC has many important elements, so I recommend reading carefully.
*Conditional Long Position Strategy: When the Red Finger Moves
1. After confirming that the purple finger touches the first section at the top,
the red finger marks the entry point for a long position at $112,851.6.
/ If the green support line is broken, set a stop loss price at $115,881.6.
1st target for a long position: $115,881.6 -> Target price at Top, Good, in that order.
If the strategy succeeds until the first target is touched, $114,969.8 is the point where the long position can be re-entered.
If the red resistance line is broken,
an uptrend could immediately resume.
If the price fails,
there's a possibility of another strong correction.
If the top section is touched before tomorrow's daily candlestick formation,
since this is the resistance line on the daily Bollinger Band chart,
a strong correction is likely,
it would be a good idea to enter a short position and then wait for a long position.
From the first section at the top to the orange resistance line,
a strong rebound is possible, so I don't recommend shorting.
If the price drops immediately without touching the first section,
then I recommend waiting for a final long position in the second section. If the green support line is broken,
then a pullback to the Gap 8 section at the bottom is highly likely.
Please note that if the green support line is broken,
then a pullback to the Gap 8 section at the bottom is highly likely.
Up to section 3 is open,
but this section is connected to the medium-term uptrend line,
so long positions should be held at all costs.
Yesterday's move also broke the first and fourth sections without any support,
breaking the medium-term pattern.
Since the 12-hour MACD dead cross isn't yet considered risky,
I proceeded as safely as possible, as the Nasdaq's movements were in line with it.
Please use my analysis to this point for reference only.
I hope you operate safely, adhering to principled trading and a stop-loss system.
Thank you.
October 28 Bitcoin Bybit chart analysis
Hello
It's a Bitcoin Guide.
If you "follow"
You can receive real-time movement paths and comment notifications on major sections.
If my analysis was helpful,
Please click the booster button at the bottom.
This is Bitcoin's 30-minute chart.
There's a Nasdaq indicator release coming up at 11:00 AM.
Bit has broken its short-term pattern by touching the center line of the 3-hour Bollinger Bands chart.
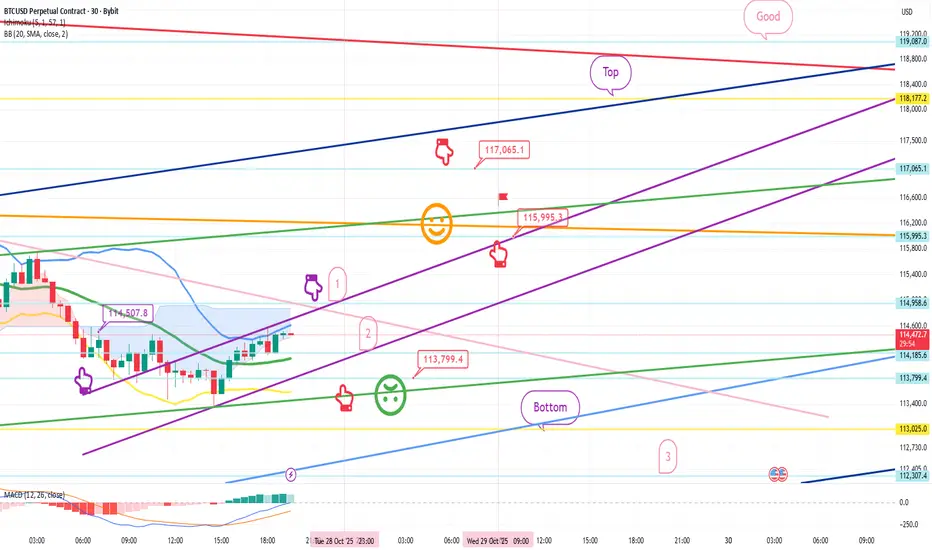
On the left, the purple finger indicates the entry point for the long position at $114,507.8, which we entered yesterday.
I've followed the same strategy. *Red Finger Movement Path:
Long Position Strategy
1. Confirm that the purple finger touches the first section at the top.
Red finger: $113,799.4 is the entry point for a long position.
/ If the green support line is broken, set a stop loss.
2. $117,065.1 is the first target for a long position. Target prices are set at Top and Good in that order.
If the strategy is successful, 115.9K is the point where the long position can be re-entered.
If the good section is reached before tomorrow's daily candlestick formation,
a correction may occur at the daily Bollinger Band resistance line.
A short position switch can be made.
If the price touches Section 1 at the top and rebounds strongly,
or if Section 2 is touched and rebounds within the purple support line,
a vertical rise is expected.
When the green support line breaks,
I've marked the support line from Bottom to up to Section 3.
Those who entered long yesterday at 114.5K should follow the same stop-loss order today when the green support line breaks.
I hope you'll continue to operate effectively, starting with Section 1 above.
By organizing this,
those who are long, those without a position, and those who are short
will all be able to utilize it.
Please use my analysis to this extent for reference only.
I hope you operate safely, adhering to principled trading and stop-loss orders.
Thank you.
October 23 Bitcoin Bybit chart analysisHello
It's a Bitcoin Guide.
If you "follow"
You can receive real-time movement paths and comment notifications on major sections.
If my analysis was helpful,
Please click the booster button at the bottom.
This is Bitcoin's 30-minute chart.
There's a Nasdaq release coming up at 11:00 AM.
At the bottom left, with the purple finger,
I've linked the strategy to yesterday's long position entry point, $107,146.8.
The Nasdaq is correcting after its medium-term pattern has broken,
and Bitcoin is on track for a golden cross on the 4-hour and daily MACD charts.
XAUUSD is losing strength in gold,
and yesterday, there was some decoupling on the Nasdaq.
It will be important to see whether Bitcoin gains strength.
*When the red finger moves,
I'm considering a one-way long position strategy.
1. $108,136.7 long position entry point / Stop loss price if the green support line is broken
2. $110,837.9 long position primary target -> Top, Good, in that order.
If the strategy is successful, 110.2K is the long position re-entry point.
If a successful rebound occurs within the purple support line of the first section above, a vertical rise is possible, so please keep this in mind.
Due to the Nasdaq correction today,
we will operate a little more safely.
If the bottom section is pushed today,
the mid-term uptrend line will also break,
which is not good for a long position.
Since points 2 and 3 are both double bottoms, they can be risky.
Since a touchdown could trigger a variable,
we recommend utilizing a 5-minute trend reversal.
Please note that my analysis so far is for reference only.
I hope you operate safely, adhering to principled trading and stop loss orders.
Thank you.

October 17 Bitcoin Bybit chart analysisHello
It's a Bitcoin Guide.
If you "follow"
You can receive real-time movement paths and comment notifications on major sections.
If my analysis was helpful,
Please click the booster button at the bottom.
This is Bitcoin's 30-minute chart.
There are no Nasdaq data releases today.
Bit has been falling sharply since yesterday and today, as it has been coupled with the Nasdaq.
I've been thinking a lot about the possibility of further declines.
*When the light blue finger moves,
Bidirectional neutral
Short->Long switching or final long position strategy
1. $106,728.7 short position entry point / Stop-loss price upon breaking the pink resistance line
2. $103,375.7 long position switching / Stop-loss price upon breaking the green support line
3. Long position target prices, starting from the top section at the top
If the price falls immediately without touching the short entry point at 106.7K,
the final long position is at the bottom section at the bottom.
The bottom section is a double bottom, where the previous low is broken.
Because the lower tail may be pushed to $98,514.5, indicated at the bottom,
rather than placing a limit order,
we recommend switching long positions after confirming a trend reversal on the 5-minute chart.
More importantly, the Nasdaq movement appears to be the most important. It's frustrating that Bitcoin is coupled with the Nasdaq, which plummets at crucial moments, but it seems the coin market has never been easy.
At least if you're trading in real time, in a market where some people lose money while others make money, giving up would only hurt you.
In times like these, it's crucial to stay focused and practice principled trading and stop-loss orders.
Thank you for your hard work this week.
October 2 Bitcoin Bybit chart analysisHello
It's a Bitcoin Guide.
If you "follow"
You can receive real-time movement paths and comment notifications on major sections.
If my analysis was helpful,
Please click the booster button at the bottom.
This is a 30-minute Bitcoin chart.
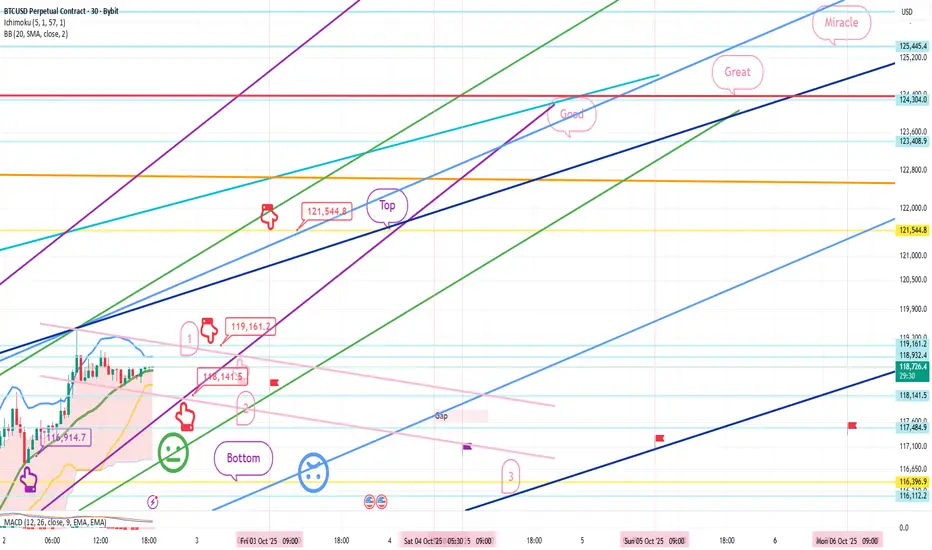
The bottom left shows yesterday's long position re-entry point, $116,914.7, indicated by a purple finger.
We will continue with the trend-following strategy.
*Red finger movement path:
Long position strategy
1. $118,668.2 long position entry point / Stop loss price if the green support line is broken
2. $119,161.2 long position primary target -> Target prices in order from the top to the miracle level
If the strategy is successful, the first section is the long position re-entry point,
and a new high is reached after the great breakout.
The second section is the final long position entry point.
If the green support line is maintained until the second section,
it will become an upward sideways market.
If the light blue support line holds through the weekend and next week,
it could continue to rise as it's a mid-term uptrend line.
Please keep this in mind.
Bottom -> I've left up to three sections.
You can check the prices of the major support and resistance lines above and below the section I've left or by dragging.
Please use my analysis as a reference only.
I hope you operate safely, with a principled trading strategy and stop-loss orders in place.
Have a nice holiday until next Friday.
I'll be back on Friday.
Thank you.
September 29 Bitcoin Bybit chart analysisHello
It's a Bitcoin Guide.
If you "follow"
You can receive real-time movement paths and comment notifications on major sections.
If my analysis was helpful,
Please click the booster button at the bottom.
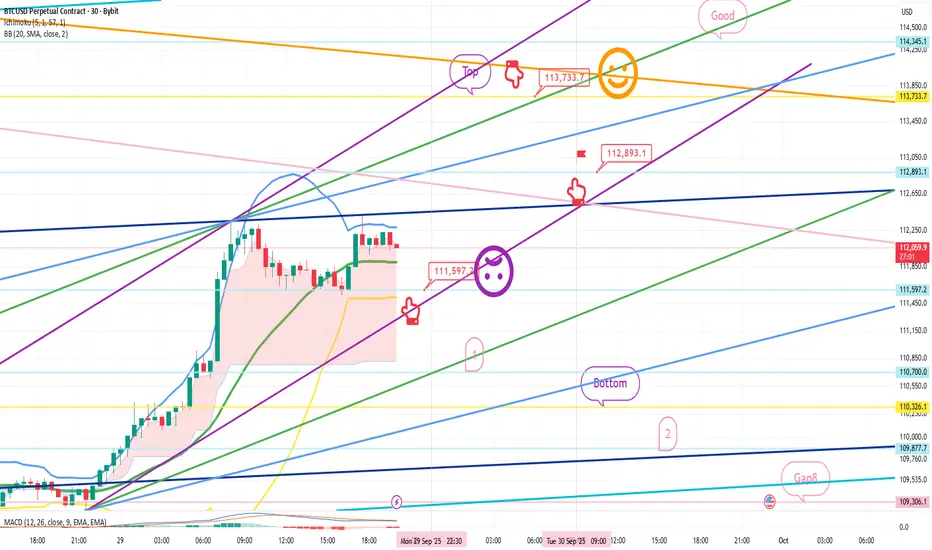
This is a Bitcoin 30-minute chart.
There are no Nasdaq indicators released today.
I developed a strategy based on the rising pattern.
*Red finger movement path:
One-way long position strategy
1. $111,597.2 long position entry point / Stop loss if the purple support line is broken
2. $113,733.7 long position first target -> Good second target
If the strategy is successful, the 112,8K level indicated
can be used as a long position re-entry point.
Up to the first section below, the price is moving sideways to the right.
From the bottom section touch, there's a high probability of a decline to the Gap 8 retracement level.
Please check the bottom support line and section 2 indicated below.
Up to this point,
I ask that you use my analysis for reference only.
I hope you operate safely, with a focus on principled trading and stop-loss orders.
Thank you.
September 23 Bitcoin Bybit chart analysisHello
It's a Bitcoin Guide.
If you "follow"
You can receive real-time movement paths and comment notifications on major sections.
If my analysis was helpful,
Please click the booster button at the bottom.
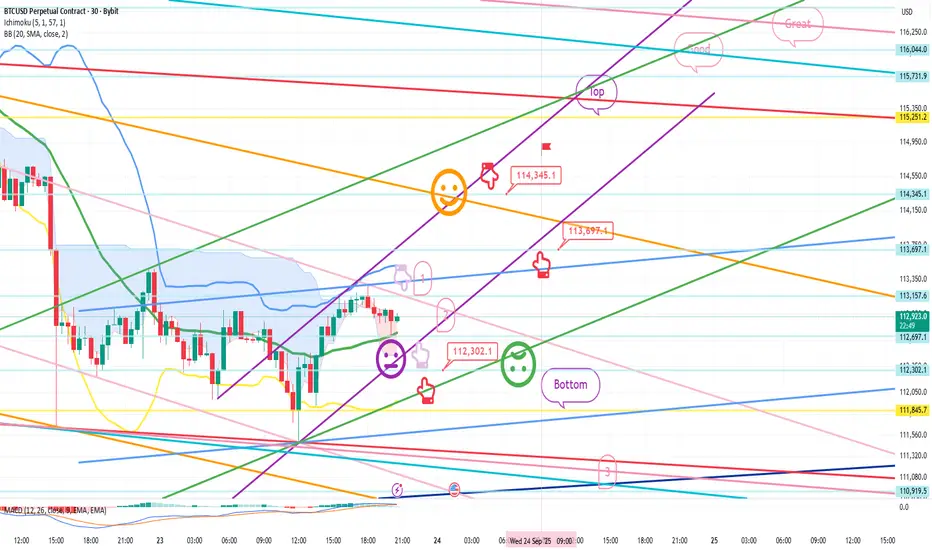
This is Bitcoin's 30-minute chart.
There's an indicator release near 11:00 AM on the Nasdaq,
and I expected a small fluctuation.
I proceeded as safely as possible, considering the current situation.
*When the red finger moves,
One-way long position strategy:
1. Long position entry point at $112,302.1 / Stop loss price if the green support line is broken.
2. Long position initial target at $114,345.1 -> Target prices in order of Top, Good, Great.
After reaching the target price of $114.3K,
you can re-enter the long position at the indicated price of $113.6K.
In the case of 1->2 above,
there's a strong possibility of an upward movement along the purple parallel line. (The 5+15 pattern is still in place.)
The current rebound has already formed a double bottom,
so a drop below the bottom
is not a good move for long positions.
In case of a delay, I've indicated up to section 3 at the bottom.
Thanks to the recent interest from newcomers,
I've made this post publicly available for the first time in a while.
Please use my analysis for reference only.
I hope you operate safely, with a focus on principled trading and stop-loss orders.
Thank you.
ETH 1H Analysis - Key Triggers Ahead | Day 22😃 Hey , how's it going ? Come over here — Winter got something for you!
⏰ We’re analyzing ETH on the 1-Hour timeframe.
👀 On the 1-hour chart, we can see that Ethereum lost an important support level at $4,571 and then moved downward, finding support around $4,513. Two consecutive 1-hour candles have closed above this level. Currently, price is trading between $4,513 and $4,571, and a breakout of either zone could lead Ethereum toward the next support or resistance level.
🧮 The RSI oscillator is hovering around 50–30, indicating that a breach of these levels could trigger momentum toward the target zones.
🕯 The size and volume of red candles increased as price reached $4,621 after a short range, and the market then reversed downward. A significant support level was broken, accompanied by a large red “whale” candle reflecting strong selling pressure.
Ethereum may attempt to move toward resistance next, and it’s important to monitor the type and volume of candles forming in this area.
💸 On the ETH/BTC pair, we can see that after breaking its previous low, price moved downward but then found support around 0.0384 and is now moving upward. We need to monitor how far this pair can continue, as there is a resistance level at 0.03931. A breakout above this resistance could trigger a renewed upward move.
Additionally, the pair has formed a higher low compared to its previous bottom, providing the first confirmations of a bullish trend for ETH relative to BTC. This signals a potential long opportunity on this trading pair.
🧠 It’s better to wait for a clearer structure before opening new positions.
If you want to trade sooner, a break of resistance at $4,621 could offer a long position.
Another resistance level at $4,571 can also provide a potential long entry with lower risk, though the win probability is slightly lower — consider this a riskier trigger.
❤️ Disclaimer : This analysis is purely based on my personal opinion and I only trade if the stated triggers are activated .

USDT.D 1H Analysis - Key Triggers Ahead👋🏻 Hey everyone! How’s it going? Hope you’re all doing well.
❄️ Welcome to Crypto Winter.
⏰ Today, we’ll be analyzing USDT.D and exploring its potential opportunities.
👀 On the 1H timeframe of USDT dominance, we noticed that after touching the support zone, we were expecting a breakdown. However, with a fake-out, it reversed and is now correcting upwards. The next resistance for USDT dominance could be around 4.34%.
🧮 The RSI oscillator is approaching the key level around 70 (overbuy zone). If USDT dominance enters this area, it could trigger a deeper correction in the market.
🕯 The green candles in USDT dominance (profit-taking and closing of long contracts) are gradually increasing. We should watch closely how these candles react as we approach the 4.34% resistance level.
🧠 Since we don’t want to open shorts here, the best strategy is to wait and see how USDT dominance reacts before entering any positions. This is very important. In the meantime, we can build a watchlist and focus on other setups.
❤️ Disclaimer : This analysis is purely based on my personal opinion and I only trade if the stated triggers are activated .

ETH 1H Analysis - Key Triggers Ahead | Day 21👋🏻 Hey everyone! How’s it going? Hope you’re all doing well.
❄️ Welcome to Crypto Winter.
⏰ Today, we’ll be analyzing ETH and exploring its potential opportunities.
👀 On the 1-hour timeframe, Ethereum broke its trendline after yesterday’s news and started moving upward. It is currently testing resistance at $4,619, and a confirmed breakout above this level could open the way for further upside movement.
🧮 Looking at the RSI oscillator, two key zones stand out. Given the positive economic news from yesterday and today, which increased capital inflows into equities, the 70 level and potential entry into the overbought zone become more significant. This could support Ethereum’s price in moving higher.
🕯 The size, volume, and frequency of green candles have increased. With continued buying pressure and momentum pushing into the overbought area, Ethereum may break the $4,619 resistance, absorb sell orders, and continue its upward move.
💸On the 1-hour timeframe, (ETHBTC), Ethereum is also showing strength. After breaking its trendline, it moved upward but is currently facing resistance at 0.0396 and has been rejected once. A breakout and stabilization above this zone would likely support further bullish movement for Ethereum against Tether as well.
🧠 If Ethereum confirms a breakout and holds above $4,619, it could trigger a strong bullish rally, potentially extending toward higher price levels. Traders should note that entries can be considered after stabilization with a multi-timeframe indecision candle setup. However, the possibility of pullbacks and corrections in Ethereum remains present.
❤️ Disclaimer : This analysis is purely based on my personal opinion and I only trade if the stated triggers are activated .

September 11 Bitcoin Bybit chart analysis (CPI)Hello
It's a Bitcoin Guide.
If you "follow"
You can receive real-time movement paths and comment notifications on major sections.
If my analysis was helpful,
Please click the booster button at the bottom.
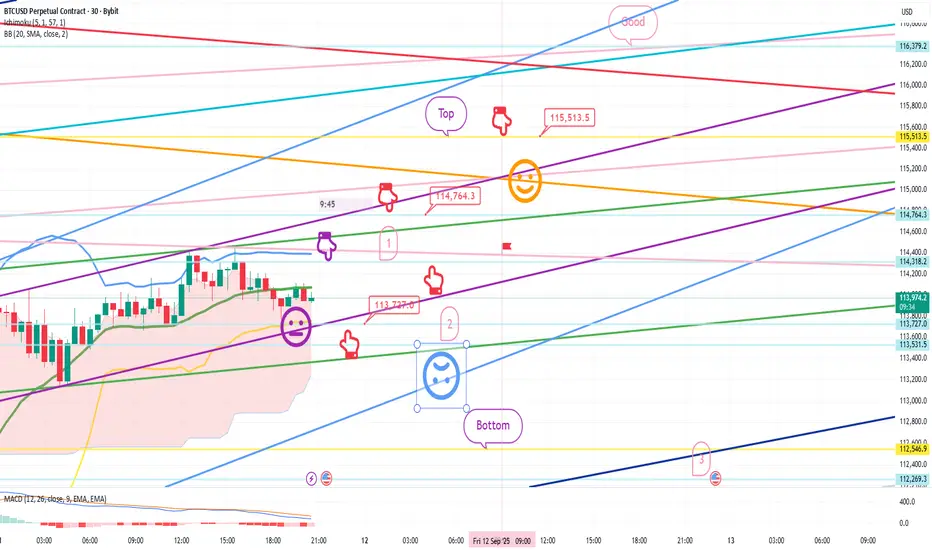
This is Bitcoin's 30-minute chart.
The CPI indicator will be released shortly at 9:30 AM.
I implemented the strategy based on Nasdaq movements.
*When the red finger moves,
Long position strategy
Confirm the upward wave by touching the first section above (autonomous shorting)
1. $113,727 long position entry point / Stop loss if the light blue support line is broken
2. $114,764.3 long position 1st target -> Top 2nd -> Good 3rd target
If the daily candlestick forms before 9:00 AM tomorrow,
you can switch to a short position if the top section is touched.
You can also use the first section shown as a long position switching point.
If the price falls immediately without touching the purple finger at the top, the final long position is at the second level. The strategy was to place a stop-loss order from the breakout of the light blue support line until the possibility of a sideways movement.
From the breakout of the light blue support line, the price opens up to the bottom -> level 3, so long positions should be cautious.
Please use my analysis to this point for reference only.
I hope you operate safely, adhering to principled trading and a stop-loss order.
Thank you.
September 3 Bitcoin Bybit chart analysisHello
It's a Bitcoin Guide.
If you "follow"
You can receive real-time movement paths and comment notifications on major sections.
If my analysis was helpful,
Please click the booster button at the bottom.
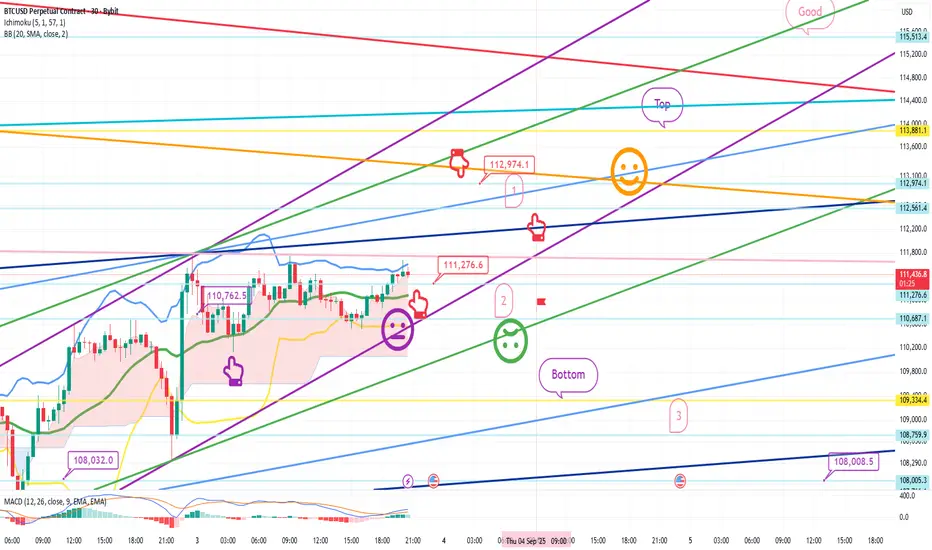
This is a Bitcoin 30-minute chart.
The Nasdaq indicators will be released at 11:00 AM.
At the bottom left is the long position entry point from the 1st, $108.032.
Above that is the purple finger at $110,762.5.
I've linked the strategy to the long position re-entry point.
*If the red finger follows the path,
it's a one-way long position strategy.
1. Long position entry point at $111,276.6 / Stop loss if the green support line is broken.
If the price falls sharply from the current level,
it's a long position waiting point up to section 2.
If the price touches or breaks the green support line,
it breaks the short-term pattern, which is not a good strategy for long positions.
2. Long position at $112,974.1, first target -> top section, second target
When it reaches 112.9K, the first section is the upper section for re-entry into a long position.
The uptrend line is the green support line -> the deep blue support line.
From the second section, it could fall to the bottom -> the third section -> 108K.
From the deep blue support line,
a medium- to long-term correction and sideways trading may follow, so please keep this in mind.
As long as the Nasdaq doesn't crash today, that's fine.
Please use my analysis as a reference only.
I hope you operate safely, with a strict trading strategy and stop-loss orders.
Thank you.
Understanding How Crypto Exchanges Influence Coin PricesUnderstanding How Crypto Exchanges Influence Coin Prices
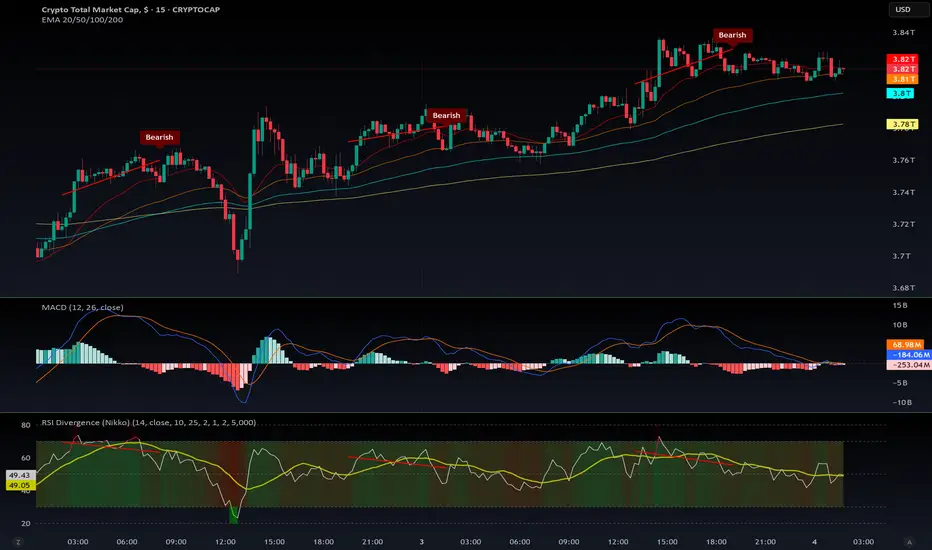
Cryptocurrency markets often appear unpredictable, with sudden price surges or drops that seem to defy logic. For example, when Bitcoin ( CRYPTOCAP:BTC ) experiences a sharp upward spike—a "green candle"—many altcoins follow almost instantly. Why does this happen so quickly? This tutorial explores the theory that centralized exchanges (e.g., Binance, Coinbase) can manipulate coin prices by adjusting internal database values rather than executing real on-chain trades, and how they may use "pegging ratios" to control price movements of specific coins or ecosystems.
The Myth of Instant Market Reactions
When CRYPTOCAP:BTC surges, altcoins often move in lockstep, seemingly without delay. A common assumption is that millions of investors or market-making bots react simultaneously, causing this synchronized movement. However, natural market reactions typically involve some lag due to order book processing, trader decisions, or bot algorithms. So why is the movement near-instantaneous?
The answer may lie in how centralized exchanges operate. Unlike decentralized exchanges (DEXs), which rely on transparent on-chain transactions, centralized exchanges manage trades internally using their own databases. This means they control virtual coin balances, not necessarily actual blockchain assets. When an exchange wants to "pump" a coin (e.g., increase its price by 10% following a CRYPTOCAP:BTC spike), it doesn't need to buy real coins on the blockchain. Instead, it can simply adjust the coin's value in its database, creating the appearance of market activity without requiring reserve assets.
This internal manipulation allows exchanges to influence prices rapidly, explaining the lack of lag in altcoin movements.
------------------
How Exchanges Peg Coins to Major Assets
Exchanges often peg the price movements of altcoins to major cryptocurrencies like CRYPTOCAP:BTC , CRYPTOCAP:ETH , or CRYPTOCAP:SOL , using a weighted ratio that determines how closely a coin follows these leaders. This pegging isn't a fixed value but a dynamic relationship that can vary by coin or ecosystem. For instance:
Typical Pegging Structure:
50% tied to CRYPTOCAP:BTC (the dominant market driver).
50% tied to other ecosystems (e.g., CRYPTOCAP:ETH for Ethereum-based tokens, CRYPTOCAP:SOL for Solana-based tokens).
Example: A meme coin on the Ethereum blockchain might be pegged 50% to CRYPTOCAP:BTC , 25% to CRYPTOCAP:ETH , and 25% to a general "meme coin" index.
This pegging explains why some coins pump or dump more aggressively than others during market trends. Each coin's price movement is a weighted response to the assets it's tied to.
The Role of Pegging Ratios: Pumps vs. Dumps
Exchanges don't apply uniform ratios for upward and downward price movements. Instead, they may assign positive or negative ratios to influence a coin's trajectory:
Positive Ratio: A coin rises faster than its pegged assets during pumps (upward movements) and falls slower during dumps (downward movements). This increases the coin's value over time, often because the exchange holds a large position and plans to sell later for profit.
Example: CRYPTOCAP:SOL might have a 2:1 positive ratio, rising twice as fast as CRYPTOCAP:BTC during a pump and falling half as fast during a dump.
Other Examples: CRYPTOCAP:BNB (Binance's token) and GETTEX:HYPE often show positive ratios, benefiting from exchange favoritism.
Negative Ratio: A coin rises slower than its pegged assets during pumps and falls faster during dumps. This can gradually erode a coin's value, often used by exchanges to liquidate or delist coins they no longer favor.
Example: SEED_DONKEYDAN_MARKET_CAP:ORDI , pegged to CRYPTOCAP:BTC , may fall faster than CRYPTOCAP:BTC during dumps and rise slower during pumps, leading to a net decline.
Other Examples: CRYPTOCAP:INJ , NYSE:SEI , LSE:TIA often exhibit negative ratios.
Meme coins are a special case, typically pegged to both CRYPTOCAP:BTC and their native blockchain:
CRYPTOCAP:PEPE (Ethereum-based) may have a neutral ratio, moving evenly with CRYPTOCAP:BTC and $ETH.
SEED_DONKEYDAN_MARKET_CAP:BONK (Solana-based) might have a negative ratio, falling faster than CRYPTOCAP:BTC and $SOL.
------------------
Exchange Strategies: Controlling Ecosystems and Liquidation
Exchanges can manipulate entire ecosystems by adjusting ratios for categories of coins. For example:
Setting a 2:1 ratio on all meme coins could make them rise twice as fast as CRYPTOCAP:BTC during a pump, creating hype and attracting retail investors.
Conversely, assigning a negative ratio to an ecosystem (e.g., certain layer-2 tokens) can suppress their value, allowing the exchange to accumulate or liquidate positions.
A notable strategy is slow liquidation:
Exchanges may apply a negative ratio to a coin they wish to delist (e.g., SEED_DONKEYDAN_MARKET_CAP:ORDI ). Over time, the coin's value erodes until it reaches a level where the exchange can justify delisting it, citing "low trading volume" or "lack of interest."
This process creates space for new coins the exchange favors, often ones they hold or have partnerships with.
------------------
Why This Matters for Traders?
The idea that coin prices are driven purely by investor sentiment and organic price action is overly simplistic. Centralized exchanges, with their control over internal databases, can heavily influence price trends. Understanding this can help traders:
Identify Positive-Ratio Coins: These are likely to increase in value over the mid-to-long term. Accumulating coins like CRYPTOCAP:SOL or CRYPTOCAP:BNB during dips could yield profits if their positive ratios persist.
Avoid Negative-Ratio Coins: Coins like SEED_DONKEYDAN_MARKET_CAP:ORDI or CRYPTOCAP:INJ may bleed value over time, draining portfolios unless traded carefully.
Monitor Ecosystem Shifts: Watch for exchange announcements (e.g., new listings, delistings) or unusual price movements that deviate from $BTC/ CRYPTOCAP:ETH trends, as these may signal ratio changes.
------------------
Important Notes
Dynamic Ratios: Pegging ratios are not fixed and can change daily based on exchange strategies, market conditions, or liquidity needs. Always verify current trends with real-time data.
Data Sources: Use tools like CoinGecko, CoinMarketCap, or on-chain analytics (e.g., tradingview) to track correlations between coins and their pegged assets.
Risks of Centralized Exchanges: This tutorial focuses on centralized platforms, not DEXs, where on-chain transparency limits such manipulation. Consider diversifying to DEXs for more predictable trading.
Speculative Nature: While this theory is based on observed market patterns, it remains speculative. Exchanges rarely disclose internal mechanisms, so traders should combine this knowledge with technical analysis and risk management.
------------------
Conclusion
Crypto exchanges wield significant power over coin prices by adjusting virtual balances in their databases and using dynamic pegging ratios. By understanding positive and negative ratios, traders can make informed decisions about which coins to hold or avoid. Always conduct your own research, monitor market trends, and use secure platforms to protect your investments. The crypto market may be rigged in some ways, but knowledge of these mechanics can give you an edge.
August 28 Bitcoin Bybit chart analysisHello
It's a Bitcoin Guide.
If you "follow"
You can receive real-time movement paths and comment notifications on major sections.
If my analysis was helpful,
Please click the booster button at the bottom.
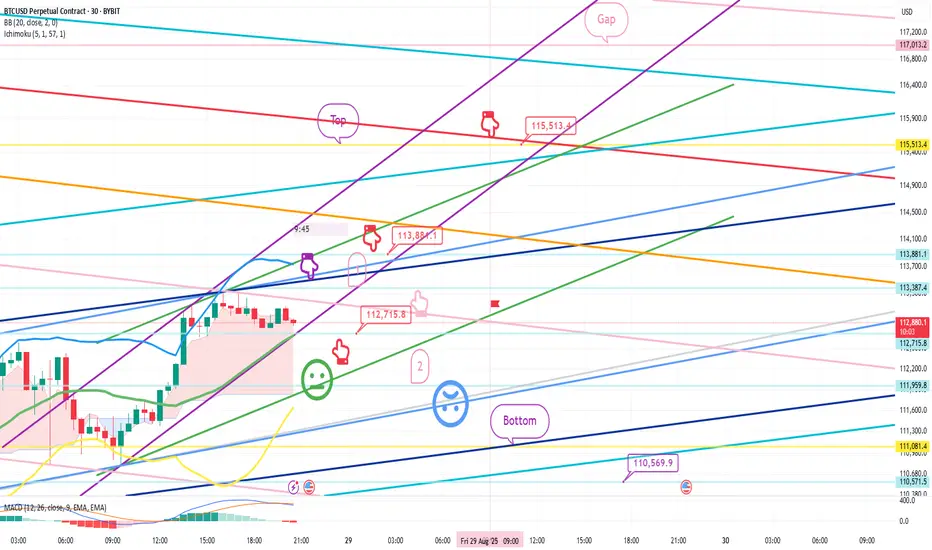
This is a 30-minute Bitcoin chart.
Although not visible on the screen,
I've used the same strategy as the long position entry point two days ago, at $109,950.4.
*If the red finger moves,
this is a conditional long position strategy.
1. After touching the first section at the top, the red finger indicates a long position entry point of $112,715.8. Stop-loss price if the green support line is broken.
(Since the purple finger touches the market, it's likely to immediately connect with an uptrend, so it's best not to open a short position. Check for an upward wave. Also, it's important to check whether the purple support line is broken first.)
2. Long position: $113,881.1. 1st target -> Top. 2nd target -> Target price up to the final gap.
If the price falls immediately without touching the purple finger at the top, hold for the final long position at section 2. Stop-loss price if the light blue support line is broken. Since the light blue support line is a mid-term uptrend line,
it's crucial for long positions not to break out today.
Below that, the bottom is open to $110.5K.
Up to this point, I ask that you use my analysis for reference only.
I hope you operate safely, with a focus on principled trading and stop-loss orders.
Thank you.
$PWEASE will go to the moon$ PWEASE go to the moon.
The daily RSI retested the 50 line, indicating the start of an uptrend after a long period of accumulation with well-defined support. BTC dominance is falling, which is essential for the rise of altcoins.
The political scenario also helps, with JD Vance increasingly in the media spotlight (even appearing on South Park).
At least 100 million is expected.
If Trump slips and falls, we will expect at least 10 billion.
$ PWEASE market cap today: only 4.5 million
Easy Money!

August 19 Bitcoin Bybit chart analysisHello
It's a Bitcoin Guide.
If you "follow"
You can receive real-time movement paths and comment notifications on major sections.
If my analysis was helpful,
Please click the booster button at the bottom.
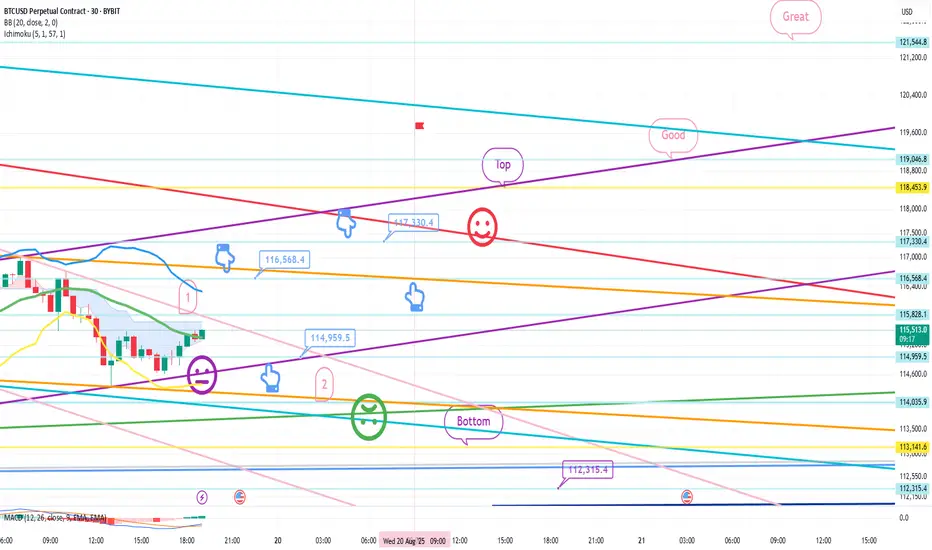
This is the Nasdaq 30-minute chart.
There are no separate indicators released.
Roughly speaking,
the strategy is to switch from short to long at the light blue finger, or to wait long at the bottom.
The bottom is today's major support line and the 6+12 pattern recovery point.
If the price moves along the light blue finger path,
there's a possibility that it will eventually fall to touch the 6+12 level again.
Please note this.
I applied this directly to Bitcoin.
This is a 30-minute Bitcoin chart.
The Nasdaq is moving sideways in a downward trend,
while Bitcoin has continued its vertical decline after hitting a new high.
*If the blue finger moves along the path,
switch from short to long. Or, if it immediately declines, wait long in the second section.
This is a two-way neutral strategy.
1. $116,568.4 short position entry point / Stop loss price if the orange resistance line is broken.
2. $114,959.5 long position switch / Stop loss price if the purple support line is broken.
3. $117,330.4 long position first target / 116.5K long position re-entry point.
After this, long position target prices are listed in order of Top, Good, and Great.
The first point above is the best short position entry point for today.
If the price declines around the first touch, hold long at the second point.
Stop loss price if the green support line is broken.
In the case of Bitcoin, the candlestick is breaking out of the 12+ daily pattern,
and the downside is open.
If the bottom point is maintained, the mid-term uptrend will be broken.
-> If the bottom point is broken out, the mid-term uptrend will be broken. A medium-term downtrend may be forming.
(MACD dead cross on weekly chart)
If the Nasdaq only moves sideways, that's good,
but if it declines, BTC could fall even more sharply.
Due to low participation, I decided to take a break this week,
but I've had some free time, so I'm sharing this with everyone for the first time in a while.
Please use my analysis for reference only.
I hope you operate safely, with a focus on principled trading and stop-loss orders.
Thank you.
JYAI/USDT NEW VOLUME THAT COULD MAKE IT 2XJYAI showing on the low time frame the first signal of new increase processing, this meme coin is able to do 2x when it stays in this range. on this reason tthere will be a follow.

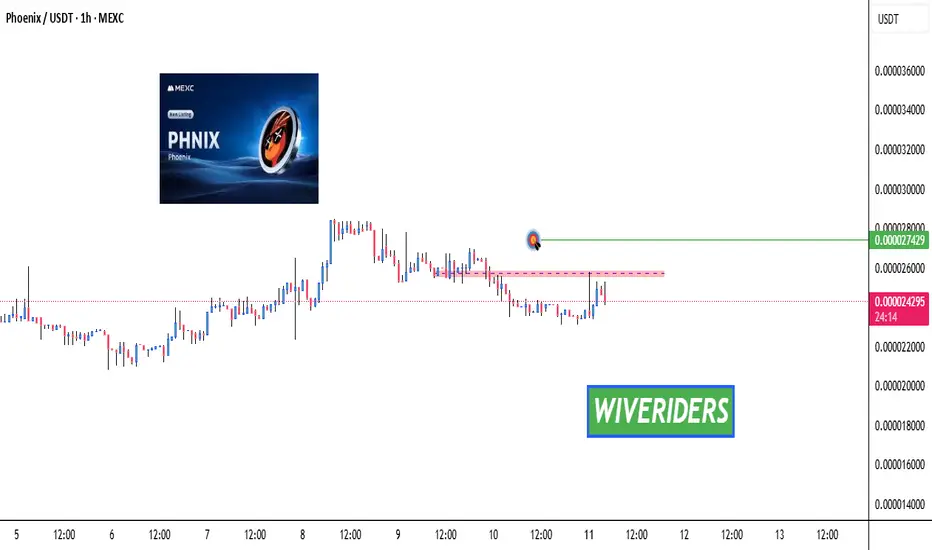
PHNIX Breakout Watch – Red Resistance Being Tested!🚨 PHNIX Breakout Watch – Red Resistance Being Tested! 🔴⏳
PHNIX is testing the red resistance zone.
📊 If breakout confirms, next move could target:
🎯 First Target → Green line level
A breakout could trigger bullish continuation and upside momentum.
Will MEXC hit $12 in this bull run?🚨 NYSE:MX (MEXC) Looks Ready to Explode 🚨
Since 2018, MX has been forming clean HH & HL on the HTF.
Now it's approaching another potential Higher High — and if this plays out…
👉 $12 is on the table.
Structure is king. Bullish momentum is real.
⚠️ Only invalidation? Below $0.77 (CHoCH zone).
So here’s the real question:
Will NYSE:MX hit $12 next… or break the entire bullish structure?
Drop your thoughts 👇
NFA & DYOR

July 22 Bitcoin Bybit chart analysisHello
It's a Bitcoin Guide.
If you "follow"
You can receive real-time movement paths and comment notifications on major sections.
If my analysis was helpful,
Please click the booster button at the bottom.
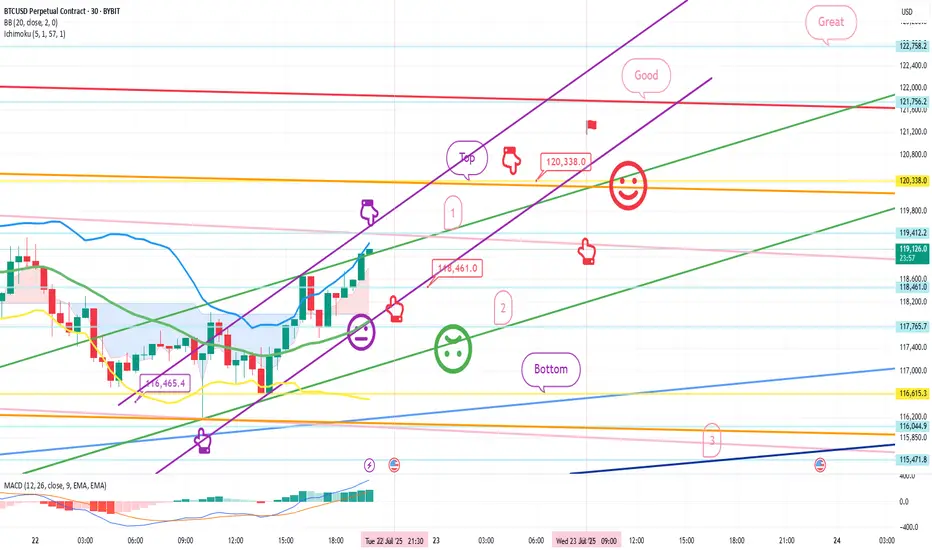
This is Bitcoin's 30-minute chart.
Nasdaq indicators will be released at 9:30 in a little while.
Although Bitcoin's mid-term pattern is broken,
it looks like a strong upward trend based on signals and candlestick positions.
In the case of Nasdaq, the 6-hour and 12-hour charts MACD dead cross is in progress,
and even if there is no plunge and only a sideways movement,
it seems likely that today's strategy will be successful.
In the bottom left, from the analysis article on the 18th,
the final long position entry point of $116,465.4 Bottom
is connected as is.
*Red finger movement path
One-way long position strategy
1. $118,461.9 long position entry section / green support line breakout, stop loss price
2. $120,338 long position 1st target -> Good, Great in order of target price
See the 1st section at the top as a touch section for an upward wave rather than a short position entry,
and if this section breaks through right away, an upward trend can be connected.
If the purple parallel line support line is maintained without breaking away,
there is a possibility of a vertical rise.
If the top section is touched,
after the first liquidation,
it would be good to use the 1st section to re-enter a long position.
The 2nd section at the bottom is important,
and if it is pushed to this section according to the movement of Nasdaq today,
it can fall strongly.
Please check the real-time support line shape.
From the breakout, Bottom -> 3 sections are open.
If you touch the 3rd section after tomorrow, the mid-term pattern will be restored.
This is the 12+ day section.
Up to this point, I ask that you simply use my analysis for reference and use only.
I hope that you will operate safely with the principle of trading and stop loss.
Thank you.