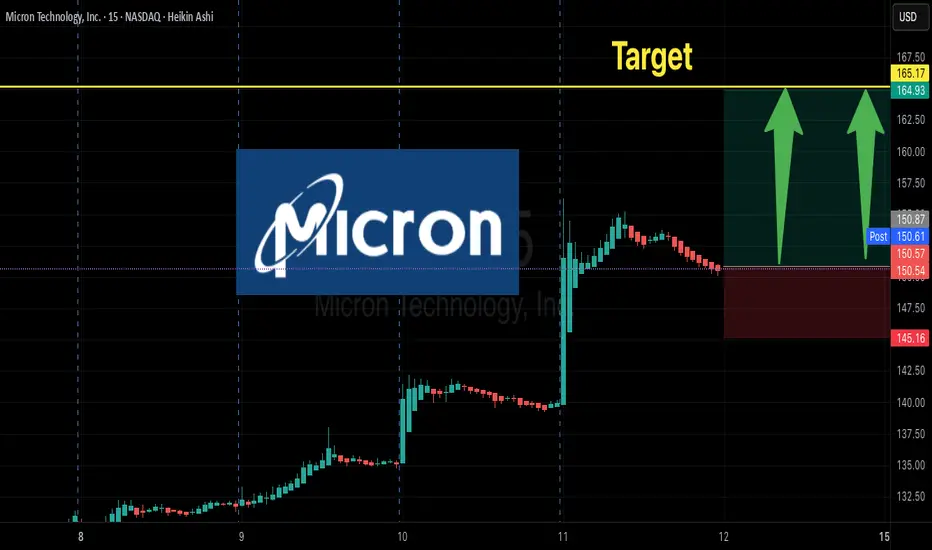
MU LEAP Alert: $165 Call Poised for Multi-Month Run!
🚀 **MU LEAP ALERT – \$165 CALL**
**Target:** 200% Premium 💎 | **Stop:** \$16.25 🛑 | **Entry:** \$25.00 ⏰
💡 **Thesis:**
* AI + Memory Cycle Recovery 🔋💻
* Weekly RSI \~77 → Strong momentum 📈
* Low VIX (\~15) → Perfect for long-term LEAPs 🌟
* Institutional volume spike supports upside 🔥
🎯 **Trade Details:**
* **Instrument:** MU
* **Direction:** CALL (LONG)
* **Strike:** \$165
* **Expiry:** 2026-09-18
* **Entry Price:** \$25.00
* **Profit Target:** \$75 (200% Gain)
* **Stop Loss:** \$16.25 (35%)
* **Size:** 1 Contract
* **Confidence:** 75% ✅
* **Entry Timing:** Market Open ⏱️
⚠️ **Risks / Notes:**
* Overbought RSI → potential pullback ⚡
* Sector correlation → weakness can affect MU 🏭
* Weekly monitor & partial profit-taking recommended 🪙
💥 **Action Plan:**
1️⃣ Buy at open \$25.00 (or use limit at ask)
2️⃣ Partial exit at +100% premium
3️⃣ Trail remainder toward +200% target
4️⃣ Exit if weekly closes < \$147
🔥 **High-Conviction, Long-Term Bullish Play!**
\#MU #LEAP #OptionsTrading #AI #TechStocks
Micronlong
MU $135 Call Swing – Momentum + Low VIX Edge!
🚀 **MU Swing Alert! \$135 Call Play 💎📈**
💡 **Momentum + Low VIX → Short-Term Bullish Swing Opportunity!**
**Trade Snapshot:**
* **Instrument:** MU
* **Strategy:** Buy Call (single-leg, naked)
* **Strike:** \$135
* **Expiry:** 2025-09-19 (12-day swing)
* **Entry Price:** \$2.97 (ask at open)
* **Profit Targets:** \$4.46 (+50%) initial, \$5.94+ (+100%) secondary
* **Stop Loss:** \$1.79 (\~40% of premium)
* **Size:** 1 contract
* **Confidence:** 70%
**Rationale:**
* 🔹 Daily RSI 71.4 → bullish momentum
* 🔹 Multi-timeframe positive returns → short-term upside probability
* 🔹 Low VIX → favorable for momentum swing trades
* 🔹 Preferred strike \$135 balances leverage & probability
**Key Notes:**
* Entry at market open; consider slight limit inside ask if desired
* Tight stop & defined profit targets to manage risk
* Max hold: exit by 2025-09-17 unless momentum confirms continuation
* Watch for low volume → could reduce move reliability
📊 **Summary:** Models converge on \$135 call as the optimal swing trade with 12-day horizon. Favorable technicals + low VIX + manageable risk make this a high-probability momentum play.

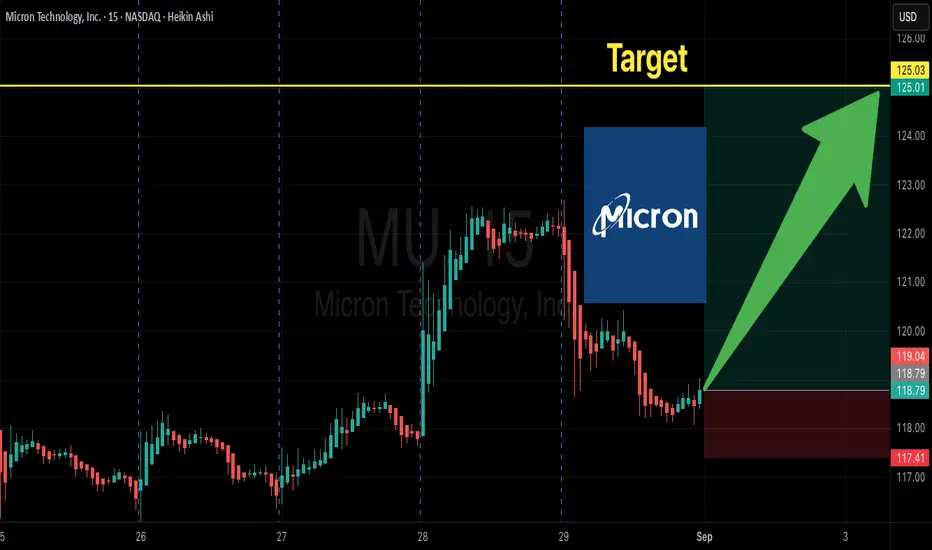
Smart Money Flow into $MU Calls – Earnings Week Opportunity
# 🚀 MU Earnings Play (Aug 31 – Sep 5) 🚀
💎 **Moderate Bullish | 65% Conviction** 💎
🎯 **Trade Setup**
📊 **Ticker**: \ NASDAQ:MU
🔀 **Direction**: CALL 📈
🎯 **Strike**: \$125.00
📅 **Expiry**: 2025-09-05
💵 **Entry**: 0.68 (ASK)
📦 **Size**: 1 contract (risk 💸 \$68)
🛑 **Stop**: 0.34 (−50%)
🎯 **Target**: 1.36 (+100%)
⏰ **Timing**: Market open 8/31 → exit by 9/4 (Thu)
⚡ **Why Bullish?**
* 📈 RSI strong on weekly (68.7); neutral daily (52.3) → upside potential
* 🔥 Options flow: C/P ratio 1.23, heavy \$124–125 call action
* 🧘 Low VIX (\~15) → cheap premium, low gamma risk
* 🤖 Consensus from 5 AI models = **Moderate Bullish**
✅ **Plan**: Buy ONLY if MU holds above **\$120** w/ healthy opening volume. Cut fast if <\$120.
---
### 📌 Suggested Tags
\#MU #Micron #EarningsPlay #OptionsTrading #CallOptions #WeeklyOptions #BullishSetup #MomentumTrading #TradeIdeas #StockMarket 🚀📊
MU Momentum Play – $130 Calls in the Crosshairs!🚀 MU Swing Trade Setup – Riding the Momentum!**
**Moderate Bullish Bias | Aug 13, 2025**
**📊 Key Highlights:**
* **RSI:** Strong – Multi-timeframe momentum confirmed ✅
* **Volatility:** Low – Ideal for swing plays
* **Volume:** Weak ⚠️ (watch for fakeouts)
* **Options Flow:** Neutral – Institutions not leaning heavy yet
* **Resistance:** \$129.73 (52-week high)
---
**💡 Trade Plan:**
* **Type:** Aug 29 ’25 \$130 CALL
* **Entry:** \$2.45 (at open)
* **Stop Loss:** \$1.47 (-40%)
* **Target:** \$4.90 (+100%)
* **Confidence:** 72%
---
**⚠️ Risk Factors:**
* Weak volume could stall breakout
* Neutral options sentiment – big money still on the sidelines
* Pullback risk if price fails to hold above support
---
📆 **Signal Time:** 2025-08-13 12:28 EDT
💎 **Execution:** Buy calls at open, scale out at target
---
\#MU #SwingTrade #OptionsAlert #CallOptions #NASDAQ #BreakoutTrade #MomentumStocks #StockMarket

Micron Technology (MU): AI Powerhouse Trading at a 40% Discount!1️⃣ AI Boom: Micron’s advanced DRAM and NAND solutions are fueling growth in AI and cloud computing, with Nvidia’s ecosystem showcasing its critical role.
2️⃣ Analyst Targets: With 42 ratings averaging $131.47 and highs of $150, Micron offers over 50% upside from current levels.
3️⃣ Automotive Growth: As the top memory supplier for autonomous vehicles, Micron dominates a market set to grow at a 27% CAGR.
4️⃣ Technical Momentum: Breaking $75 resistance, a golden cross and rising volume confirm strong bullish signals.
💹 Trade Setup:
TP1: $100
TP2: $110
TP3: $120
SL: $80
Micron is a top-tier AI play at a deep discount. With massive growth catalysts, it’s primed to soar! 🚀

Micron Technology: Scraping the Barrel Micron Technology
Short Term - We look to Buy at 66.22 (stop at 65.18)
We look to buy dips. Previous support located at 66.00. Although the anticipated move higher is corrective, it does offer ample risk/reward today. We therefore, prefer to fade into the dip with a tight stop in anticipation of a move back higher.
Our profit targets will be 73.13 and 74.49
Resistance: 74.00 / 86.00 / 96.00
Support: 66.00 / 61.00 / 42.00
Disclaimer – Saxo Bank Group. Please be reminded – you alone are responsible for your trading – both gains and losses. There is a very high degree of risk involved in trading. The technical analysis, like any and all indicators, strategies, columns, articles and other features accessible on/though this site (including those from Signal Centre) are for informational purposes only and should not be construed as investment advice by you. Such technical analysis are believed to be obtained from sources believed to be reliable, but not warrant their respective completeness or accuracy, or warrant any results from the use of the information. Your use of the technical analysis, as would also your use of any and all mentioned indicators, strategies, columns, articles and all other features, is entirely at your own risk and it is your sole responsibility to evaluate the accuracy, completeness and usefulness (including suitability) of the information. You should assess the risk of any trade with your financial adviser and make your own independent decision(s) regarding any tradable products which may be the subject matter of the technical analysis or any of the said indicators, strategies, columns, articles and all other features.
Please also be reminded that if despite the above, any of the said technical analysis (or any of the said indicators, strategies, columns, articles and other features accessible on/through this site) is found to be advisory or a recommendation; and not merely informational in nature, the same is in any event provided with the intention of being for general circulation and availability only. As such it is not intended to and does not form part of any offer or recommendation directed at you specifically, or have any regard to the investment objectives, financial situation or needs of yourself or any other specific person. Before committing to a trade or investment therefore, please seek advice from a financial or other professional adviser regarding the suitability of the product for you and (where available) read the relevant product offer/description documents, including the risk disclosures. If you do not wish to seek such financial advice, please still exercise your mind and consider carefully whether the product is suitable for you because you alone remain responsible for your trading – both gains and losses.

A Bullish View For MUIn both cases a bullish rising wedge is evident, while with a climb and transition through 2.618
I have made Bearish posts for MU based on this Rising Wedge pattern but now I can view it as in a bullish state due to the prior rising wedge and how it acted
Weekly Chart

MU Rising Wedge BreakdownMU is within a rising wedge
Rising wedges are a bearish indicative pattern
I am suggesting a collapse down to a stronger area of support to manage this rising wedge
The other scenario is that this rising wedge breaks out to the bullish side, but for the consistency of chart pattern expertise we will stay with the bearish approach, which is considered appropriate.

MU: Can the trendline hold?Gapped down and broke out of the channel yesterday.
However, the longer term up trendline + horizontal line supported the price. The big volume looks like it has exhausted all the sellers as well.
Since on a longer term MU is still in an uptrend, let's see if we can get a bounce up back to close the gap for a nice 2.5 R/R
Disclaimer: I'm not giving any trading and investing advice. I'm just sharing my chart observations.
If you have any symbols that you'd like me to analyze, feel free to drop me a comment.
