Microsoft IS GOING UP [Smash That Like Button]Microsoft is on the uptrend it will continue to go up .I suggest to get BUY A BIG position in Microsoft .If you need any help about any stock please contact me i will be glad to help.Don't forget to follow me.
Microsoft

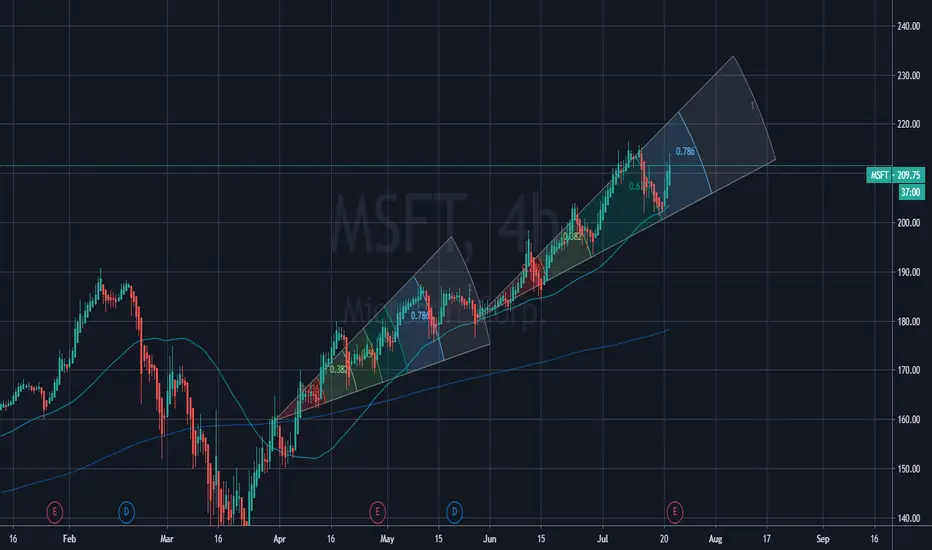
Microsoft: Rebound on the 1D MA50. Targeting $217-230.MSFT made a (near) rebound on the 1D MA50. Even though the 1D chart is technically neutral mostly (RSI = 49.013, MACD = 2.140, ADX = 33.401), the RSI is providing the first strong Buy Signal since March, as it entered the 41.50 - 48.00 Buy Zone. That was a strong accumulation region from August 2019 to October 2019, so even though the price may drop some more and touch the 1D MA50, we take this as a strong buy opportunity.
We aim at the completion of a +40% extension from the last time the price made contact with the 1D MA50 (early April 2020), and set our Target Zone at 217 - 230.
** If you like our free content follow our profile to get more daily ideas. **
Comments and likes are greatly appreciated.


Buy MSFT (Microsoft) 21-7-2020Hello every one
Microsoft's stock is moving upward in the short term.
Rebounded from the 34 moving average higher.
With high volume.
So the purchase can be made.
Target 233.7
Stop loss 200.9
Good luck

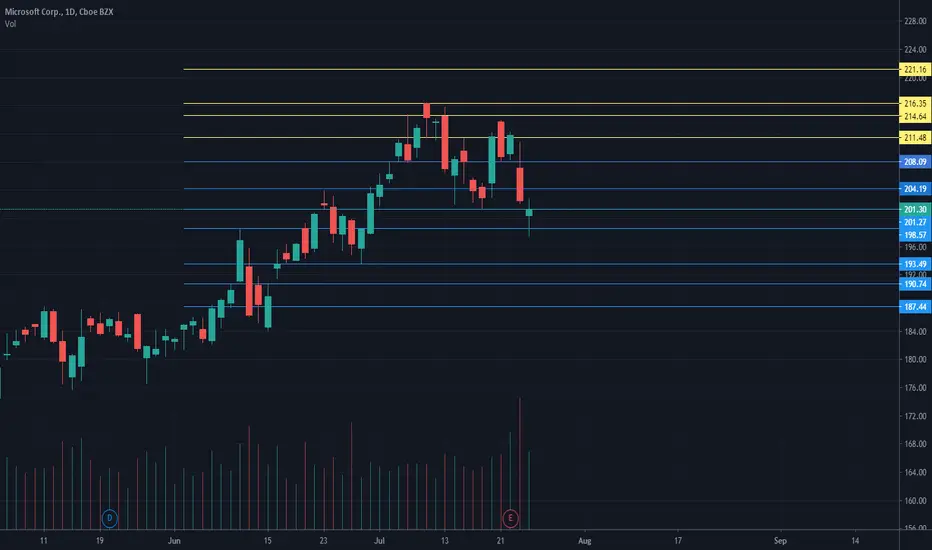
$MSFT has peaked$MSFT reached the high and a top of the steep resistance line 218 then fiercely broke the rising trendline and triangle consolidation making a strong case for the downside reversal sand a test of 190 for a complete breakout. Remember losing strength here is not a good sign for bulls as well as this selling pressure and rejection.


Short opportunity on MICROSOFTOur view on this Stock for today
Entry 214
SL 216.2
TP 209
----
Stay connected with us for further trades
Trading Kitchen


Buy Zone and Target for Microsoft $MSFTWhat i think $MSFT will do in upcoming days.
(Not financial advice)

[$WAVES] Do you wanna ride the Waves with me ? Version Francaise & English Version below
Version Francaise
Bonjour à tous,
Aujourd'hui, je vous propose un éclairage sur le projet Waves
Waves est une plateforme de blockchain que vous pouvez utiliser pour créer votre propre jeton personnalisé. Selon leur site Web, vous pouvez créer votre propre jeton en une minute seulement. Waves comprend également un échange décentralisé, DEX, dans lequel vous pouvez échanger votre pièce nouvellement créée dans une paire de négociation avec n'importe quel autre jeton Waves.
Récemment, Waves a conclu un partenariat avec Microsoft pour baser leur blockchain sur Azure ( azure.microsoft.com)
D'un point de vue technique, en 3 Jours, nous avons un set up interessant puisque le prix est sortie d'une structure d'accumulation avec un volume important et le prix s'établit au dessus du nuage d'Ichimoku ( la lagging span est à surveiller car en cours de passer la précédente figure de consolidation ( triangle). Une cloture au dessus serait un signal d'achat fort.
Les différents niveaux de surveillance sont notés sur le chart.
Comme toujours, on reste prudent puisque nous venons de butter à deux reprises sur la résistances 3 Jours.
Stay Safe, Trade Safe,
PEACE
---
English Version
Good morning, everyone,
Today, I'd like to shed some light on the Waves project...
Waves is a blockchain platform that you can use to create your own custom token. According to their website, you can create your own token in just one minute. Waves also includes a decentralized exchange, DEX, in which you can exchange your newly created coin in a trading pair with any other Waves token.
Recently, Waves has partnered with Microsoft to base their blockchain on Azure ( azure.microsoft.com ).
From a technical point of view, in 3 Days, we have an interesting set up since the price has broken out of an accumulation structure with a large volume and the price is established above the Ichimoku cloud (the lagging span is to be watched because in the process of passing the previous consolidation figure (triangle). A closing above would be a strong buying signal.
The different levels of monitoring are noted on the chart.
As always, we remain cautious since we have just hit the 3 Days resistance twice.
Stay Safe, Trade Safe,
PEACE
WLong

MSFT - EARNINGS...!Microsoft - MSFT - Earnings.
We have earnings this week, had a beautiful bullish channel will we break to the lower time down or continue the bullish momentum...It's at an interesting area on a technical view as well.
Add alerts, take which ever price action takes you.
Remember: Just a trade idea, not a recommendation.
All the best.

Looking Good ***IDEA***Microsoft Is looking to make a move this week, Its in the bottom of the regression trend and in its 204 - 202 support zone, looking to see the move to around 208, earning i believe will be good, i mean come on its microsoft... but looking good on the macd, Rsi is low and stoch rsi made the turn up. Lets see what happens. This is kind of a continuation of my idea from last week. *JUST A IDEA* Looking for move up to $220!!! Fingers Crossed!


MSFT Earnings Expected Move (Iron Condor Inside)MSFT's earnings announcement is on Wednesday, July 22 AMC.
Based on an analysis of the previous earnings move, the expected move for the upcoming earnings (from MarketChameleon), and by considering some major support points on the daily chart, my expected move for the upcoming earnings is between $190.91 and $214.85.
For earnings plays, I like to play Iron Condors for credit and I always enter the trade 1-2 hours before earnings. Since MSFT's earnings will be on Wednesday, July 22 (After Market Close), I will enter a trade on Wednesday 1-2 hours before market close (IV at its peak), and I intend to close this trade on Thursday at market open (IV crush).
My tentative Iron Condor (L185P, S190P, S220C, L225C) - This can change by Wednesday based on the stock movement until then.
Max Profit: $97
Max Loss: $403
As you can see, this trade is low delta, high probability to expire OTM, low profit, but safe.

Bullish CHarts - Undervalued, $1.1 B in Sales, 97.3K New UsersEndurance International Group Holdings, Inc., together with its subsidiaries, provides cloud-based platform solutions for small-and medium-sized businesses in the United States and internationally. The company operates in three segments: Web Presence, Domain, and Email Marketing. It offers Web hosting services, including entry-level shared hosting, and virtual private server and dedicated hosting solutions; Website building tools; domain registration, management, and resale services; malware protection solutions to protect subscribers' Websites from viruses, malicious code, and other threats; and backup control solutions that enable subscribers to schedule, maintain, manage, and restore backups of their online data and Websites. The company also provides email marketing solutions that enable subscribers to communicate with their customers and potential customers through email; products that enables subscribers to sell their products and services online, including secure and encrypted payments, shopping carts, inventory management, online marketplace listing solutions, payment processing and related services, and mobile payments; and search engine optimization and marketing solutions. In addition, it offers solutions that allow subscribers to have their Websites and email marketing campaigns rendered on mobile devices; tools and services that enable subscribers to communicate with their customers and potential customers through social networks; business productivity tools that include professional email, word processing and presentation software, online storage, shared calendars, and video meetings; control panels and dashboards that offer subscribers with tools to analyze activity on their Websites; and professional services, including Website design, marketing, social media management, and Website migration services. The company was founded in 1997 and is headquartered in Burlington, Massachusetts.
Many traders may not realize, this company owns some prominent & well known assets including CONSTANT CONTACT, BLUEHOST, HOSTGATOR & DOMAIN.COM among others.
Many of these services we all use on a daily basis.
On 07/14/20, Endurance announced Prelim. Q2 Sales of $274 Million, Net Subscriber Additions of 97,3K, and FY20 Sales of $1.1 BILLION
On 07/15/20, Credit Suisse Lifted the price target on Endurance to $9.00 - (I think this is very conservative especially after seeing the assets the company owns)
The Daily Chart looks BULLISH
50-Day MA is about to cross up and over the 200-Day MA, BULLSIH
Volume is Green, Bullish
PMO is Bullish
MACD is Bullish
RSI is Bullish
Stochastic is Bullish
OBV is Bullish
Accumulation is Bullish
Folks, if you look back at our previous research picks, we've made a lot of great calls. Look at APT, WRTC & SPCE today, to name a few. We think this stock is worth at minimum, $15 to $20 a share after looking at the assets they own.
We think the assets are worth more than the stock price right now. CONSTANT CONTACT, BLUEHOST & HOSTGATOR are very well known in the technology industry.
Long!
DISCLAIMER
The Content herein is for informational purposes only, you should not construe any such information or other material as legal, tax, investment, financial, or other advice.
ELong

Microsofts top will be in within a month or soGoing to be a miraculous crash when it goes down. Till then better start getting out! Not worth the +20-30% to get an -80% instead.
NEVER chase tops. Specially not in these market conditions.

