How to turn $100 into $1,000,000 through trading?
The answer — You can’t..
Yes, theoretically you can imagine a chain of unbelievable coincidences, aggressive risk-taking, and pure luck. But in reality, that path almost always ends with a blown account long before any meaningful growth happens.
However, most people who enter this field genuinely believe they’ll be the exception. They’re convinced it will work out for them. Social media plays a big role in this — the way trading is presented: a glamorous lifestyle, freedom, expensive cars, travel, and supposedly all you have to do is press “buy” or “sell.”
✨ It creates the illusion of simplicity.
But the market isn’t a button. It’s competition.
Chasing massive returns, people start trading low-liquidity, questionable assets. They increase leverage, go all-in on their account, ignore stop losses. Risk management turns into a myth told by some crazy guy on the street, and their mental state starts resembling that same person preaching about discipline. Every trade becomes a casino bet.
🎢 First comes excitement.
😎 Then euphoria from a random win.
😤 Then aggression after a loss.
🎰 And finally — the urge to “win it back.”
And that’s exactly when the account starts melting the fastest.
💡 The truth is, a successful trader isn’t someone who makes 100x in a month.
A successful trader is someone who earns consistently.
Generating 10–14% per month with proper risk management is an extremely strong result. Most professional fund managers don’t even come close to delivering that consistently over time.
💰 With a $300,000 account — that’s a solid income you can live on.
🍦 With $100 — that’s ice cream money. And that’s okay.
📌 Now the important part.
If you want to start trading and you have $300 — great. Set it aside. But treat it not as a “life-changing opportunity,” but as tuition.
A small account should not be a gambling tool.
It should be a discipline-building tool.
It should be a system-testing tool.
It should be a habit-forming tool.
With a deposit like that, you learn to:
• respect risk per trade;
• accept losses calmly;
• avoid increasing size after a loss;
• stay out of the market when bored;
• follow rules even when emotions scream otherwise.
📈 If you can’t trade $300 consistently and with discipline, you won’t trade $30,000 successfully either. Not only profits scale — mistakes scale too.
❗ And if you quit your job with a $300 account to “fully dedicate yourself to trading,” you should probably go back.
Trading doesn’t like pressure.
When you need to pay rent, cover loans, and buy food, you start making decisions out of fear instead of following your system.
⚖️ And fear and the market are a bad combination.
First — stable income outside the market.
Then — stability on a small account.
Then — capital growth.
Enjoy!
Millionaire

DXY Rejection from Premium Zone | USD Weakness AheadHello Billionaires!!
The US Dollar Index (DXY) is showing signs of exhaustion after tapping into the FVG + Order Block within the premium zone.
We’ve also confirmed a Market Structure Shift (MSS) to the downside — signaling a potential short-term reversal.
📊 Analysis Breakdown:
FVG & OB confluence near 98.90 🧠
MSS indicates bearish intent ⚡
Targeting buying zone around 98.30 area 🩸
This scenario supports USD weakness, aligning with potential bullish moves in EURUSD, GBPUSD, and AUDUSD.
💡 Trade Plan:
DXY → Short bias below OB
USDJPY → Short setup favored
EURUSD, GBPUSD, AUDUSD → Look for long setups
Smart Money likely engineered liquidity above before pushing price lower to rebalance inefficiency.

AUDUSD | Bearish Rejection from Order Block – Target doneHello Billionaires!!
In AUDUSD just delivered a clean Smart Money bearish setup — rejecting from the FVG + Order Block (OB) zone in premium pricing.
After taking the Buy Side Liquidity (BSL), price shifted structure and is now aggressively heading toward the BPR & SSL zone below.
Every pullback is now a chance for Smart Money to sell at premium levels 🚀
📊 Market Storyline:
BSL taken, confirming liquidity grab ✅
FVG + OB rejection in premium ✅
Structural shift to bearish order flow ✅
Target → SSL liquidity zones ✅
Smart Money stays one step ahead — retail still looking for longs 😏
#AUDUSD #AliyanFX #SmartMoneyConcepts #ICT #PriceAction #Liquidity #FVG #BPR #OB #SMC #Forex #TradingViewIdeas

Bitcoin Breakdown | BPR Rejection Could Trigger Deep Sell-OffHello Billionaires!!
We All know that BTCUSD is showing classic Smart Money Distribution after a clean BPR rejection in the premium zone.
Price swept the Buy Side Liquidity (TS) and tapped into the BPR, confirming bearish order flow. Now, we’re likely to see a continuation down toward the FVG & OB below 106K–102K, targeting the SSL zone.
📉 Smart Money Storyline:
BSL taken ✅
BPR tapped (Premium Delivery) ✅
Bearish continuation setup forming 🔥
Possible drawdown into FVG & OB before new accumulation
💡 If BTC holds below the BPR zone, expect strong downside liquidity runs in the coming days.
#BTCUSD #AliyanFX #SmartMoneyConcepts #ICT #PriceAction #Liquidity #BPR #OB #FVG #Forex #TradingViewIdeas #CryptoAnalysis

EURUSD | BSL Sweep → Bearish Delivery to BPR Target Almost DoneClean Smart Money move — BSL taken, structure shifted, and price delivering straight toward BPR.
After rejecting from the FVG in premium, EURUSD followed a textbook bearish model, aiming for the SSL & BPR zone below.
DXY strength confirms the bearish momentum continuation 📉
📊 Key Points:
BSL liquidity grab ✅
Bearish FVG in premium zone ✅
Structure shift & bearish delivery ✅
Target → BPR / SSL zone 🎯
Smart Money in full control — patience pays 🧠💰
This setup aligns with the DXY bullish projection, confirming inverse correlation and directional confluence.
#EURUSD #AliyanFX #SMC #ICT #PriceAction #Liquidity #FVG #BPR #Forex #TradingViewIdeas

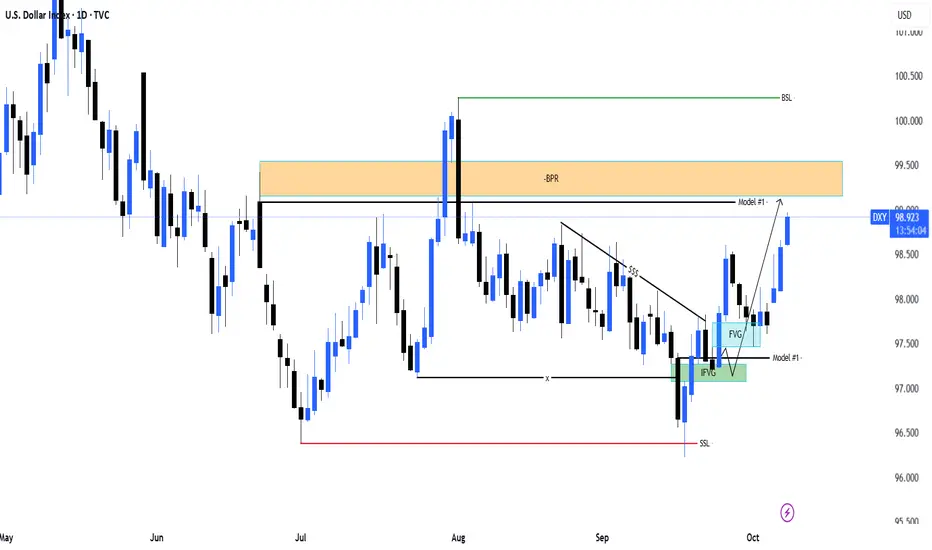
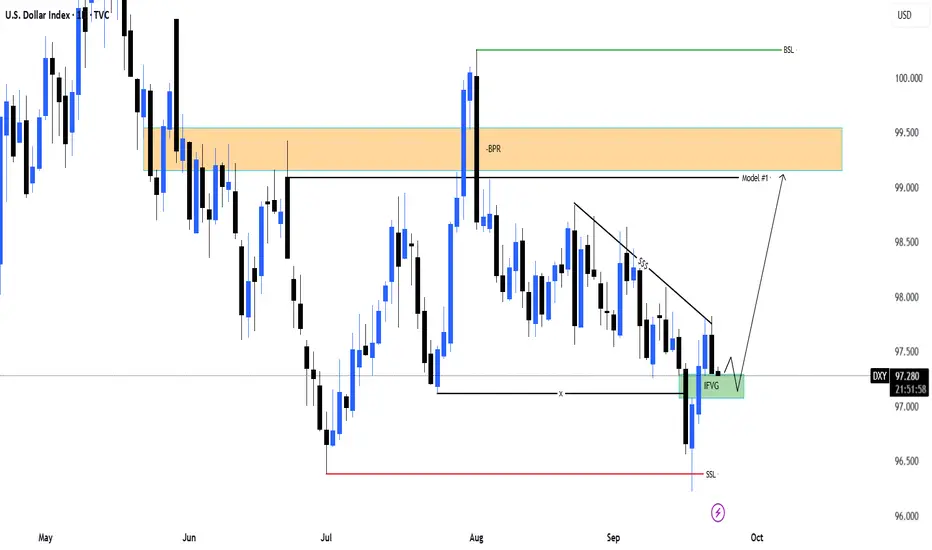
DXY Target Achieved | Smart Money Model #1 Playing Out PerfectlyHello Billionaires!!
In DXY D1 Projection we know the bullish projection on DXY played out exactly as expected.
Price swept the short-term sell-side liquidity (SSL), filled the IFVG, and then launched upward through the FVG, completing the Model #1 structure.
Currently, price is trading inside the BPR (Balanced Price Range), showing that the target zone has been successfully reached.
🧠 Smart Money Logic:
SSL sweep → Market Structure Shift
IFVG + FVG = Strong Reaccumulation
Price delivered to BPR (Premium Zone)
Model #1 completion confirms bullish delivery
Now I’ll be watching for potential reaction or retracement from this premium zone before the next move develops.
#DXY #SmartMoneyConcepts #PriceAction #ICT #Forex #Liquidity #BPR #FVG #IFVG
GBPNZD – Supply Rejection & Bearish Play Setting UpHello Billionaires!!
In GBPNZD H4 Projection..
We know Price has tapped into the Fair Value Gap (FVG) after a recent Break of Structure (BOS). Price is reacting from a key supply zone, signaling possible weakness ahead.
🔑 Technical Outlook:
Supply Zone (FVG) acting as rejection
Liquidity below SSL as potential draw on price
Bearish structure forming after SMT + MSS confirmation
📉 Projection:
Expecting a short-term pullback into FVG → continuation lower → liquidity sweep below 2.2950, with extended targets toward 2.2800 zone.
Bias: Bearish until price invalidates supply.
⚠️ Educational Idea only – Not financial advice. Always manage your risk.

Gold (XAUUSD) | Bullish Continuation from OB + FVG ZoneHello Billionaires!!
As you can see Gold continues to show strong bullish momentum, respecting both Order Block (OB) and Fair Value Gap (FVG) zones on the 4H timeframe. After internal structure shifts and multiple FVG fills, price is expected to retrace slightly to the OB–FVG confluence before continuing higher.
🔹 Key Highlights:
Price respecting bullish structure on 4H
OB + FVG confluence acting as demand zone
Clean displacement shows institutional interest
Expecting continuation toward new highs if bullish structure holds
Smart money maintaining control — watching how price reacts at the retracement zone for potential long re-entries.

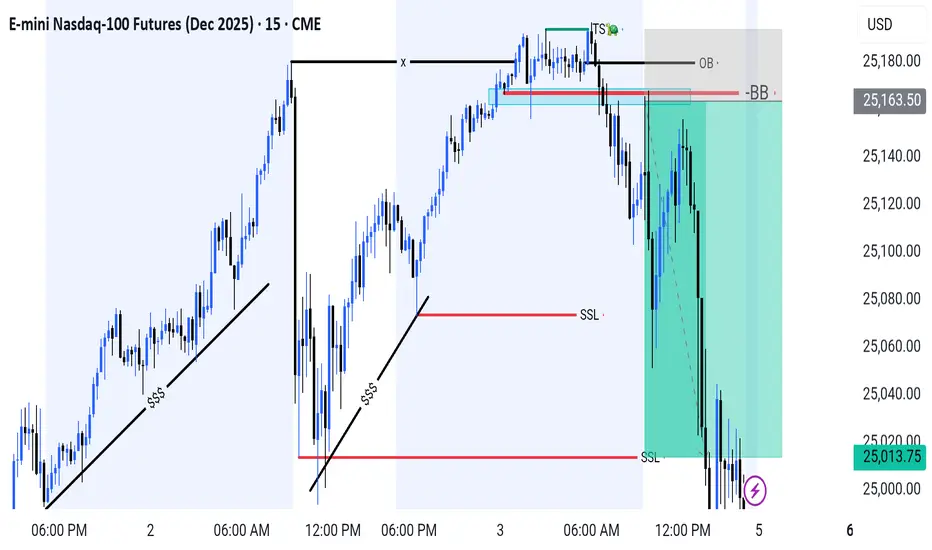
Nasdaq-100 | Textbook OB Rejection SSL Target Hit.Price swept the internal liquidity (TS 🐢) and tapped into a premium Order Block (OB), showing clear signs of rejection. This confirms a potential shift in market structure with bearish momentum building up. Alhumdulillah Target Hit✅️
🔹 Key Points:
Buy-side liquidity (BSL) taken before OB mitigation
Strong rejection from OB + Breaker Block (BB) zone
Market structure shift confirmed on 15m
Targeting sell-side liquidity (SSL) below recent swing lows
As long as price remains below the OB, bearish continuation is expected. Watch for short setups aligned with internal structure breaks.
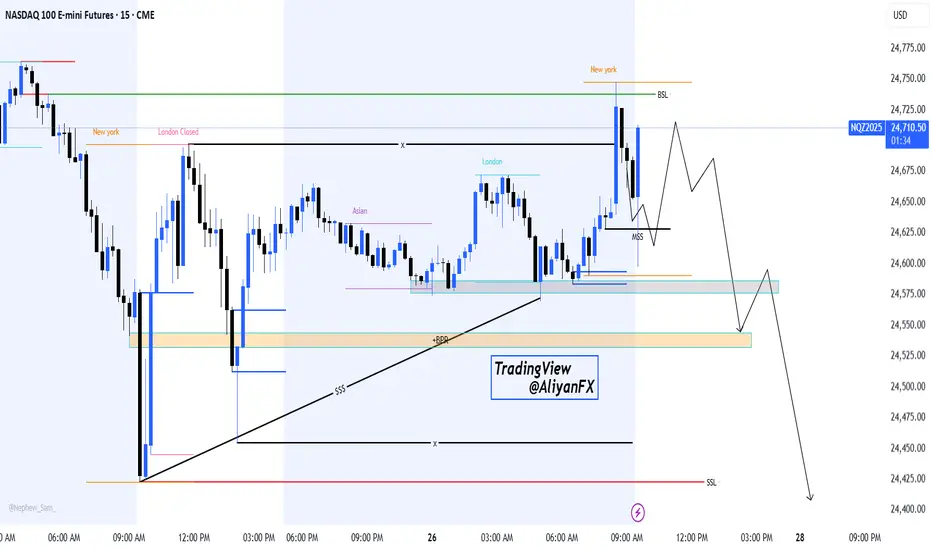
NASDAQ 100 – Potential Liquidity Grab & Bearish Continuation SetHello Billionaires!!
We All know that the Price has swept the New York session high (BSL) and is now showing signs of a potential market structure shift (MSS). If the short-term pullback holds, we may see a deeper retracement toward the demand zone (BPR + Asian range) before another leg down.
🔹Key Levels to Watch:
24,725 – 24,750: Liquidity grab zone (recent NY high)
24,575 – 24,550: Re-test area for possible continuation
24,500 – 24,450: Next downside target if bearish momentum continues
Bias: Short-term retracement followed by potential bearish continuation toward lower liquidity pools (SSL).
📌 This is an educational projection, not financial advice. Trade safe and always manage your risk!
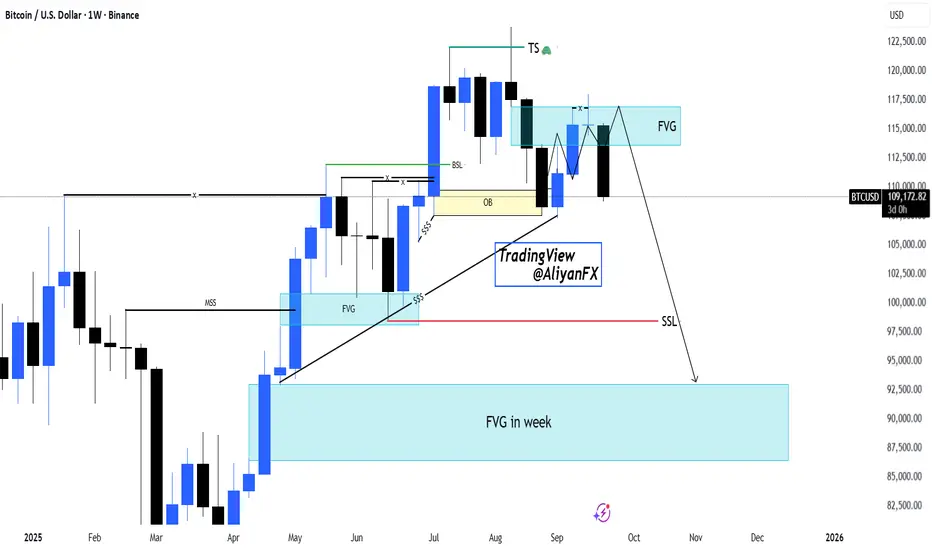
BTCUSD | Weekly FVG Rejection – Bearish Outlook Targeting SSLHello Billionaires!!
We All know that Bitcoin has tapped into a weekly Fair Value Gap (FVG) after sweeping Buy-Side Liquidity (BSL) and reacting from the Order Block (OB). Current price action shows rejection, suggesting bearish continuation.
🔹 Key Points:
BSL swept, confirming liquidity grab.
Price rejected from FVG + OB zone.
Short-term structure break hints at downside momentum.
Targeting Sell-Side Liquidity (SSL) and the weekly FVG demand zone around 90,000 – 92,000.
Outlook remains bearish unless price reclaims and sustains above the FVG rejection zone.
GBPAUD | Liquidity Grab Before Premium Supply – Target DownsideHello Billionaires!!
GBPAUD has reacted from the discount POI/Order Block and is now pushing higher to capture remaining upside liquidity. However, the move is likely corrective before tapping into premium supply zones.
🔹 Key Points:
Price rebounded from discount OB, fueling short-term bullish momentum.
Remaining upside liquidity suggests a push into IFVG and Volume Imbalance areas.
Once premium supply is mitigated, bearish reversal is expected.
Downside targets align with FVG and Order Block rebalancing below 2.0300.
Outlook remains bearish after liquidity grab, with a sell setup once price reaches the premium imbalance zone.

NZDUSD | Bearish Trap Above OB – Targeting Weekly Order BlockHello Billionaires!!
In NZDUSD D1 Projection we know the Algorithm has completed its supply move and created a failed Order Block trap for retailers. Price is now rejecting from the Fair Value Gap (FVG) and short-term OB, signaling potential downside continuation.
🔹 Key Points:
Supply zone already mitigated, confirming distribution.
OB + FVG acted as liquidity trap for retail longs.
Price likely to break lower and head towards the weekly Order Block around 0.5650.
BPR support zone aligns with downside continuation.
Bias remains bearish as long as price stays below the OB/FVG zone.

DXY | Bullish Reversal from IFVG – Targeting 99.50 Supply ZoneHello Billionaires!!
In DXY D1 Projection we know The US Dollar Index has tapped into the Imbalance/Fair Value Gap (IFVG) and shown signs of bullish reaction after sweeping Sell-Side Liquidity (SSL). This aligns with a potential reversal model aiming towards higher liquidity levels.
🔹 Key Points:
SSL swept, confirming liquidity grab.
Price reacting from IFVG as demand zone.
Short-term retracement expected, followed by continuation.
Targeting the BPR supply zone around 99.50 and eventually Buy-Side Liquidity (BSL) above 100.00.
As long as DXY holds above the IFVG zone, bullish continuation remains the primary outlook.
AUDUSD | Bearish Rejection from Order Block – Targeting Sell-SidHello Billionaires!!
In EURUSD D1 Projection we know the Price swept the Buy-Side Liquidity (BSL) and tapped into the Fair Value Gap (FVG) and Order Block (OB), showing signs of rejection. This aligns with Smart Money Concepts (SMC) for a potential bearish move.
🔹 Key Points:
Liquidity grab above recent highs (BSL).
FVG + OB acting as a rejection zone.
Price expected to target the Sell-Side Liquidity (SSL).
Balanced Price Range (BPR) around 0.6450 serves as a strong downside target.
Bearish bias remains valid as long as price stays below the OB/FVG zone.

EURUSD | Bearish Order Block Rejection – Targeting 1.1515Hello Billionaires!!
In EURUSD D1 Projection we know the Price has swept buy-side liquidity (BSL) and reacted from the Fair Value Gap (FVG) and Order Block (OB). Current rejection confirms bearish pressure, with expectations of price moving towards the sell-side liquidity (SSL) and the Balanced Price Range (BPR) around 1.1515.
🔹 Key Points:
BSL taken → liquidity grab complete.
FVG + OB confluence zone acting as resistance.
Expecting downside continuation towards SSL.
Risk-to-reward set at 1:3.
This setup remains valid as long as price holds below the FVG/OB zone.

TRUMPUSDt long turmA.o.A all,
Accroding to VSFA+ Trump is dump toO😯🤗, so becarefull & wait when price tuch 5.50$ then buy some Trump coins and ready for 1st pump near 10$ in sha Allah, after that i update whatscoming up next accroding to VSFA+ Golden stratgy 🇵🇰
. . . . . . . . . . . . . . . . . . . . .

DE40 H4 Analysis 23 Jul to 27 Jul - Bullish FlagDE40 Showing a bullish Flag 23,735 - 23,800. If it breaks this zone, Most probably can fly upto 24,466 and higher. Take your risk under control and wait for market to break support or resistance on smaller time frame. Best of luck everyone and happy trading.🤗

MAJOR SUPPORT AND RESISTANCE OF BTC BASED ON ORDER BLOCKSCurrent Price Action
Bitcoin is trading around $93,041, showing a consolidation pattern after recent price volatility.
The price action suggests Bitcoin is in a critical zone where traders are watching for directional clues.
Support Levels
$92,000 (Immediate Support):
This level has served as intraday support in recent trading sessions.
High trading volumes were observed near this level, suggesting strong buyer interest.
$90,000 (Psychological Support):
Round numbers like $90,000 act as psychological barriers.
Historically, Bitcoin has respected such levels during both upward and downward movements.
$88,500 (Technical Support):
This level aligns with previous consolidation zones and Fibonacci retracement levels (e.g., the 38.2% retracement from the recent rally).
$85,000 (Major Support Zone):
Represents a deeper correction level but remains a critical support based on long-term moving averages (e.g., the 50-day EMA).
Resistance Levels
$94,500 (Immediate Resistance):
Current trading activity shows selling pressure near this level.
Historically, it aligns with a minor peak from earlier price actions.
$96,000 (Strong Technical Resistance):
Close to the upper boundary of recent trading channels.
Converges with key Fibonacci levels (e.g., 61.8% retracement from the last major drop).
$98,000 - $100,000 (Major Resistance):
$100,000 is a significant psychological level for traders.
Breaking this level would signal a strong bullish trend, likely leading to new all-time highs.
Above $100,000:
If Bitcoin crosses $100,000, potential resistance zones could emerge at $105,000 and $110,000 based on historical extensions and trader sentiment.
Other Key Indicators
Moving Averages:
Bitcoin is trading above the 20-day moving average (~$91,500), which is a bullish signal.
The 50-day and 200-day moving averages (~$88,000 and $80,000, respectively) are major support zones.
Relative Strength Index (RSI):
RSI is near 60, indicating neutral-to-bullish momentum. A move above 70 could signal overbought conditions.
Volume Profile:
High trading volume around $92,000–$93,000 suggests significant activity, marking this as a key price region.
Summary
Supports: $92,000 → $90,000 → $88,500 → $85,000.
Resistances: $94,500 → $96,000 → $100,000.
Traders should watch for breakouts or breakdowns at these levels to determine the next price trend.

NZDUSD Technical ProjectionHello Billionaires !!!
This is our technical projection on NZDUSD
Focus on Buying side entries
Selling opportunities less due to demand
And Bias at SSL
GOOD LUCK TRADERS HAVE A WONDERFUL DAY

DOA trading Strategy - USDJPYGreen DOA sniper and meter are holding strong
Next impulsive wave can hit 143 (600+ pips)

EURNZD LONGSPrice double bottomed at the 50% fib level and 1.8300 psych level. Price is moving already but has clear indication to the upside. Target is -27 fib

Continuation towards the upside?Risky EOM & EOY trade. Looking for a continuation towards the upside. Price looks like it's rejecting off the H4 SNR zone with a trendline and psych level as confluence
