MINA USDT imminent bullish formation breakout Really interresting formation, Big breakout followed by lower high / lower low with lower volume. It's clearly a continuation pattern.
We can expect a really imminent breakout
MINA

MINA DIAMOND PATTERN PLAYING OUT!MINA playing out well with the DIA MOND TOP.
I will be buying at lower Buy Zones as displayed.
NOTE - About 30 of my other charts have hit targets, I have up to 100 but I cannot track them all alone lol ;-)

alt seasons has been started ?! the resistance line is broken to the upside if this candle close like this so we should wait until this candle has been completely closed and then we could buy altcoins .
my favorites altcoins is
chia
mina
polk
kyl
kvl
atari
dot
fil
pdex
kin
all of this coins have low market cap and have very strong potential .
good luck

MINA about to break shortterm downtrend?Chances are that MINA is about it break through the downtrend of the last week (red line), either directly or after another retest of the support-line (bottom green)
Good luck

I love me some MINA The Mina network has a size of only 22 KB, which is miniscule when compared to Bitcoin’s 300 GB blockchain. keep an eye of this one..

MINA 1DPossible path for $MINA in daily timeframe.
If correct, I would go long when it pulls back (indicated by smiley emoji).

Binance: MINA buy / long 1DBinance: MINA buy / long 1D
Entry: 4.4 - 4.8
SL: 1d close below 2.8
TP: 6.5
TP2: 8.8

MINA READY TO RUN??The volume is increasing day by day.
CCI Oscillator signals upward movement!
MINA had already been charging itself for a while.
Failed to pass the resistance for the third time (12 Nov 21 - 6.6 USDT)
The fourth time everything could be different...

MINA setup ideaHey everyone, checkout Mina chart, everything is explained on chart.
We are in a trading range right now, break of this level can end to a sharp move toward higher prices, Ghost feed is drawn on cahrt, you can see the path I think the price will follow.
Enjoy
keep in mind, its not a financial advice, its just an idea, trade on your own risk management.

MINA Acumulating and... 🚀🚀🚀Hello friends
Mına Protocol just waiting for bull run..When Bitcoin's new uptrend begins
When ethereum bridge happens
3. bull wave will come!!!
(risks must be taken into account.)

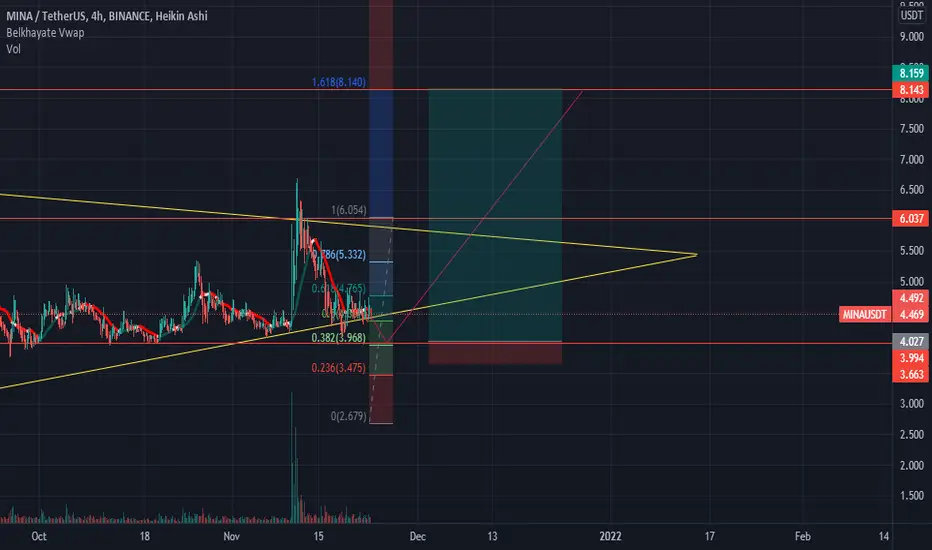
MINA 4HOURS CHART ANALYSISHello friends,
MINA will see a downward to 3.990 and then you can enter as a buyer, everything is clear on the chart I don't like making things complicated to let the chart clear to everyone
TARGETS:
tp2: 6.050
tp3: 8.131
DISCLAIMER: This is not an financial advice (its my own opinion) Please only invest what you can afford to lose, and do your own research before investing and don't forget after first target reached move ur stop to breakeven (stop loss is part of profit).
Please support my work by clicking the like button and follow me on TRADINGView, if you don't want to miss my next analysis.
If you have any criticism put it in a comment we are here to learn more from each other and thanks .
Mina is probably ready to start the third waveGreetings to you crypto lovers. I am sure that many of you have heard about Mina, and maybe even already purchased it for yourself, or are just thinking about buying it. I'm analyzing Elliott waves and I'm going to show you the current wave structure by Mina.
The growth from $0.92 to $6.47 represents a motive phase of the market and is an impulse wave. On September 14, the corrective phase of the market began to unfold in the form of a flat. I assume that the wave (c) of the flat ended at $4.09 or is close to completion. If the flat ended at $4.09, then we have a running flat in front of us, which means that the upcoming third wave will be extended and super-fast. If the wave (c) of the flat is not yet completed, then Mina may decline to $3.75.
I stick to the first idea and expect to see a clear bullish impulse from $4.09.
It is likely that with the upcoming growth, many different positive news about the success of Mina will appear. This will undoubtedly add fuel to the fire.

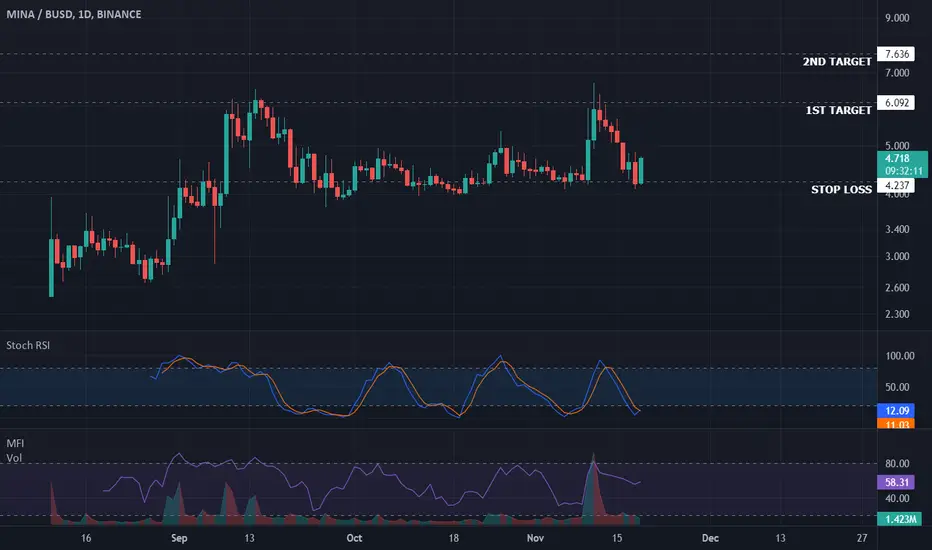
MINA ForecastHi,
Mina touched the 1st target and retest the support and now moving up to touch the 2nd target.
you can buy and sell accordingly.
this idea is educational purpose only.
feel free to share your comments.
all the best.
Thank you
Correction is over - Next Bomb detonatesBullrun is incoming.
The next 2 months will be excellent.
🚀🚀🚀🚀🚀

MINA/USDT🚀🚀#SPOT
# MINA / USDT
Entry in 2 ranges 4.80 - 5.29
With 3 to 5% capital
Targets
🎯target 1: 8
🎯target 2: 10
🎯target 3: 12
🎯target 4: 14
It does not have a stop
Hold is offered in the medium term

MINA Ready To FlyPair: MINA-BTC
Chart: 1D
Coingecko: www.coingecko.com
After breaking a trendline, MINA pumped out from low volume accumulation phase. If Bitcoin will continue to lurk sideways, MINA should see new ATH soon.
This is not financial advice.
Set stop loss.
Always watch bitcoin.
Always do your own research.

Short-term MINA Explosion imbound MINA finishing a long descending triangle.
Pay attention to the bounce points of the RSI support. Stoch at low, as well.
My guess is that a wick will stick down the resistance level, say 5,3$, and will fuel the bull run.
Keep an eye out!

Fun Fact: Today is Saint Mina, and it came with a Bullish FlagA bullish flag could signal a breakout and a strong second wave for the 11th of Nov, which is also St. Mina's day.

MINA NEXT MOVE IDEAMINA IS MOVING TOWARDS ITS PREVIOUS ALL TIME HIGH. AFTER REACHING THERE IT 'LL EXPECTED TO MOVE FURTHER TO MAKE NEW ATH.
THIS IDEA IS SHARED FOR EDUCATIONAL PURPOSE ONLY.
please share your idea in comments. Thank you.

Mina ProtocolMina Protocol is a minimal “succinct blockchain” built to curtail computational requirements in order to run DApps more efficiently. Mina has been described as the world’s lightest blockchain since its size is designed to remain constant despite growth in usage. Furthermore, it remains balanced in terms of security and decentralization. The project was rebranded from Coda Protocol to Mina in October 2020.

#MINAUSDT Long Cup and Handle Go to 8$ maybe to 12$#MINAUSDT Long Cup and Handle Go to 8$ maybe to 12$
Strong BULLISH for MINA!

MINA near support good dip to buy#MINAUSDT
$MINA hold above a long term support zone.
break down from this support zone will drop price to $2.8.
but if reject from this zone and head up to break out descending resistance, price can go up to touch $6 and $8.

(MINA) GOOD TIME TO BUYHello everyone !
Today the Black Cat Trader is analyzing MINA based on a Daily chart.
What we can see :
- MINA is still trading under the downtrend line (yellow) and prices are stuck into a compression triangle.
- Note that prices are stuck under the EMA21.
- The Bollinger bands are tightened and horizontally frame the price for 1 month now.
- MACD is totally neutral
We are clearly in an accumulation mode right now.
What we can expect :
If prices manage to break the downtrend line, wait a pullback on the new support to take position. Note that, according to the Fib circles, we can expect an event by the end of November.
——
Resistance 1 : Downtrend line / Top of triangle
Resistance 2 : Upper band of the BB
——
Support 1 : Bottom of triangle
Support 2 : Lower band of the BB
——
TP1 : 12,73 $ (1.618)
TP2 : 18,28 $ (2.618)
TP3 : 23,84 $ (3.618)
TP4 : 29,39 $ (4.618)
IF YOU LIKE THIS POST, FEEL FREE TO LEAVE A LIKE AND FOLLOW THE BLACK CAT TRADER
MAY THE CRYPTO BE WITH YOU GUYS (D.Y.O.R)
