MINAUSDT Forming Bullish MomentumMINA/USDT is showing clear signs of bullish momentum, and the fundamentals strongly support a longer-term uptrend. The protocol is unique: it’s one of the lightest blockchains in the industry thanks to its use of recursive zk-SNARKs, meaning every node only needs to store a very small proof to verify the entire network. This architecture gives Mina a real scalability and decentralization edge — full participation without huge hardware demands.
Recently, Mina completed a major upgrade that unlocked full zk-app programmability. This means developers can now build and deploy zero-knowledge smart contracts (zkApps) on Mina’s mainnet, using off-chain execution while only submitting proofs on-chain. That’s a powerful paradigm shift: smart contracts become more scalable, private, and efficient. The roadmap for 2025 is also very aggressive, with o1Labs pushing hard on developer tooling like o1js, and the protocol targeting interoperability, new proof types, and a significantly deeper zk ecosystem.
On the institutional side, Mina is gaining traction: it recently secured support for institutional custody and staking via Cupper, which could unlock greater capital inflow. ( ) Meanwhile, on-chain activity appears to be ramping up, and more developers are building zkApps across voting, digital identity, gaming, and other verticals. ( )
Minabtc

#MINA/USDT Bullish Impulse, New All-Time High Late 2025#MINA
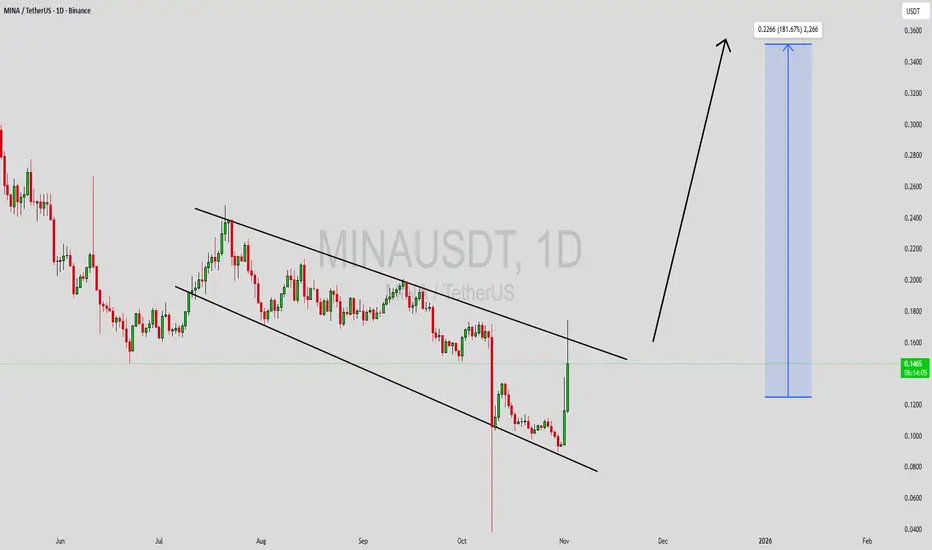
The price is moving in a descending channel on the 1-hour timeframe and is expected to break out and continue upwards.
We have a trend to stabilize above the 100-period moving average again.
We have a downtrend on the RSI indicator, which supports an upward move if it breaks above it.
We have a key support zone in green that pushed the price higher at 0.1500.
Entry price: 0.1735
First target: 0.1894
Second target: 0.2026
Third target: 0.2115
For risk management, don't forget your stop-loss and money management.
The stop-loss is below the support zone in green.
Upon reaching the first target, take some profit and then change your stop-loss order to an entry order.
For any questions, please comment.
Thank you.

MINAUSDT Forming Falling WedgeMINAUSDT is forming a clear falling wedge pattern, a classic bullish reversal signal that often indicates an upcoming breakout. The price has been consolidating within a narrowing range around $0.163 USDT, suggesting that selling pressure is weakening while buyers are beginning to regain control. With consistent volume confirming accumulation at lower levels, the setup hints at a potential bullish breakout soon. The projected move could lead to an impressive gain of 140% to 150%+ once the price breaks above the wedge resistance, attracting searches for MINAUSDT price prediction.
This falling wedge pattern is typically seen at the end of downtrends or corrective phases, and it represents a potential shift in market sentiment from bearish to bullish. Traders closely watching MINAUSDT are noting the strengthening momentum as it nears a breakout zone near $0.17. The good trading volume adds confidence to this pattern, showing that market participants are positioning early in anticipation of a reversal in this zk-proof blockchain token.
Investors’ growing interest in MINAUSDT reflects rising confidence in the project’s long-term fundamentals and current technical strength, particularly with lightweight verification features for scalable dApps. If the breakout confirms with sustained volume, this could mark the start of a fresh bullish leg. Traders might find this a valuable setup for medium-term gains, especially as the wedge pattern completes and buying momentum accelerates in falling wedge breakout crypto plays.
✅ Show your support by hitting the like button and ✅ Leaving a comment below! (What is You opinion about this Coin) Your feedback and engagement keep me inspired to share more insightful market analysis with you!

MINAUSDT UPDATE#MINA
UPDATE
MINA Technical Setup
Pattern: Falling Wedge Pattern
Current Price: $0.563
Target Price: $1.13
Target % Gain: 100.93%
Technical Analysis: MINA is breaking out of a falling wedge pattern on the 1D chart, signaling a strong bullish reversal. The breakout is supported by growing volume and bullish momentum, confirming strength as price moves above key resistance.
Time Frame: 1D
Risk Management Tip: Always use proper risk management.

MINAUSDT Forming Bullish WaveMINAUSDT is currently showing strong bullish signs as it forms a bullish wavelling wedge pattern, which typically indicates a potential trend reversal and continuation of upward momentum. This pattern reflects consolidation within a narrowing range, suggesting that buyers are preparing for a breakout. The current structure hints that MINA may soon experience a surge in buying pressure as the wedge approaches its breakout zone. With volume remaining solid, the technical setup signals that traders and investors are positioning themselves for a significant move upward.
A confirmed breakout above the wedge resistance could trigger a powerful rally, aligning with the expected gain of 140% to 150%. The combination of steady volume, a strong technical pattern, and increasing interest from market participants provides a favorable environment for potential bullish momentum. Traders observing key resistance levels will likely look for confirmation before entering long positions, as MINA’s structure shows the potential to sustain upward movement once momentum builds.
The investor sentiment surrounding MINAUSDT continues to grow as this project gains more visibility in the market. The recent pattern formation combined with healthy accumulation points to confidence among both retail and institutional participants. If the bullish wave continues, this setup could mark the beginning of a major uptrend phase for MINA, making it an attractive pair to watch closely in the coming sessions.
✅ Show your support by hitting the like button and
✅ Leaving a comment below! (What is You opinion about this Coin)
Your feedback and engagement keep me inspired to share more insightful market analysis with you!
MINAUSDT - A real treasure!Weekly chart displays:
- breakout trendline , 130% rising till now
- consolidation a bullish expanding triangle pattern (breakout = 10$)
- breakout , retest of 0.236 fibo level
chart shows a massive potential targets a head
add it ti ur watchlist ... accumulate it without worry during any correction
best regards Ceciliones🎯

Mina , the next ethYes I do have lots of hope for mina , much more than what i show on the chart , easy and simple just have a little research about it to gain faith . I measure many things but always fancy showing my charts in the simplest way possible that’s why i use pitchforks, here where we are is the lowest possible point I can imagine for mina. Blue rectangle is the cheapest price you can accumulate it before lifting off. It’ll goes sharp to +2$ area and in the bullrun will break the channel and goes parabolic. My target for the bullrun is around 6$ but it might go much higher as the news coming for it , I sincerely hope it’ll goes past 10$ if the world realises what mina capable of . If you check btc pair you’ll see that we’re forming a gigantic positive divergence in weekly timeframe also we playing at the bottom and the support and we may start the move any minute .
Anyway stay safe fam and don’t forget to DYOR

#MINA (SPOT) entry range( 0.4000- 0.4900) T.(1.2020) SL(0.3832)BINANCE:MINAUSDT
entry range ( 0.4000- 0.4900)
Target1 (0.6360)- Target2 (0.8300)- Target3 (1.0150) -Target4 (1.2020)
2 Extra Targets(optional) in chart, if you like to continue in the trade with making stoploss very high.
SL .1D close below (0.3832)
*** collect the coin slowly in the entry range ***
**** #Manta ,#OMNI, #DYM, #AI, #IO, #XAI , #ACE #NFP #RAD #WLD #ORDI #BLUR #SUI #Voxel #AEVO #VITE #APE #RDNT #FLUX #NMR #VANRY #TRB #HBAR #DGB #XEC #ERN #ALT #IO #ACA #HIVE #ASTR #ARDR #PIXEL #LTO #AERGO #SCRT #ATA #HOOK #FLOW #KSM #HFT #MINA ****

#MINA/USDT#MINA
The price is moving in a descending channel on the 12-hour frame and is sticking to it very well and is about to break upwards
We have a bounce from the lower limit of the channel at 0.3900
We have an upward trend on the RSI indicator that is about to break, which supports the rise
We have a trend to stabilize above the moving average 100
Entry price 0.4790
First target 0.5996
Second target 0.6687
Third target 0.7551

Crucial level for MinaBetting on alts is always difficult , I was observing mina for a long time and when i compare it in btc charts i know its the decision time for it . I see its forming a ascending channel and right now its in the bottom . personally hope that it can hold otherwise i meet you in ATL once again .
RSI is on a support as well . also i suggest checking ADABTC chart for the last cycle as comparison .
crypto isn't for crybaby lads , stay safe

MINA looks bullishA Trigger Line is formed.
Higher Ls are forming and buyers look strong.
It can move up to maintain the green range.
Closing a 4-hour candle below the invalidation level will violate the analysis
For risk management, please don't forget stop loss and capital management
When we reach the first target, save some profit and then change the stop to entry
Comment if you have any questions
Thank You

#MINA/USDT#MINA
We have a bearish channel pattern on a 12-hour frame, the price moves within it and adheres to its limits well
We have a green support area at 0.7300 after the price touched it and bounced from it
We have a tendency to stabilize above moving average 100
We have an uptrend on the RSI indicator that supports the price higher
Entry price is 0.8000
The first target is 0.8946
The second target is 0.9761
the third target is 1.0540

#MINA/USDT#MINA
The price is moving in a triangle for 1 day
We have a green support area at 1.00
Now we have a nice breakout coming up
We have a similar RSI indicator
Entry price is 1.48
The first goal is 1.70
The second goal is 1.87
Third goal 2.08

#MINA/USDT#MINA
The price is moving in a bearish channel on a 4-hour frame.
The price is moving within it and adhering to it to a large extent. We have a support area in green, from which it rebounded at the $1 level. We have a higher stability moving average of 100
We have a downtrend on the RSI indicator that supports the rise and is about to break higher
Entry price is 1.10
The first goal is 1.22
The second goal is 1.34
the third goal is 1.45

MINA: TRADE IN POLLBACK📊Analysis by AhmadArz:
🔗"Uncover new opportunities in the world of cryptocurrencies with AhmadArz.
💡Join us on TradingView and expand your investment knowledge with our five years of experience in financial markets."
🚀Please boost and💬 comment to share your thoughts with us!

Long MinaEntry 1.37
Targeting 2.12 with profits along the way
SL 1.18
RRR 4
This is an early trade for me as that Cup and Handle pattern has not been confirmed with a break of the neckline. However, I am betting on BTC to 70k and it will drag these alts along. All good volume is on the underside of MINA rn, so we should see quite an explosion to the upside once that neckline is broken IMO.

MINA - A simple Trade#MINA/USDT #Analysis
Description
---------------------------------------------------------------
+ MINA is bouncing back after hitting the its support zone.
+ I'm looking for confirmed breakout before entering the long position.
+ My entry is targeted towards the resistance breakout around 1.4078. You can enter the trade after the candle close above this price line
---------------------------------------------------------------
VectorAlgo Trade Details
------------------------------
Entry Price: 1.4078 (After candle close)
Stop Loss: 1.337
------------------------------
Target 1: 1.4313
Target 2: 1.4905
Target 3: 1.5567
------------------------------
Timeframe: 4H
Capital: 1-2% of trading capital
Leverage: 5-10x
---------------------------------------------------------------
Enhance, Trade, Grow
---------------------------------------------------------------
Feel free to share your thoughts and insights.
Don't forget to like and follow us for more trading ideas and discussions.
Best Regards,
VectorAlgo

MINA IS BULLISHWe looked at the MINA wave counter. It seems to be a large diametric that started for the E wave.
By keeping the green box, it can move towards the targets.
We have an important supply on the chart, if it breaks, we will have access to the second and third targets.
Closing a daily candle below the green box will violate the analysis
For risk management, please don't forget stop loss and capital management
When we reach the first target, save some profit and then change the stop to entry
Comment if you have any questions
Thank You

MINA LOOKS BULLISHThe supply range of the previous analysis was broken and a trigger has been issued for the above targets.
We looked at the MINA wave counter. It seems to be a large diametric that started for the E wave.
By keeping the green box, it can move towards the targets.
We have an important supply on the chart, if it breaks, we will have access to the second and third targets.
Closing a daily candle below the green box will violate the analysis
For risk management, please don't forget stop loss and capital management
When we reach the first target, save some profit and then change the stop to entry
Comment if you have any questions
Thank You

MINA LOOKS BEARISHThe MINA symbol has a bear structure. Because CH and iBOS have good bears. We have a good supply at the top and a liquidity pool at the bottom.
A dynamic resistance also passes above the price. It is expected that the price will move from the specified supply to the specified demand
Closing a daily candle above the Supply range will violate the analysis
For risk management, please don't forget stop loss and capital management
When we reach the first target, save some profit and then change the stop to entry
Comment if you have any questions
Thank You

#MINA/USDT#MINA
The price reached the first target of 0.0800
We are now in the correction phase before completing the rise
For the second goal 1.10
This rise is supported by the break of the descending triangle pattern and the moving average 100
Correction may take December

#MINA/USDT#MINA
The price has been moving in a descending triangle since last March
Now the price is at the current support areas 0.3700.
With an expected target of 0.8300.
In the event of a break higher than expected, it will be done in stages
In an advanced manner, with saturation of sales on the frame for days
The price has always respected the downtrend
And the trend from which it bounced upward more than once
The support points and expected target are shown on the drawing

MINA is still strongMINA is showing up some strenght. Price is slightly below 200 MA which acts like S/R. Once price breaks up and successfully test it back, we can see huge upside. Dips before move here are for buys. I am focusing on new 2S and 4D candle to catch the best entry points.
Always manage your risk and use stoploss. It is not financial advice.
