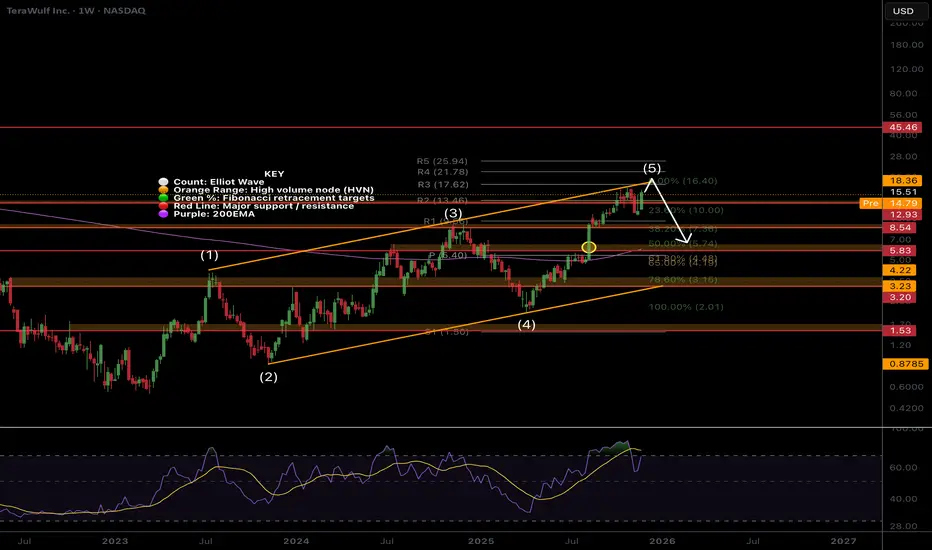
WULF Macro analysis | The bigger picture | Long-term holdersNASDAQ:WULF
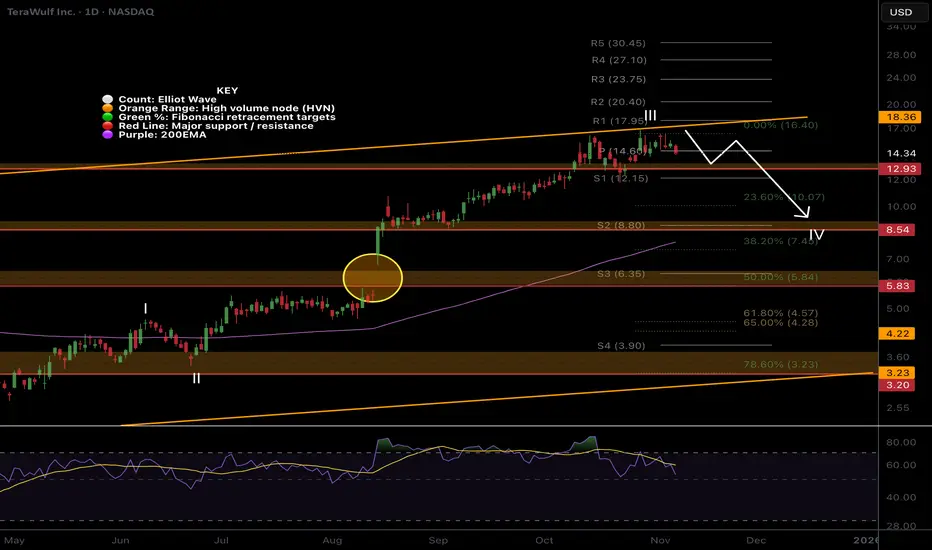
🎯 Price appears exhausted at the upper channel boundary. The Elliot wave pattern completes a leading diagonal, which hints at higher to go, but after a deep wave 2 pullback, which could end at the 0.382 Fibonacci retracement, $8, but a more likely target is the 0.5 Fib at $5.84 with downside momentum, also the weekly 200EMA.
Breaking out above the channel would change the count and structure and be very bullish.
📈 Weekly RSI is oversold with no divergence and can remain here for months as price keeps increasing.
👉 Analysis is invalidated if we close back above $18
Safe trading
Miner

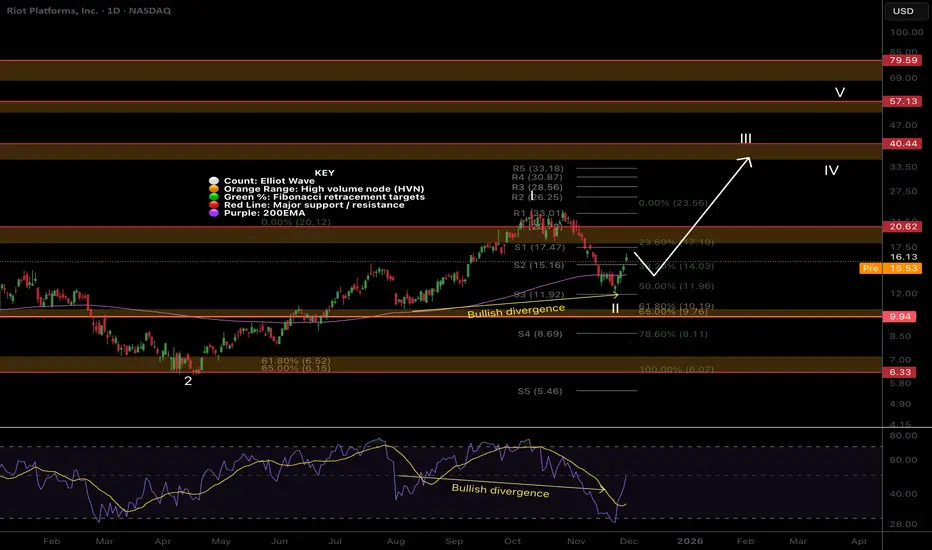
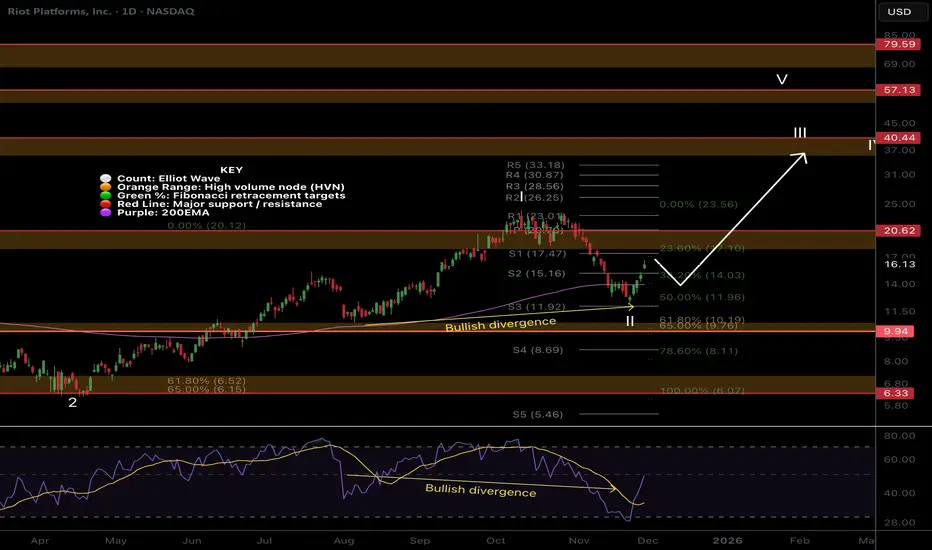
RIOT Macro analysis | The bigger picture | Long-term holdersNASDAQ:RIOT
🎯 Riot tested the upper boundary trend-line after its breakout. Expected behaviour. The uptrend is intact with price above the weekly 200EMA and pivot. Price appears to be in a wave 3 with a target of $40, the R£ weekly pivot.
📈 Weekly RSI has hidden bullish divergence at the EQ
👉 Analysis is invalidated if we close below $6.33
Safe trading

MARA Macro analysis | The bigger picture | Long-term holdersNASDAQ:MARA
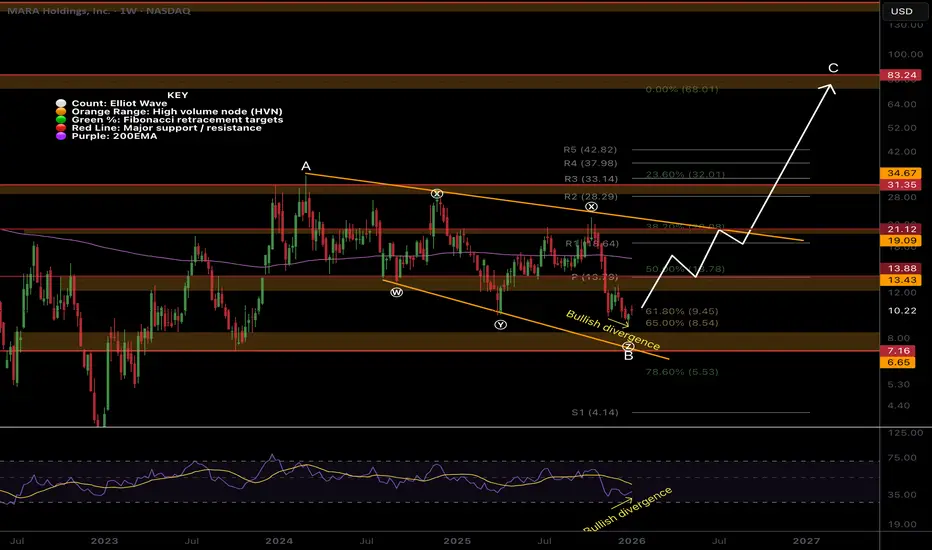
🎯 Mara remains at the golden pocket support and channel lower boundary. It is below the daily pivot and 200EMA, showing the bears are in control. Price appears to be in an Elliot wave B, restricting upside targets to the 1:1 Fibonacci extensions at $106.
📈 Weekly RSI is nearing oversold with room to fall but has bullish divergence
👉 Analysis is invalidated if we close back below wave (II), $3.07
Safe trading
IREN Macro analysis | The bigger picture | Long-term holdersNASDAQ:IREN
🎯 Price has overextended in a macro wave 3, the strongest and most powerful move described as a “wonder to behold” by Elliotticians. Initial downside targets for wave (4) have been hit $39, the next is 0.382, $26. In the long term, we have higher to go in wave (5) with a target of the R2 weekly pivot, $111.
📈 Weekly RSI hit overbought with no divergence
👉 Analysis is invalidated if we continue into price discovery
Safe trading

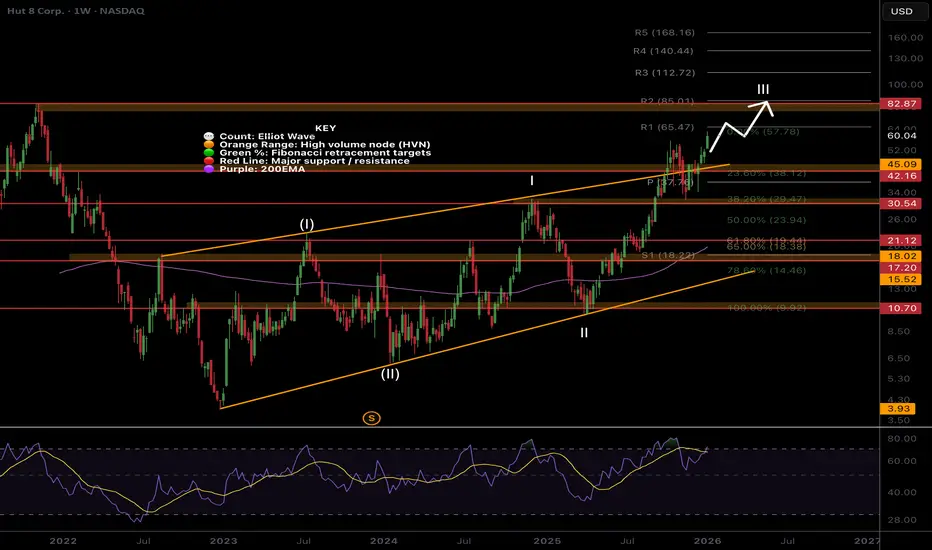
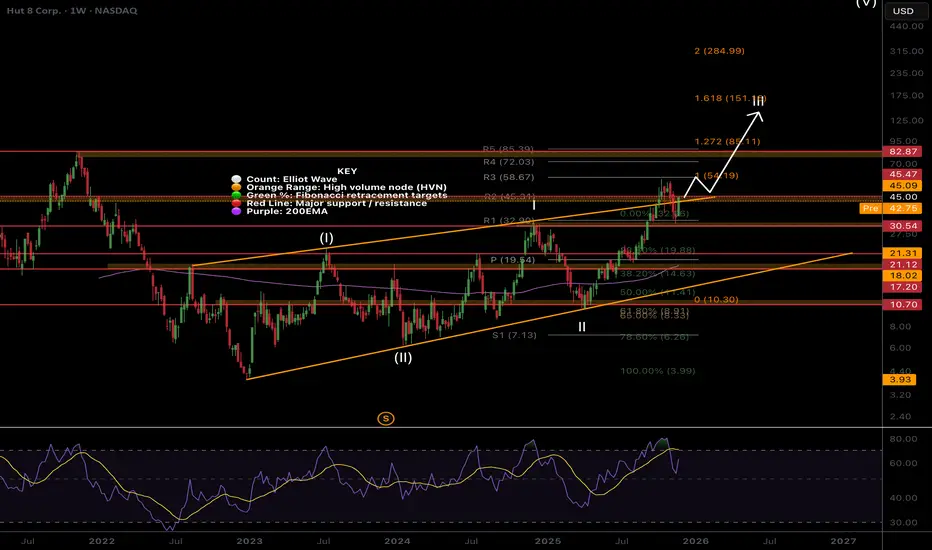
HUT Macro analysis | The bigger picture | Long-term holdersNASDAQ:HUT
🎯 A large bearish engulfing candle at major resistance saw the price drop back into the range, but the price wasted no time continuing its wave III uptrend. The next target is the $82 all-time High Volume node.
📈 Weekly RSI hit overbought and is now showing unconfirmed bearish divergence, which can take weeks to play or be negated
👉 Analysis is invalidated if we close back below the weekly pivot, $30
Safe Trading
CLSK Macro analysis | The bigger picture | Long-term holdersNASDAQ:CLSK
🎯 Price attempted to break out of the macro triangle upper boundary but was rejected. Breaking above wave D at $24 is key to trigger the next thrust towards $42, then $80 all-time High Volume Node. Triangles are penultimate patterns found before a final strong move. Price found support at the weekly pivot and 200EMA.
📈 Weekly RSI has printed bullish divergence below the EQ, but with no strong reaction yet. This can take months to play out.
👉 Analysis is invalidated below wave E, $5.97, keeping the wave E alive.
Safe trading

BTDR Macro analysis | The bigger picture | Long-term holdersNASDAQ:BTDR
🎯 After a 500%+ rally to all-time high, BTDR gave back most of its gain in a single week, alongside Bitcoin, undoing all that hard work. Price is currently finding support just above the weekly 200EMA and low-cap golden pocket, 0.786 Fibonacci retracement. The macro structure is still bullish with a series of higher highs and higher lows. Wave C of (C) appears to be underway with a target of the R3 pivot at $44 once momentum to Bitcoin and AI returns. The weekly pivot is the next resistance, $15.
📈 Weekly RSI is below the EQ with plenty of room to fall until oversold, though historically it never quite reaches this low.
👉 Analysis is invalidated if price falls below wave (B), $6, and the structure will start to look bearish.
Safe trading

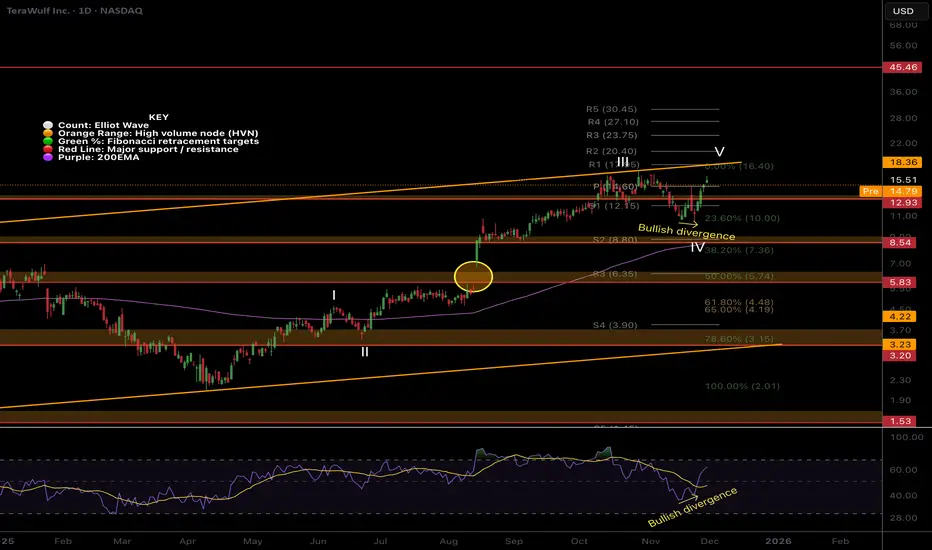
WULF Short-term analysis | Trading and expectationsNASDAQ:WULF
🎯 The triangle analysis appears to be playing out, currently printing wave d. Price lost the daily pivot but remains well above the daily 200EMA. Wave V target is the R2 pivot at $18.74. Triangles are a penultimate pattern.
📈 Daily RSI sits at the EQ
👉 Analysis is invalidated if price falls below wave a, $10.40
Safe trading

RIOT Short-term analysis | Trading and expectationsNASDAQ:RIOT
🎯 Price appears to have completed wave II of 3, reclaiming the daily 200EMA, but still has to overcome the daily pivot, its current resistance.
📈 Daily RSI hit oversold with bullish divergence
👉 Continued downside has a target of the High Volume Node, $10
Safe trading

MARA Short-term analysis | Trading and expectationsNASDAQ:MARA
🎯 Previous downside target was hit, $8. Price dropped hard, changing the Elliott wave count completely, stopping at the golden pocket. Wave (Z) of B appears complete, but we need to see a structure change to add confirmation.
📈 Daily RSI went deep into oversold and has no printed bullish divergence
👉 Continued downside has a target of the High Volume Node bottom, $7
Safe trading

HUT Short-term analysis | Trading and expectationsNASDAQ:HUT
🎯 Wave 4 of V was indeed complete at the 0.382 Fibonacci retracement and High Volume Node just above the daily 200EMA. The daily pivot has been reclaimed.
📈 Daily RSI is showing unconfirmed bearish divergence
👉 Analysis is invalidated if we close below wave 4, $30
Safe trading

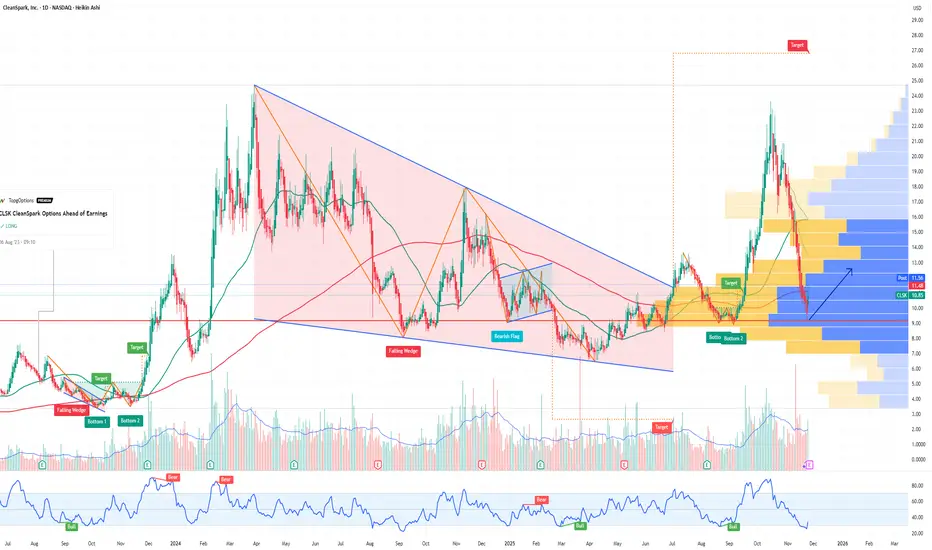
CLSK Short-term analysis | Trading and expectationsNASDAQ:CLSK
🎯 Price fell a dollar shy of breaking the triangle wave D target, keeping the triangle alive. The 3 white knight pattern was rejected, but the structure is still bullish. Support was found at the orange trend line, and resistance is found at the daily 200EMA.
📈 Daily RSI sits at the Eq with no divergence.
👉 Analysis is invalidated if price falls below wave (2) at $9
Safe trading

BTDR Short-term analysis | Trading and expectationsNASDAQ:BTDR
🎯 Price appears to have bottomed at the low-cap golden pocket, 78.6 Fibonacci retracement and major High Volume Node support. However, a triangle could be printing, suggesting one more push lower is on the table. Getting above $14.50 will negate this.
📈 Daily RSI has printed bullish divergence, but we need to see some follow though to be confident the bottom is in.
👉 Analysis is invalidated if price falls below wave (B), $6, and the structure will start to look bearish.
Safe trading

HUT Uptrend intactNASDAQ:HUT A large bearish engulfing candle at major resistance saw the price drop back into the range. It is now attempting break-out once more.
Price remains in a firm uptrend at major resistance with not much to add.
🎯 Terminal target for the business cycle could see prices as high as $135 based on Fibonacci extensions
📈 Weekly RSI hit overbought and reset back to the EQ.
👉 Analysis is invalidated if we close back below the weekly 200EMA
Safe trading
MARA cant catch a break, macro outlook still strongNASDAQ:MARA found support at the golden pocket and channel lower boundary just above the S1 pivot.
Price appears to be in an Elliot wave B, restricting upside targets to the 1:1 Fibonacci extensions at $106. Price is below the weekly 200EMA and pivot.
🎯 Terminal target for the business cycle could see prices as high as $106 based on Fibonacci extensions
📈 Weekly RSI is nearing oversold with room to fall
👉 Analysis is invalidated if we close back below wave (II)
Safe trading

RIOT Macro outlook, weekly bullish divergenceNASDAQ:RIOT tested the upper boundary trend-line after its breakout. Expected behaviour.
A large weekly candle formed after hitting the weekly 200EMA and support suggesting the bottom is in.
Price remains above the downtrend and showed strength by poking above the wave 1 high.
🎯 Terminal target for the business cycle could see prices as high as $112 based on Fibonacci extensions
📈 Weekly RSI has bullish divergence
👉 Analysis is invalidated if we close below $6.33
Safe trading
WULF LocalPrice caught a bid above the daily 200EMA on bullish divergence. It’s possible a triangle is forming for wave IV.
Price is stuck between the breakout upper-boundary and mean support, its hard to decipher the next direction as it stands. A breakout above the line could see it rally to $25 while back below wave IV would test the 200EMA.
📈 Daily RSI had confirmed bullish divergence but not from oversold
👉 Continued upside will invalidate this analysis.
Safe trading
WULF Macro looks exhausted... pullback before higherNASDAQ:WULF Price appears exhausted at the upper channel boundary, and I have exited completely for now. The Elliot wave pattern completes a leading diagonal, which hints at higher to go after a deep wave 2 pullback, which could end at the 0.382 Fibonacci retracement, $8, but a more likely target is the 0.5 Fib at $5.84 with downside momentum. Also the weekly 200EMA.
Breaking out above the channel would change the count and structure and be very bullish. RSI has been overbought for a while. For now, I watch and wait.
🎯 Terminal target for the business cycle could see prices as high as $25 based on weekly pivots
📈 Weekly RSI is oversold with no divergence and can remain here for months as price keeps increasing.
👉 Analysis is invalidated if we close back above $20
Fair value sits at $11.
Safe trading
CLSK CleanSpark Options Ahead of EarningsAnalyzing the options chain and the chart patterns of CLSK CleanSpark prior to the earnings report this week,
I would consider purchasing the 12.5usd strike price Calls with
an expiration date of 2026-1-16,
for a premium of approximately $1.42.
If these options prove to be profitable prior to the earnings release, I would sell at least half of them.
RIOT holding up stronger than the others..NASDAQ:RIOT Price remains in its uptrend and wave II of 3 appears complete with a 3 white knight bullish candle pattern.
Price recovered the daily 200EMA and looks rady for higher.
📈 Daily RSI hit oversold with bullish divergence
👉 Continued downside has a target of the High Volume Node, $10
Safe trading
MARA struggling...NASDAQ:MARA Price dropped hard, changing the Elliott wave count completely, stopping at the golden pocket.
Wave (z) of B appears complete, but we need to see a structure change to add confirmation, so the probability is to the downside with a target of the $8 High Volume node.
📈 Daily RSI went deep into oversold
👉 Continued downside has a target of the High Volume Node, $8
Safe trading

BTDR savage dump, renewed opportunity?NASDAQ:BTDR Locally, the price broke into an all-time high as expected, but the depth of the crash was unexpected, losing 70% of its value in a matter of days. My trading signal took partial profit for 3.57RR at the highs, and the rest of the position was knocked out at breakeven, leaving us with an overall win.
Bullish divergence on a higher low from oversold has emerged. This was also at the 78.6 Fibonacci, where we expected low-cap assets to retrace to- usually marking a bottom. Price behaviour is a series of ABCs changing the overall dynamics. Wave B appears to have ended with wave C minimum target being $38.22 based on 1:1 Fib extensions, also the R3 pivot.
📈 Daily RSI has printed a confirmed bullish divergence from oversold.
👉 Continued downside has a target of $5.59 High Volume Node
Safe trading

WULF pullback on the cards!Price is struggling at the trend-line boundary on bearish divergence suggesting wave III is complete and wave IV is soon underway.
Due to the size of the rally wave IV could be deep. The usual 0.382 target is down at $8 where it would meet the daily 200EMA.
Daily RSI has printed bearish divergence in overbought.
breaking out above the trend-line could be extremely bullish.