XAUUSD – CPI Today: Liquidity Sweep Scenario & Trading Plan📊 Market View
Gold (XAUUSD) is sliding under short-term resistance (descending trendline), showing sellers are still in control short-term. On the M30 chart, buy-side liquidity levels are clearly stacked: 3,624 → 3,612 → 3,599 → 3,586.
👉 During the European session, expect a breakdown liquidity sweep toward these support zones before any bullish reaction.
📈 CPI View – US Session
Soft CPI (below expectations) → Weaker USD, lower yields → Gold may bounce strongly from 3,612 / 3,599 / 3,586 and retest trendline/resistance.
Hot CPI (above expectations) → Stronger USD, higher yields → Gold may break 3,612, sweep deeper to 3,599 or 3,586, then recover.
⚠️ High risk of news traps: the first reaction can reverse quickly. Wait for retests + confirmation candles before entering.
🔑 Key Levels
Dynamic Resistance (trendline): 3,643 – 3,646
React Zone FIB: 3,650 – 3,654
OBS Sell Zone: 3,665
Support/Liquidity Zones:
3,624.36 (key zone support BUY)
3,612.60 (CP/React FIB)
3,599.31 (BUY ZONE)
3,586.49 (END LIQUIDITY – BUY ZONE)
📌 Trading Plan
🔴 SELL ZONE: 3,646 – 3,648
SL: 3,652
TP: 3,640 → 3,635 → 3,630 → 3,620 → 3,610 → ???
🔵 BUY SCALP: 3,612 – 3,610
SL: 3,605
TP: 3,616 → 3,620 → 3,625 → 3,630 → ???
🔵 BUY ZONE (Primary): 3,600 – 3,598
SL: 3,592
TP: 3,605 → 3,610 → 3,615 → 3,620 → 3,630 → 3,640 → ???
Backup BUY: (if liquidity sweep deepens) 3,58x
Hard SL: 3,578
❗ If 3,578 breaks, don’t rush to re-buy—CPI volatility can extend moves further.
⚠️ Notes & Risk
Reduce position size around the CPI release.
Always wait for confirmation (pin bar / engulfing / retest) before entering.
Use staggered TPs to lock in profits early.
An M30 close above 3,654 invalidates near-term shorts and opens 3,665.
✅ Summary
Gold could sweep liquidity into the buy zones before bouncing. Trade the reaction: SELL at 3,646–48 on rejection, BUY at 3,612/3,600 on clean bounce, and reserve backup BUY at 3,58x with tight risk.
👉 Follow MMFLOW TRADING for real-time updates and BIGWIN setups during CPI volatility.
Mmflowtrading

XAUUSD – PPI Ahead: Key Liquidity Levels & Trading Plan🚀 MMFLOW TRADING
Market View:
After yesterday’s sharp drop where sellers dominated the liquidity zone, gold (XAUUSD) is now recovering from 362x → 364x during the Asian session. In the short term, price may range between 362x–365x in Asia/Europe before going sideways to await the PPI release in the US session.
Today’s PPI is expected at 0.3% vs 0.9% previous, signalling cooling inflation. However, actual data could surprise higher – often creating a “news trap”. From a technical view, gold may need to revisit 360x liquidity before resuming its uptrend ahead of CPI & the upcoming FED meeting.
👉 In short: Structure remains bullish, but short-term liquidity sweeps are likely before any continuation move.
Key Levels:
Resistance: 3647 – 3654 – 3665 – 3674 – 3704
Support: 3635 – 3613 – 3600 – 3586
Trading Plan:
🔵 BUY Zone: 3600 – 3598
SL: 3592 (or tighter at 3580)
TP: 3605 → 3610 → 3615 → 3620 → 3630 → 3640 → 3650+
🔴 SELL Zone: 3703 – 3705
SL: 3710
TP: 3698 → 3694 → 3690 → 3680 → 3670 → 3660+
Summary:
✅ Gold remains in an uptrend, but may retest 360x liquidity before heading higher.
✅ PPI today & CPI tomorrow could act as a “news trap” – caution is required.
👉 Watch the key levels and follow MMFLOW TRADING for real-time updates & BIGWIN setups!

XAUUSD – M30 Intraday Trading Plan | MMFLOW TRADINGMarket Pulse:
The US jobs report confirmed a clear slowdown in labour market growth. According to CME FedWatch, there is now an 88% probability the Fed cuts rates by 0.25% in September, and 12% for a 0.5% cut. Lower rates reduce the opportunity cost of holding gold – fuelling demand further.
Gold has already gained 38% YTD, after rising 27% in 2024. A weaker USD, aggressive central bank accumulation (led by China, which extended purchases for the 10th consecutive month in August), loose monetary policy, and rising global uncertainty continue to build a solid base for this bullish trend.
👉 Bottom line: Macro flows + liquidity both favour the BUY side.
Technical View (M30):
Price is respecting the ascending channel, printing higher lows.
3616–3596 is the structural support; only a breakdown here shifts the trend.
Liquidity clusters sit at 3653–3655 and 3675–3677, likely to trigger short-term SELL reactions before the broader uptrend resumes.
Execution Plan (Today):
🔵 BUY ZONE: 3618 – 3616
SL: 3610
TP: 3624 → 3630 → 3635 → 3640 → 3650 → 3660 → 3670+
🔵 BUY ZONE: 3598 – 3596
SL: 3590
TP: 3602 → 3606 → 3610 → 3615 → 3620 → 3630 → 3640 → 3650+
🔴 SELL ZONE: 3653 – 3655
SL: 3660
TP: 3648 → 3644 → 3640 → 3635 → 3630 → 3620
🔴 SELL ZONE: 3675 – 3677
SL: 3681
TP: 3670 → 3665 → 3660 → 3650 → 3640
Summary:
✅ Bigger picture: Bullish trend intact – look for buys off liquidity support zones.
⚡ Short-term: take quick SELLs around liquidity resistance for intraday setups.
👉 Follow MMFLOW TRADING for precision plans: BUY with structure, SELL with liquidity.

XAUUSD – Breakout in Action, Next Liquidity Zones AheadMarket View:
Gold (XAUUSD) has just broken out of consolidation, confirming bullish momentum. After the accumulation phase, price surged strongly, showing buyers remain in control. The focus now shifts to the next liquidity zones above, with upside momentum still dominant.
Key Levels (H1/H15):
Immediate Resistance: 3621 – 3633
Next Liquidity Sell Zone: 3649 – 3650
Extended Target: 3669 – 3678
Support: 3595 – 3580 – 3572
Technical Outlook:
Breakout confirms continuation of the bullish trend.
As long as price holds above 3595, the structure stays intact.
A clean break through 3621–3633 opens the path towards 3649–3669.
Trading Plan:
BUY (preferred):
Buy on retest around 3595–3600
SL: 3580
TP: 3621 → 3633 → 3649 → 3669+
SELL scalp (alternative):
Only if strong rejection occurs at 3632 – 3634
SL: 3640
TP: 3625 → 3630 → 3620
Summary:
✅ Breakout confirmed, bullish momentum remains strong.
👉 Watch 3621–3633 and 3649–3650 closely for the next trading opportunities.
Follow MMFLOW TRADING for more updates and execution setups!

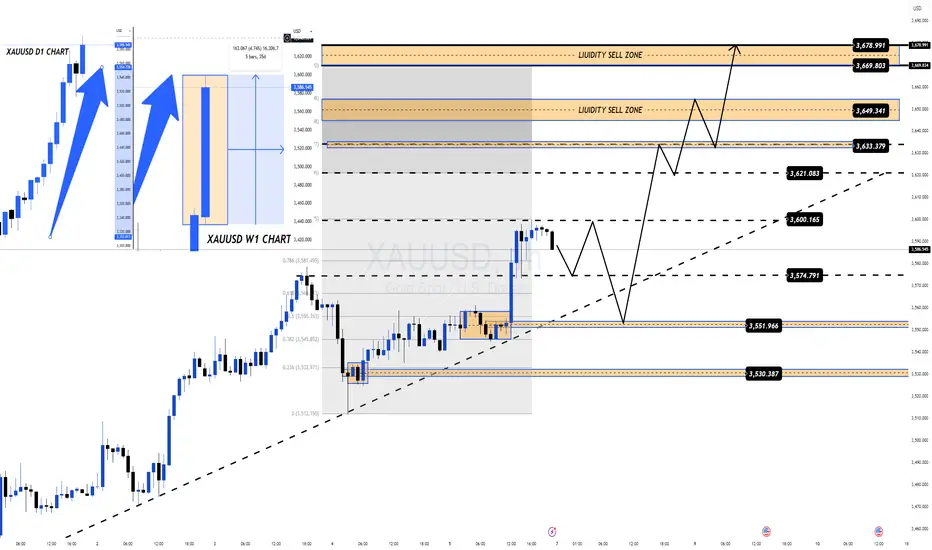
Weekly Outlook: Strong Bullish Momentum Meets Key US Data XAUUSD – Weekly Outlook: Strong Bullish Momentum Meets Key US Data | MMFLOW TRADING
Market View:
Gold (XAUUSD) ended the week with explosive momentum after Nonfarm Payrolls pushed price to a new ATH near $3600/oz. On the daily chart, the bullish candle closed with only ~30% wick, showing no signs of profit-taking. The weekly chart also printed a powerful bullish candle, confirming BUY dominance. This suggests that gold could see further upside in the coming week – and potentially throughout this month.
Macro & Fundamental Drivers (Week Ahead):
Key US data will drive volatility in XAUUSD:
Wed, Sep 10: Core PPI & PPI m/m → hotter-than-expected prints could support USD short term, weighing on gold.
Thu, Sep 11: CPI (Core, m/m, y/y) + Jobless Claims → the most critical release. Softer CPI + higher jobless claims would fuel gold’s rally, while hotter CPI keeps Fed hawkish.
Fri, Sep 12: UoM Consumer Sentiment & Inflation Expectations → inflation outlook could shape Fed expectations further.
Overall, fundamentals may create volatility, but the medium-term bias stays bullish.
Technical Outlook (H1 Chart):
Price is consolidating sideways after the Nonfarm breakout. Key levels to watch next week:
Support: 3574 – 3551 – 3530 – 3516
Resistance: 3600 – 3621 – 3633 – 3649 – 3669 – 3678
Trading Plan:
BUY bias (preferred):
Long on pullbacks around 3574–3550
SL: below 3530
TP: 3600 → 3621 → 3633 → 3649 → 3669 → 3678
SELL scalp (alternative):
Only if 3530 breaks with strong CPI upside surprise → target 3516/3527
Summary:
✅ Gold remains in a strong uptrend on both Daily and Weekly charts, with macro factors favouring further upside if inflation continues to ease.
👉 Watch 3592 (bullish trigger) and 3575 (bearish trigger) – these are the decision points for the next major move.
Follow MMFLOW TRADING for daily updates and trade setups.
XAUUSD – Gold Trading Plan Before NFP | MMFLOW TRADINGGold (XAUUSD) has been consolidating in a sideway range (355x–354x) after several days of sharp gains. Yesterday, price reacted strongly at the 357x liquidity zone, triggering a short-term correction before stabilising back into balance.
Now, the market is narrowing its range while waiting for the Non-Farm Payrolls (NFP) release later today — the key driver that will likely set the next directional move.
📊 Macro Context
If NFP comes in better than expected, Gold could extend its correction lower, filling liquidity gaps towards 352x – 350x before offering fresh long opportunities.
If NFP data disappoints, Gold may break ATH (357x) and push higher toward the next liquidity & FIBO extension levels near 3594+.
🔑 Key Resistance Levels
3560 – 3576 - 3594
🔑 Key Support Levels
3540 - 3528 – 3514 - 3502 – 3488 – 3478
📌 Trade Setups (MMFLOW Trading Plan)
🔵 BUY Zone: 3488 – 3486
🔴 SL: 3480
✔️ TP: 3492 – 3496 – 3500 – 3510 – 3520 – 3530 – 3540 – ????
🔵 BUY Scalp: 3528 – 3526
🔴 SL: 3520
✔️ TP: 3532 – 3536 – 3540 – 3550 – 3560 – ????
🔴 SELL Scalp: 3574 – 3576
🔴 SL: 3580
✔️ TP: 3570 – 3565 – 3560 – 3550 – 3540 – 3530 – ????
🔴 SELL Zone: 3593 – 3595
🔴 SL: 3600
✔️ TP: 3588 – 3584 – 3580 – 3570 – 3560 – 3550 – ????
📊 MMFLOW Trading View:
Gold is sideway ahead of NFP, and today’s breakout from the 3540–3565 range will decide the next major move. Liquidity remains key — watch how price reacts at 3515–3528 on the downside or 3576–3595 on the upside.

GOLD London Session Update – Sideways Before the Big MoveGold (XAUUSD) continues to consolidate within the 354x – 352x range, building a clear sideways structure after its recent strong rally.
📊 MMFLOW VIEW (London Session Focus)
The market is now in accumulation mode as the London session develops – volatility is expected to increase as liquidity builds up.
If price breaks above ATH 3546, momentum could quickly push gold towards the Liquidity Sell Zone 357x.
On the other hand, if 3526 support fails, we may see a liquidity sweep with price retracing into the FVG & Liquidity Buy Zone 3508 – 3480 before resuming the bullish trend.
🔑 Key Levels (London Watchlist)
Resistance: 3546 | 3564 | 3576
Support: 3526 | 3508 | 3494 | 3480
⚠️ During the European session, gold often builds false breaks to collect liquidity before the real move.
👉 Stay patient and wait for a clean breakout confirmation before committing to a position.
🔥 Follow MMFLOW TRADING for real-time plans into the New York session – don’t miss the big move!

GOLD breaks above $3500 – New ATH every day! What’s next?Gold (XAUUSD) is entering its hottest phase, moving 50–60 points per day with explosive volatility. Price is now reacting at a key FIBO extension resistance, where SELL pressure has appeared but still lacks strong confirmation on higher timeframes (H1–H2).
📊 MMFLOW VIEW
Sideway → Breakout → Consecutive All-Time Highs (ATH).
FVG zones & Key Liquidity levels are still supporting the BUY side.
SELL setups remain secondary and only valid with clear volume confirmation.
Main scenario: Wait for liquidity retest → Focus on BUY setups.
🔑 KEY LEVELS
Resistance: 3440–3446 (ATH) | 3564 | 3576 | 3586 | 3595
Support: 3528 | 3508 | 3494 | 3480 | 3468
🎯 MMFLOW PLAN
✅ BUY ZONE: 3481 – 3479
SL: 3474
TP: 3486 – 3490 – 3495 – 3500 – 3510 – 3520 – 3530 – ???
✅ BUY SCALP: 3496 – 3494
SL: 3490
TP: 3500 – 3510 – 3520 – 3530 – 3540 – ???
❌ SELL ZONE: 3576 – 3578
SL: 3584
TP: 3570 – 3565 – 3560 – 3555 – 3550 – 3540 – 3530 – 3520 – 3510 – 3500
⚠️ Warning: GOLD is in a high-volatility phase – wrong entries can get wiped out instantly.
👉 Be patient, wait for Key Levels, and stick to proper RISK MANAGEMENT above all.
🔥 This is the MMFLOW TRADING PLAN – follow us to stay updated and catch the next big moves in GOLD!

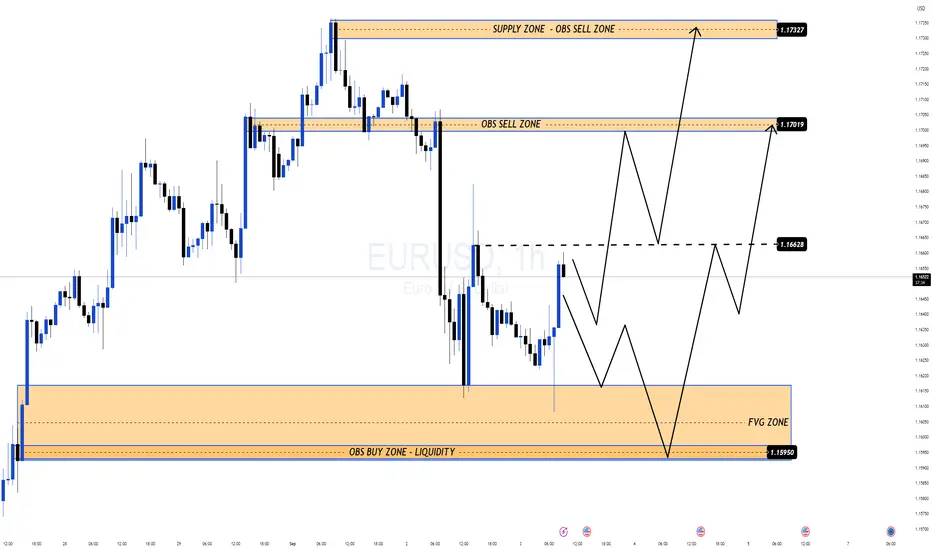
EURUSD – Liquidity Trap or Big BUY Opportunity?EURUSD is consolidating after a sharp drop, currently balancing between the upper Supply Zone and the Liquidity + FVG Zone below. This area is critical to determine the next major move.
📊 MMFLOW VIEW
Buyers are trying to recover, but price is facing strong resistance at OBS Sell Zone 1.1701 – 1.1732.
If price gets rejected, we expect a pullback into OBS Buy Zone & FVG 1.1595 to grab liquidity before a potential rally.
A clean breakout above 1.1732 could trigger a stronger bullish leg.
🔑 Key Levels
Supply Zone – OBS SELL Zone: 1.1701 – 1.1732
Liquidity Buy Zone – FVG: 1.1595
Pivot Level: 1.1662 (balance point between buyers & sellers)
🎯 Trading Plan
✅ SELL Scenario (short-term, high risk)
Entry: 1.1700 – 1.1730
SL: 1.1745
TP: 1.1660 – 1.1620 – 1.1600 – 1.1595
✅ BUY Scenario (main setup, high probability)
Entry: 1.1595 – 1.1600 (OBS Buy Zone – Liquidity)
SL: 1.1575
TP: 1.1660 – 1.1700 – 1.1730 – ???
⚠️ Important Notes
Market is prone to false breaks & liquidity traps.
Prioritize BUY setups at liquidity zones – SELL only with confirmed volume rejection.
Always manage risk properly, avoid FOMO at supply levels.
🔥 This is the MMFLOW TRADING Plan – follow for updates and don’t miss the next EURUSD move!
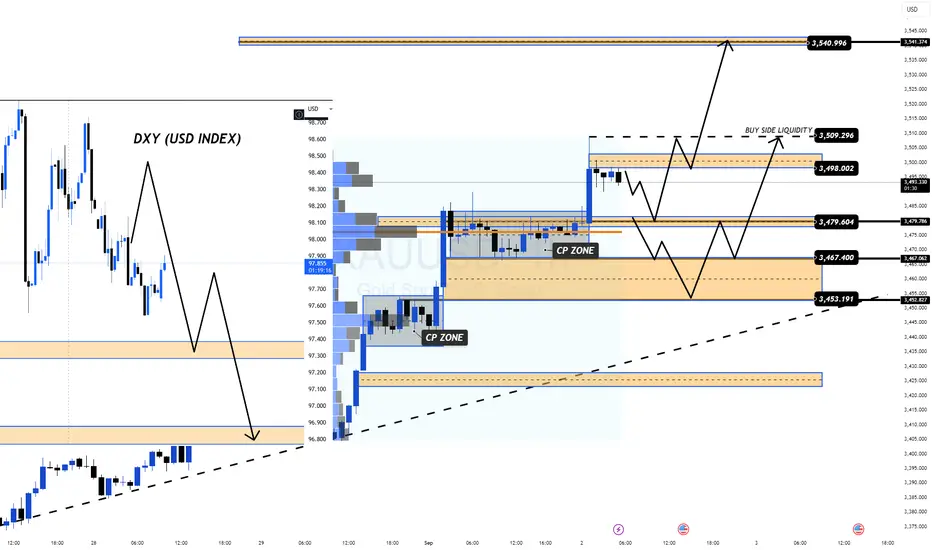
Gold Explodes Higher ( ATH ) – Is Another All-Time High Coming? Gold (XAUUSD) continues to show relentless strength as the DXY weakens and markets price in the likelihood of a FED rate cut.
With investors fleeing cash and rushing into safe havens, gold remains the natural choice – and momentum suggests we could see new highs forming day after day until year-end if USD comes under further pressure.
🔎 Macro Outlook
FED rate cuts are increasingly expected → bearish USD, bullish Gold.
Geopolitical tensions fuel demand for safe-haven assets.
Liquidity keeps favoring the upside – no strong reason for profit-taking yet.
📊 Technical Outlook (H1 / H4)
Gold has been forming sideway accumulation zones with heavy volume, followed by strong breakouts. This structure shows that buyers are still in full control.
Support Zones (Buy Zones):
3,482 – 3,480
SL: 3,474
Targets: 3,486 – 3,490 – 3,495 – 3,500 – 3,505 – 3,510 – 3,520 – 3,530 – 3,540 – ???
Resistance Zones (Sell Zones):
3,540 – 3,542
SL: 3,548
Targets: 3,530 – 3,520 – 3,510 – 3,500 – ???
As long as price respects accumulation structures, the bias remains strongly bullish. Only a clear sentiment shift or exhaustion at higher FIBO extensions would justify mid-term selling.
⚠️ Key Reminder
These days, volatility is extremely high. Expect sudden liquidity sweeps and spikes. Stick to your TP/SL discipline to protect capital – the market is punishing anyone careless.
💡 Conclusion:
The path of least resistance for Gold remains up. The safest strategy is Buy-the-Dip while respecting risk management.
✅ If you found this analysis useful, don’t forget to like 👍 and follow MMFLOW TRADING to stay updated with the next Gold setups.
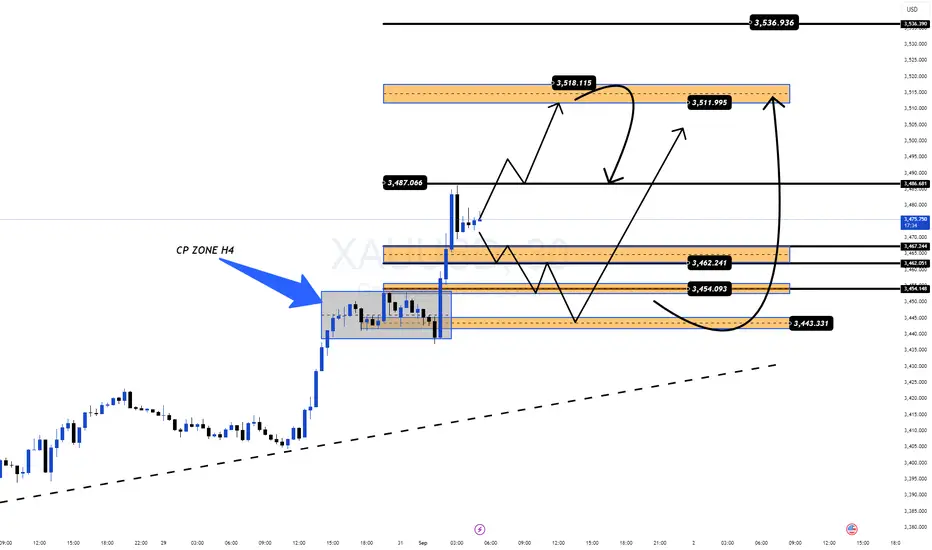
Gold Surges $70+ – Extreme Volatility, Traders Stay Sharp!Market Overview
Gold (XAUUSD) has just witnessed a shocking $70+ rally, sparking intense volatility across global markets.
Rising geopolitical tensions are driving safe-haven demand to the extreme, making gold the centre of attention worldwide.
In this highly tense and unpredictable environment, every entry decision could be a make-or-break moment for traders.
🔎 Macro Outlook
🌍 Geopolitical risks → Money continues to flow into gold as a safe haven.
💵 USD & bond yields are not strong enough to halt the momentum.
📊 Upcoming PCE data & Fed policy decisions could inject even more volatility.
📊 Technical Outlook (H4)
After the explosive rally, gold consolidated within CP Zone H4 before breaking out higher.
Key Support Zones
3,462 – 3,443 → Critical levels to sustain the bullish structure.
Key Resistance Zones
3,487 – 3,518 → Possible reaction area before correction.
A breakout could open the path to 3,536 and beyond.
📌 Possible Scenarios
Scenario 1 (Preferred)
✅ Price holds above 3,462 → Tests 3,511 – 3,518 and potentially breaks towards 3,536.
Scenario 2 (Deeper Pullback)
⚠️ If 3,462 fails → Price may retest 3,443 before regaining upward momentum.
🎯 Trading Plan (Reference Only)
✅ BUY ZONE 1
Entry: 3453 – 3451
SL: 3446
TP: 3460 – 3465 – 3470 – 3475 – 3480 – ???
✅ BUY ZONE 2
Entry: 3444 – 3442
SL: 3438
TP: 3450 – 3460 – 3470 – 3480 – ???
❌ SELL ZONE
Entry: 3512 – 3514
SL: 3518
TP: 3505 – 3500 – 3495 – 3490 – 3480 – 3470
💡 Final Thoughts
Gold remains in a strong uptrend, fuelled by geopolitical risk and macro flows.
Yet after such an aggressive move, a technical correction is highly likely.
Traders should carefully monitor price action around support/resistance zones for optimal entries.
❗ Most importantly: stick to risk management & Stop Loss discipline – in markets like this, survival comes before profit.
Gold’s Relentless Rally: Hard Lessons Every Trader Must Face💥This past week, Gold surged without a single technical pullback. The rally was so sharp and one–sided that many traders who were holding Sell positions had no chance to exit safely. The result? Blown accounts, heavy drawdowns, and a painful reminder of what happens when we ignore risk.
📉 When the Market Ignores Technicals
Technical Analysis (TA) works—until the market decides otherwise.
In periods of aggressive flows, patterns, indicators, and even trendlines can fail completely.
At such times, the only thing that separates survivors from blown accounts is risk management and discipline.
🔑 Trading Lessons You Can’t Afford to Ignore
1️⃣ Stop Loss is your life jacket – Without it, one wrong move can sink your entire capital.
2️⃣ Never hold onto losing trades hoping for a reversal – The market doesn’t care about your hopes.
3️⃣ Capital management is more important than perfect analysis – One bad trade should never define your future.
4️⃣ Accept losses to survive – The best traders aren’t always right, but they always live to fight another day.
💡 A Message to Every Trader
Last week’s move in Gold taught us one brutal truth:
👉 No discipline = No capital.
👉 No capital = No trading career.
If you’ve taken heavy losses, don’t let it break you. See it as a turning point to rebuild with stronger rules and discipline. Markets will always offer opportunities, but only for those who protect themselves first.
✅ Final Takeaway
This week, don’t just stare at charts—revisit your trading plan and strengthen your discipline.
Remember: discipline may not make you rich overnight, but it will keep you alive long enough to get there.

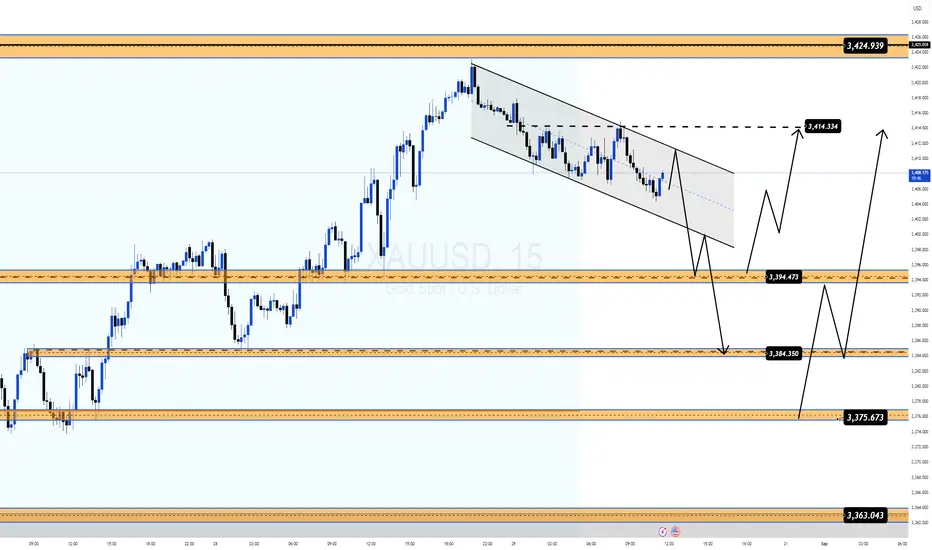
Gold at a Turning Point: Will PCE Data Trigger the Next Breakout🟡 XAUUSD PLAN UPDATE – MMFlow Trading
📰
Fundamental Context
Later today, traders are watching the US PCE Price Index – the Fed’s preferred inflation gauge.
Forecast: unchanged from the previous reading, which means no major inflation pressure.
If the data comes in slightly stronger for the USD, gold could face short-term downside pressure before bouncing.
Pre-news behaviour often includes liquidity grabs around key levels before the real move begins.
📊 Technical Outlook (M15)
Gold is trading inside a descending channel with several important zones:
Resistance / Supply:
3414.3 → short-term cap.
3424 – 3425 → strong supply zone.
Support / Demand:
3394.4 → interim support.
3384.3 → key demand zone.
3375.6 → structural support, trend pivot.
3363.0 → last line of defence if breakdown occurs.
🎯 Trading Scenarios (Pre & Post PCE)
1️⃣ Bullish Bias (primary scenario)
Holding above 3384 – 3375 suggests a rebound.
Break of 3414 opens the door to 3424 – 3425.
A clean break above 3425 could extend the bullish leg towards 3435+.
2️⃣ Bearish Scenario (if USD strengthens)
Failure at 3414 – 3420 may trigger a pullback towards 3384 – 3375.
A decisive break below 3375 risks further downside into 3363.
📍 Trade Plan (Guidance Only)
Buy zone: 3384 – 3375 (with confirmation signals).
Sell zone: 3414 – 3425 (short-term trades only, especially pre-news).
Stops: 5–7$ beyond key levels.
Targets: 10–20$ depending on risk appetite.
✅ Conclusion
Ahead of PCE: expect gold to accumulate within the channel, hunting liquidity.
After PCE: if data is slightly USD-positive, gold may dip into 3384 – 3375 before resuming its broader bullish path.
The overall bias remains bullish while above 3375 – 3363.
XAU/USD – End-of-Month Liquidity Sweep SetupGold is currently in a short-term corrective phase at the end of the month. Based on historical data, the past 4 months show that Gold tends to make a deep liquidity sweep towards the downside before resuming its bullish leg. This could once again be the case today.
📊 Key Observations:
Gold has shown repeated end-of-month wicks from 343x down to 335x zones.
Today’s focus: market may sweep liquidity below 3395 into the lower support zones before resuming higher.
Upcoming Core PCE data could trigger intraday volatility. If results align with the previous reading → short-term bearish pressure is expected before the larger bullish continuation.
📌 Key Levels & Zones
🔹 Resistance Zones
Supply Zone (3434 – 3436) → Ideal for short-term SELL setups.
Upper Resistance (3424 – 3435) → Breakout above this could open path to new ATH levels.
🔹 Support Zones
Key Support 1 (3395 – 3390) → First intraday liquidity area.
VPOC Zone (3376 – 3374) → Strong BUY zone, expect sharp reaction if price sweeps here.
Deep Liquidity Zone (3363 – 3355) → Extreme support; unlikely unless a major unexpected event occurs.
📌 Trading Plan
✅ BUY Zone
Entry: 3376 – 3374
SL: 3369
TP: 3380 – 3385 – 3390 – 3400 – 3410 – 3420 – ???
🎯 Best area to build long positions – aligned with VPOC & liquidity sweep expectations.
✅ SELL Zone
Entry: 3434 – 3436
SL: 3440
TP: 3430 – 3425 – 3420 – 3410 – 3400
⚠️ Short-term setup only – focus on Asian & London session corrections.
📍 Conclusion:
Expect liquidity sweep lower first before a bullish leg continues.
Watch 3395 – 3375 zones for BUY confirmations.
If price holds above 3375, Gold remains bullish heading into September.

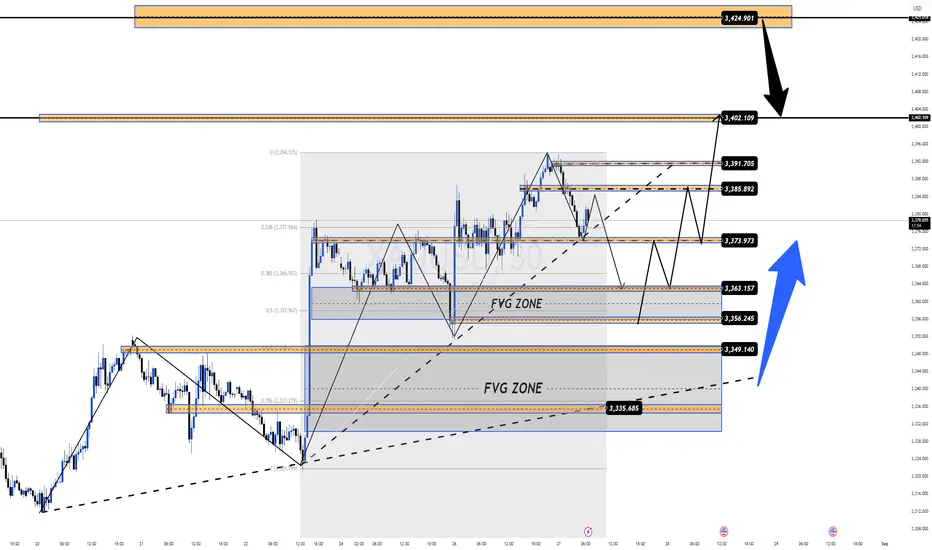
Will Gold Drop for Liquidity Before a Big September Rally?Gold has been consolidating at high levels, repeatedly testing resistance while waiting for end-of-month US data (Prelim GDP q/q & Unemployment Claims). These releases could act as the perfect trigger: a sharp liquidity grab before September’s rally – when USD weakness and Fed rate cuts are back in focus.
🔑 Key Levels to Watch
Resistance 3400 → a clean break could send price quickly into 342x – 343x, retesting the old ATH.
Support 3370 → if broken, gold may dip into the 335x BUY zone for a strong setup.
📌 MMFLOW Trading Plan
✅ BUY ZONE
3356 – 3354
SL: 3349
TP: 3360 → 3365 → 3370 → 3375 → 3380 → 3390 → 3400+
❌ SELL ZONE
3424 – 3426
SL: 3430
TP: 3420 → 3395 → 3390 → 3385 → 3380 → 3370
🎯 MMFLOW View
End of month often brings sharp swings & liquidity hunts. Be prepared for a potential flush into 335x before the next leg higher.
👉 Stick to discipline, trade only around Key Levels, and avoid chasing price.
🔥 What’s your view – will Gold smash through 3400 first, or dip into 335x before the rally?
👇 Share your thoughts in the comments – let’s trade smart together!

XAU/USD — All Eyes on US Data, Gold Ready for a Big Move!
Gold continues to hold strong buying pressure despite the recovery of the USD (DXY). The market is now waiting for today’s key US economic releases during the New York session:
📊 USD Prelim GDP q/q → Forecast: 3.1% (Prev. 3.0%)
📊 USD Unemployment Claims → Forecast: 231K (Prev. 235K)
🔎 Possible Scenarios
1️⃣ If US data comes out strong → Gold could break down from the rising channel, targeting the VPOC 3374, and with heavier pressure even dip towards the 335x zone (though this might be harder to achieve).
2️⃣ If US data is weak / neutral → Gold is likely to continue its bullish leg, aiming at 3392 – 3398 and potentially extending to 342x – 343x to retest the previous ATH.
📌 Key Levels to Watch
Resistance: 3398 – 3400 → breakout could fuel a quick rally into 342x – 343x
Support: 3374 → break below opens room to 335x
Buy Zone: Watching for a sharp dip into 335x – 337x for clean long setups
🎯 MMFLOW Strategy
👉 Priority remains: wait for a liquidity grab / sharp dip to BUY in line with the broader trend.
👉 Be cautious — with this being the main economic release of the week, volatility can spike aggressively when the numbers hit.
🔥 What do you think?
Will Gold break higher into new ATHs, or will we see a liquidity sweep first before the next leg up?
💬 Share your view in the comments — let’s trade smart together!
FOMO Buying Still Strong, Waiting for a Clean Pullback to BUY MMFLOW TRADING PLAN XAUUSD
Gold continues to hold its bullish momentum in the Asian session today, testing the 9x zone before pulling back towards the 7x level. Buyers remain in control, driven by strong FOMO sentiment as the USD shows signs of weakness.
👉 MMF’s outlook:
We remain bullish long-term – looking for cleaner pullbacks to secure safer BUY entries and hold positions towards higher targets.
🔎 Short-Term Outlook (1–2 days)
If price breaks the 337x structure, we may see a quick drop towards 335x – 334x liquidity zones before resuming the upside and potentially heading into NEW ATH territory.
Watch key support and resistance zones closely to identify high-probability entries.
📌 Key Levels to Watch
Support: 3363 – 3356 – 3349 – 3335
Resistance: 3385 – 3391 – 3402 – 3425
🎯 Today’s Trading Plan
🔵 BUY Scalp
Entry: 3356 – 3354
SL: 3350
TP: 3360 – 3365 – 3370 – 3375 – 3380 – 3390 – 3400 – ???
🔵 BUY Zone (Swing/Position)
Entry: 3336 – 3334
SL: 3330
TP: 3340 – 3345 – 3350 – 3360 – 3370 – 3380 – 3400 – ????
🔴 SELL Scalp
Entry: 3385 – 3387
SL: 3390
TP: 3380 – 3375 – 3370 – 3365 – 3360 – 3350
🔴 SELL Zone
Entry: 3401 – 3403
SL: 3407
TP: 3396 – 3390 – 3380 – 3370
📌 Summary:
Gold remains in a strong uptrend, but the best opportunities may come from waiting for deeper pullbacks to BUY. Traders can either scalp within today’s ranges or aim for long-term positions from the lower buy zones.
USDJPY – Downward Pressure Aiming Straight At 146.000?📉 USDJPY Under Pressure – Could the Drop Extend to 146.000 and Beyond?
The US Dollar continues to weaken across the board, and USDJPY is now showing strong bearish momentum on the H2 timeframe. The chart highlights several critical Fair Value Gaps (FVGs) and liquidity zones that could guide price action in the coming sessions.
📊 Technical Outlook (H2):
Recent rejection confirms supply pressure, opening the door for a deeper retracement.
Key FVG Zone between 148.57 – 149.52 acts as a short-term supply area.
As long as price trades below this zone, bearish continuation remains in play.
🔑 Levels to Watch:
147.94 – minor reaction zone.
146.56 – 146.03 → strong demand / liquidity pool; price may test these levels soon.
A clean break below 146.00 could open the path toward deeper downside targets.
⚡ What This Means:
With USD weakness persisting, USDJPY could face another significant leg lower. Traders should monitor liquidity grabs and confirmations around the 146.xx zone for potential setups.
🔥 Do you see USDJPY holding the 146.00 demand area, or will the sell-off accelerate further?
👇 Share your view in the comments!

USD Weakness Fuels EUR/USD Recovery – Key Levels to WatchThe US Dollar is showing renewed weakness, and major pairs are gaining momentum in response. EUR/USD, in particular, is setting up for a potential bullish continuation after retesting a key liquidity zone.
📊 Technical Outlook (H2 Chart):
Price has retested the 1.1619 liquidity zone, holding above the sell-side liquidity at 1.1602.
This creates a foundation for a possible upside push.
If bullish momentum continues, watch for:
1.1701 → first resistance.
1.1722 → stronger supply zone.
1.1743 → key buy-side liquidity target.
👉 Scenarios to keep in mind:
1️⃣ If 1.1619 holds as support, buyers could drive price toward 1.1722 – 1.1743.
2️⃣ A break back below 1.1602 would invalidate the bullish setup and expose deeper downside.
⚡ Key Takeaway:
USD weakness is providing tailwinds for majors – EUR/USD is aligning with this broader trend. Traders should focus on liquidity zones and wait for confirmation before committing to entries.
🔥 Will EUR/USD build momentum toward 1.1743, or will sellers defend resistance?
👇 Share your thoughts in the comments!

XAU/USD M15 Update – Breakout or Fakeout?Gold has been consolidating in a tight 336x – 337x range throughout the day. Now, price is showing signs of pushing back towards the short-term high at 3377 – 3382.
👉 Two possible scenarios are on the table:
1️⃣ Liquidity Grab (Fake Breakout): Price retests the high → triggers FOMO buys → sharp rejection back down towards 3363 – 3355 liquidity zones.
2️⃣ Clean Breakout: If buyers hold control and break above 3382 – 3384, momentum could accelerate into the 3400 – 3402 resistance zone.
📌 Key Levels on M15:
Resistance: 3377 – 3384 | Major: 3400
Support: 3363 – 3354 – 3341
⚡ Trading Notes:
Don’t chase price into resistance.
Wait for clear confirmation around 3382 – 3384 before committing.
Scalpers can look for quick plays at 3363 – 3355 (buy zone) or fade rejection at 3382 – 3384 if breakout fails.
🔥 Gold is at a decision point – will it break higher into 3400 or trap longs before a deeper correction?
What’s your take? Drop your view below 👇

Downtrend Broken! Watch These Liquidity Zones for Big MoveMMFLOW Trading Plan | 26 Aug 2025 ⚡️
💰Gold is gearing up for a strong move!
Gold has broken the H4 downtrend line, showing strong buying momentum and liquidity sweeps, signaling a potential bullish continuation.
⚠️Warning: wide support zones below may trigger quick pullbacks to collect liquidity.
📊Market Context
USD is weakening amid political and Fed uncertainty
Trump attempting to influence lower interest rates, supporting gold
H4 downtrend line broken → buyers in control
Short-term: expect sideways movement + liquidity tests
Watch for quick spikes – FOMO buy zones are often targeted
⚡️Key Levels
Resistance: 3378 → 3384 → 3400
Support: 3363 → 3354 → 3340
🔥Trading Scenarios
✅BUY SCALP (Quick Moves – Short-term)
🔵Entry: 3355 – 3353
🔴Stop Loss: 3349
✔️Targets: 3360 → 3365 → 3370 → 3380 → 3390 → 3400+
✅BUY ZONE (Longer Setup – Swing)
🔵Entry: 3341 – 3339
🔴Stop Loss: 3335
✔️Targets: 3345 → 3350 → 3355 → 3360 → 3365 → 3370 → 3380 → 3390 → 3400+
💠SELL SCALP (Quick Reversals)
🔵Entry: 3382 – 3384
🔴Stop Loss: 3388
✔️Targets: 3378 → 3374 → 3370 → 3365 → 3360 → 3350
💠SELL ZONE (High Risk – Big Moves)
🔵Entry: 3400 – 3402
🔴Stop Loss: 3406
✔️Targets: 3395 → 3390 → 3385 → 3380 → 3370 → 3360
⚠️Risk Notes
Expect fast drops or spikes – stops can trigger quickly
Sideways movement likely in sessions + retests of highs
Only trade when price action confirms key zones
🎯Key Takeaways
Gold is poised for strong bullish continuation, but pullbacks will occur to collect liquidity
Use support/liquidity zones for entries, resistance zones for exits
MMFLOW = Market Rule | Key Levels = Profit

GOLD PLAN – Post-Jackson Hole: Correction or Breakout Ahead?Last week, Gold exploded higher after the Jackson Hole Symposium and dovish tones from the FED. The weaker USD fueled bullish momentum, and many investors are now eyeing new ATHs in the near future. But here’s the catch: after such a sharp rally, markets often need a healthy pullback before the next leg higher.
📊 Technical Outlook (H4)
Gold is consolidating inside a tightening triangle structure, signaling that a major breakout is on the horizon.
Friday’s strong bullish candle confirms buyers’ control, but history shows: before every strong breakout, Gold loves to create a deeper liquidity sweep to shake out weak hands.
Key levels from FIBO and previous supply/demand zones will be crucial for decision-making this week.
📌 Key Levels to Watch
Resistance: 3370 – 3383 – 3400 – 3425
Support: 3350 – 3340 – 3326 – 3315
🔥 Trade Plan
BUY ZONE
Entry: 3340 – 3338
SL: 3334
TP: 3345 – 3350 – 3355 – 3360 – 3370 – 3380 – 3390 – 3400+
SELL ZONE 🔴
Entry: 3400 – 3402
SL: 3407
TP: 3395 – 3390 – 3385 – 3380 – 3375 – 3370
⚠️ MMF Insights
Priority: Buy on corrections rather than chasing highs.
Wait for confirmation at Key Levels before entering – don’t let emotions dictate your trades.
Remember: Gold’s game is always psychology + patience – only disciplined traders will hold their edge.
✨ The market is gearing up for a big move – do you see a breakout coming this week? 🚀
👉 Drop your thoughts in the comments below!

BTC/USD – H1 Trading Plan | Key Levels in FocusBitcoin is still trading within a clear downtrend under the H1 descending trendline. After the recent drop, price is consolidating around short-term equilibrium zones, setting up potential sell continuation setups while leaving room for a possible short-term bounce from demand areas.
📊 Technical Outlook
113,393 → Key resistance (confluence of supply + descending trendline).
111,407 → Short-term support, could provide a reaction.
108,793 → Major demand zone, critical for potential bullish bounce.
📝 Trading Scenarios
Scenario 1 – Sell the pullback (Primary Bias)
Entry: 113,000 – 113,400
Stop Loss: Above 114,000
Targets: 111,400 → 110,000 → 108,800
Scenario 2 – Buy from demand (Countertrend idea)
Entry: 108,800 – 109,000
Stop Loss: Below 108,300
Targets: 110,500 → 111,400 → 113,000
⚠️ Risk Notes
Main trend remains bearish – buy setups are only for short-term retracements.
A clean breakout above 113,400 may shift structure, opening the way towards 115,000+.
H1 may create false signals; wait for confirmation from price action before executing trades.
👉 What do you think? Will BTC continue its drop towards 108,800 📉, or will buyers defend demand and push for a rally back above 113k 🚀?
