MMM

3M (MMM) Navigates Challenges and Beats Earnings Estimates
In a recent quarterly report, multinational conglomerate 3M ( NYSE:MMM ) showcased resilience in the face of challenges, beating earnings estimates for the fourth quarter of 2023. The maker of iconic products like Post-it notes and Scotch tape reported adjusted earnings of $2.42 per share, surpassing the Zacks Consensus Estimate of $2.31 per share. This marks a positive trend for the company, which has consistently outperformed earnings expectations over the last four quarters.
Earnings Performance:
3M's earnings surprise of 4.76% in the latest quarter follows a robust performance a quarter ago, where the company exceeded expectations by a substantial 14.53%. Despite facing headwinds, 3M has demonstrated its ability to adapt and deliver strong financial results. The company's earnings growth from $2.28 per share a year ago to the current $2.42 per share reflects a steady upward trajectory.
Revenue Resilience:
While the quarterly revenues of $8.01 billion slightly fell short of the year-ago figure of $8.08 billion, 3M managed to beat the Zacks Consensus Estimate by an impressive 4.25%. This consistent ability to surpass revenue expectations highlights the company's agility in navigating market challenges.
Guidance and Market Response:
Despite the positive financial results, 3M's stock experienced an 11% drop to a seven-week low after the company provided its earnings guidance for 2024. The projected adjusted earnings of $9.35 to $9.75 per share fell below the consensus estimate of $9.82 per share. The market response underscores the significance investors place on forward-looking guidance.
CEO Perspective and Strategic Initiatives:
3M's Chairman and CEO, Mike Roman, expressed optimism about the company's performance in 2023, citing successful execution of priorities, expansion of operating margins, and progress in organizational restructuring. The CEO emphasized initiatives such as simplifying the supply chain, advancing the healthcare spin-off, and addressing legal matters, including resolving litigation related to products like earplugs for soldiers and environmental concerns.
Investor Concerns and the Path Forward:
The discrepancy between the company's strong quarterly results and the cautious outlook for 2024 raises questions among investors. The potential impact of ongoing legal matters and the restructuring efforts initiated by 3M add an element of uncertainty. Investors are keenly awaiting insights from management during the upcoming earnings call, seeking clarity on the company's strategies to overcome challenges and capitalize on opportunities in the coming year.
Conclusion:
3M's recent financial performance reflects a mix of resilience and caution, with the company navigating challenges successfully in the past year. As investors assess the stock's future potential, the focus shifts to management's commentary on the earnings call, where insights into the company's strategies, risk mitigation, and growth plans will play a crucial role in shaping investor sentiment. 3M's journey in 2024 will be closely watched, and the stock's trajectory may depend on how well the company addresses investor concerns and executes its strategic initiatives.

3M's net profit is up. What about its shares? 25/10/2023Earnings season continues in the US, and 3M reported its second consecutive increase in net profit, with 2.68 USD per share, which is higher than the company's or analysts' expectations.
In addition, the company is a dividend aristocrat. At the time of writing this text, the dividend yield of the company's securities was at 6.83%, significantly higher than the US average.
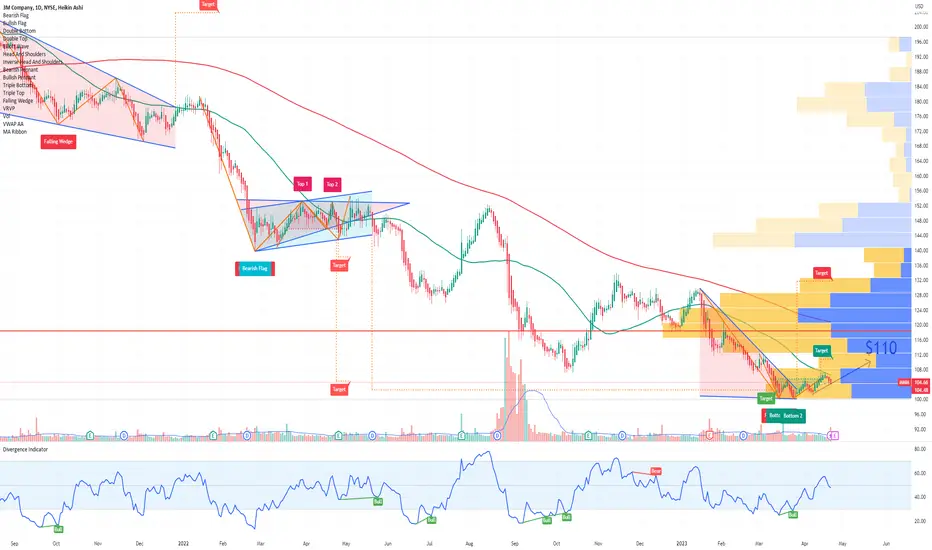
Therefore, it will be interesting to look at the 3M Co. (NYSE: MMM) stock chart today.
On the D1 timeframe, support has formed at 85.35, with resistance at 90.30. These levels are determined based on the price's highs and lows during the resulting downward trend. In addition, a "double bottom" trend change pattern has been formed. If the resistance level is broken through (the bar on D1 closes above 90.30), the stock price may rise to 108.37.
On the H1 timeframe, after resistance at 90.30 is broken through, the short-term target for the price increase is around 98.09; while in the medium term, it could reach 108.37.
—
Ideas and other content presented on this page should not be considered as guidance for trading or an investment advice. RoboMarkets bears no responsibility for trading results based on trading opinions described in these analytical reviews.
The material presented and the information contained herein is for information purposes only and in no way should be considered as the provision of investment advice for the purposes of Investment Firms Law L. 87(I)/2017 of the Republic of Cyprus or any other form of personal advice or recommendation, which relates to certain types of transactions with certain types of financial instruments.
Risk Warning: CFDs are complex instruments and come with a high risk of losing money rapidly due to leverage. 67.85% of retail investor accounts lose money when trading CFDs with this provider. You should consider whether you understand how CFDs work and whether you can afford to take the high risk of losing your money.

MMM 3M Company Options Ahead of EarningsIf you haven`t bought MMM ahead of the previous earnings:
Then analyzing the options chain and the chart patterns of MMM 3M Company prior to the earnings report this week,
I would consider purchasing the 87usd strike price Calls with
an expiration date of 2023-11-3,
for a premium of approximately $2.39.
If these options prove to be profitable prior to the earnings release, I would sell at least half of them.
Looking forward to read your opinion about it.

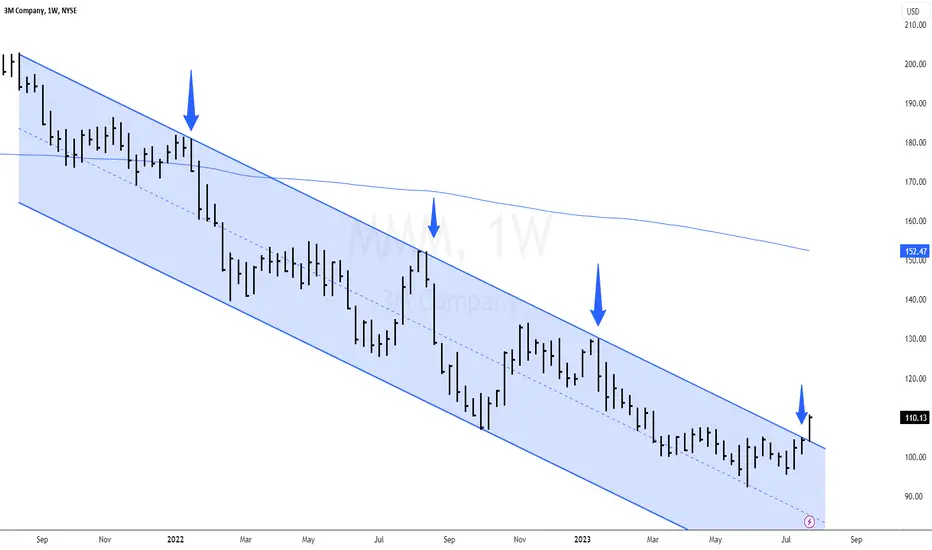
$MMM Parallel Downtrend BreakNYSE:MMM Bearish to Bullish Reversal, In a notable development for 3M Company ( NYSE:MMM ), the stock appears to have broken its parallel downtrend, a pattern that has been influencing its price movement for an extended period. A parallel downtrend consists of two downward sloping trend lines that chart the lower highs and lower lows of an asset over time. This break could signify a potential shift in investor sentiment and may be indicative of a forthcoming bullish cycle.
The break from a downtrend is often considered a bullish signal in technical analysis and could be followed by an upward momentum. However, traders should exercise caution and look for confirmation through other technical indicators such as volume, moving averages, or Relative Strength Index (RSI) to validate the trend reversal. High trading volumes accompanying the break could bolster the case for a sustained upward trajectory.
3M: Not far now! 🦅The 3M stock was able to undershoot the support at $92.38 in the past weeks. Now it is not far to the green target zone between $83.82 and $74.28, where we expect the low of the white wave (II). To capitalize on the expected change in direction, long positions can be opened within the zone. Stops should be placed about 1% below the zone, as a 36% likely alternative would still see a lower white wave alt.(II) low.

Nasdaq is following in the footsteps of #MMMNYSE:MMM
CME_MINI:NQ1!
OANDA:NAS100USD
PEPPERSTONE:NAS100
I noticed the relationship between the #MMM movement in the past and the Nasdaq movement now. If based on the #MMM chart, then the goal for us is about 9000 points.

3M Company Is At Technical Support3M Company with ticker MMM has been trading bearish for the past 5 years, actually since the beginning of 2018, where we see a completed higher degree wave III.
The wave structure from 2018 highs is in three waves A-B-C, which indicates for a higher degree wave IV correction. We can now see it sitting at interesting 90 support area, especially if we consider equal wave length of waves A=C that stopped at the former wave 3 swing high resistance around that 90 area.
A recovery back above channel resistance line and 210 region would be definitely signal that higher degree wave V is in progress, which would send the price back to all-time highs.

MMM BUYHello, according to my analysis of 3M stock. There is a wonderful investment opportunity. The stock broke the downward trend. The strong resistance at 107 was broken. Also, a very positive green candle formed on the daily time frame. Indicates a strong entry of buyers. good luck for everbody

New LogoAs you all have probably seen, we have changed our logo and name! Shortly, we will go online with our website on which were are going to provide you with free daily market updates - more than one per day.
But for the time being, let us look at the 3M chart where we can see an increasingly strong bullish impulse. It is important that the pressure is kept high until we confidently cross the resistance at $117.80. There, we should see a small setback, before the bulls take over again. It is important that the course remains above $92.38.

MMM 3M Company Options Ahead of EarningsIf you haven`t bought MMM here:
Then analyzing the options chain and chart patterns of MMM 3M Company prior to the earnings report this week,
I would consider purchasing the 105usd strike price Calls with
an expiration date of 2023-8-18,
for a premium of approximately $2.93.
If these options prove to be profitable prior to the earnings release, I would sell at least half of them.
Looking forward to read your opinion about it.

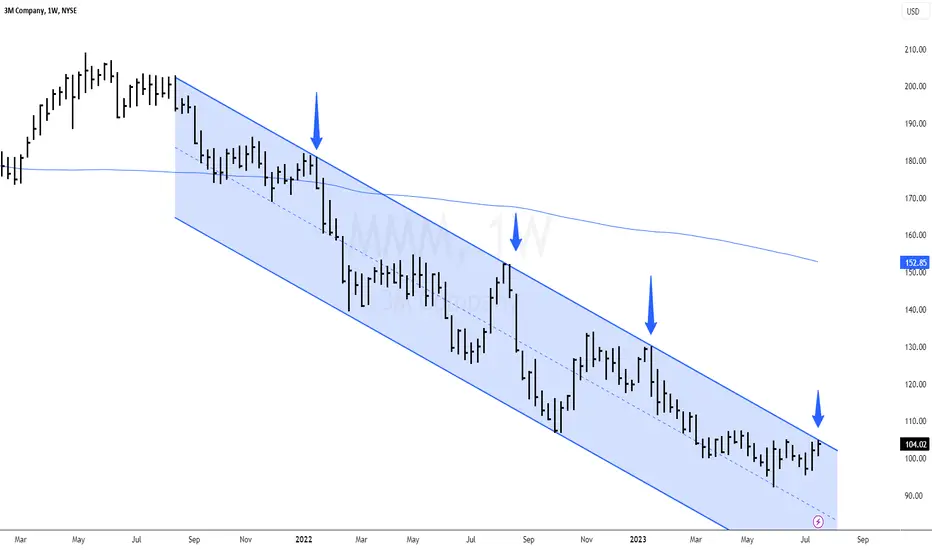
$MMM Update Parallel Trend Break OutNYSE:MMM Update Parallel Trend Break Out. One of my favorite trades this month was NYSE:MMM breaking out. This stock is a long term play. We also have a algorithm buy alert.
Excellent Opportunity in MMM above 107.05Possible trendline breakout in MMM. It may move upward as depicted on the chart if it crosses 107.05 and trades above this level for 15 to 30 minutes.

$MMM Parallel Down Trend About To Reverse NYSE:MMM Parallel Down Trend About To Reverse? As this bull market progress you get sector rotation. For example profit taking in big Tech stocks. I have seen that consistently since this bull market started back in 10-13-2022, here is an example of a consumer products stock that pays a nice dividend yield.
A bearish to bullish reversal is a technical analysis pattern that occurs when the price of a stock or other asset moves from a downtrend to an uptrend. This can be a sign that the market is about to change direction and start moving higher.
Daily Market Analysis - WEDNESDAY JULY 12, 2023Greetings, traders! Welcome back to our daily Market Analysis. Today, we have gathered the top news and interesting fundamental analysis for your consideration. Let's dive in and stay informed!
Key events:
New Zealand - RBNZ Interest Rate Decision
USA - Core CPI (MoM) (Jun)
USA - CPI (YoY) (Jun)
USA - CPI (MoM) (Jun)
Canada - BoC Interest Rate Decision
USA - Crude Oil Inventories
The energy and large technology sectors were the primary contributors to Tuesday's gains in the stock market, while investors awaited the forthcoming inflation reports with bated breath. The rise in value of the Dow Jones Industrial Average was 317 points, or 0.9%, while the rise in value of the S&P 500 was 0.7% and the rise in value of the Nasdaq was 0.6%.
DJI indice daily chart
SPX500 indice daily chart
As a result of an improved demand outlook, oil prices skyrocketed, which provided a boost to the energy sector. There is a growing expectation that the oil market will tighten in the second half of this year. This expectation is supported by falling crude production as well as Saudi Arabia's commitment to cutting output by one million barrels per day beginning in July. The sentiment surrounding energy stocks was further buoyed by reports of potential stimulus measures in China, which is the largest importer of energy in the world.
The stock of 3M Company (NYSE: MMM), which was upgraded by Bank of America to Neutral from Underperform, increased by almost 5% as a result of the upgrade. It is anticipated that the manufacturer of industrial and consumer products will benefit from the conclusion of legal issues, which is anticipated to enhance the performance of the company. A settlement agreement was reached between 3M and the government last month to resolve allegations that the company contaminated public water systems with PFAS, which are also known as forever chemicals.
MMM stock daily chart
After receiving an upgrade from Hold to Buy from Jefferies, JPMorgan (NYSE: JPM) led the banking sector higher just as earnings season was about to begin on Friday. As justifications for the upgrade, Jefferies pointed to the robustness of JPMorgan's balance sheet as well as the company's potential for earnings. Gains were also seen by regional banks, which have come under increased scrutiny ever since the banking crisis that began earlier this year. After Bank of America reaffirmed its recommendation to buy the company's stock, US Bancorp (NYSE: USB) saw its share price rise by more than 3.5%. US Bancorp is well-prepared to handle sector headwinds, according to Bank of America, and is expected to achieve superior earnings growth and stock performance, according to the statement.
JPM stock daily chart
Amazon (NASDAQ: AMZN), which benefited from its two-day prime day sales event, stood out as one of the few stocks in the technology sector that was trading in the positive territory. During this time, Microsoft (NASDAQ: MSFT) struggled to make gains, despite the growing optimism surrounding the impending acquisition of Activision by Microsoft for $69 billion. Activision is the company that makes the Call of Duty video game. The attempt by US regulators to temporarily block the deal due to antitrust concerns was rejected by a federal judge in a ruling earlier today.
The forthcoming publication of US CPI (Consumer Price Index) data has become the sole focal point of attention for stock futures trading in both the United States and Europe. The majority of speculators are expected to be surprised by the US inflation data, which analysts strongly anticipate will exceed their expectations.
AMAZON stock daily chart
The change in the Consumer Price Index (CPI) for the United States is expected to be 0.3% month-over-month (m/m), while the change in the CPI year-over-year (y/y), which is the most significant change, is expected to be 3.1%, compared to the previous reading of 4.0%.
If the actual number comes close to or matches the forecasted 3.1%, it will be seen as positive news for the market because the inflation target set by the Federal Reserve is 2%. On the other hand, market participants are likely to rejoice if the reading falls below 3.1% because this indicates a significant shift in the trend of inflation. Nevertheless, it is essential to pay close attention to the trajectory that the reading of inflation will take in the future. Although the data that are released today will show a significant drop, which will be driven by tighter monetary policy, an economic slowdown, and lower oil prices, these factors will have less of an influence on the inflation number going forward. As a consequence of this, the gap between the Fed's target and the actual reading might not expand by an additional factor of two from its previous magnitude.
GOLD daily chart
It is anticipated that the price of gold will be volatile throughout the course of the day. Even though the support level at $1,900 is strong, it may be put to a significant test if the inflation data continues to show no signs of easing. Gold prices would be supported by a sizeable decline in the reading of inflation, which could potentially lead to an attempt to test the $1,950 level. On the other hand, if the reading indicates that inflationary pressures will continue for some time, the price of gold may go up even further. As a result, there is a greater chance that the Federal Reserve will raise interest rates, potentially on more than one occasion.

3M: I Want to Break Free 💪3M wants to break free from the compound consisting of the red zone between $93.83 and $107.35 and the green zone between $92.38 and $105.93, where it has finished wave (II) in white. To achieve this, the share has already developed convincing upwards momentum, which should soon carry it out of the zone-compound and above the resistance at $117.80. There, 3M should complete wave (3) in red before a counter movement should take it back below this mark. As soon as wave (4) is concluded, though, 3M should resume the overarching ascent. However, there is still a 33% chance that the share could lose its momentum and tumble below the support at $92.38. In that case, we would have to reckon with a new low in the form of wave alt.(II) in white first before a sustainable upwards movement can start.

$MMM parallel down trendNYSE:MMM has monthly support at the horizontal line. needs to break this parallel down trend before it can start a new uptrend.
✨ NEW: 3M (MMM) ✨ Swing/Position Trade ✨SLO @ 124.50 ⏳
TP1 @ 85.20
TP2 @ 60.00
BLO @ 52.80 ⏳
ADDITIONAL INFO:
Based on the fundamental analysis below, I'm anticipating a swing to the upside before price action returns to the downside and continues to drop toward Demand (75D). Once we reach Demand @ ~52.80, I'll hold this equity as a Position Trade up to Major Resistance @ ~175.75.
COMPANY REVIEW:
3M makes for a great investment because it is a diversified technology company that produces a wide range of products, including adhesives, abrasives, coatings, electronic materials, industrial tapes, medical supplies, and more. The company has a strong track record of innovation and growth, and it is one of the largest and most respected companies in the world.
3M has announced plans to invest $1 billion in research and development over the next five years. This investment will help the company to develop new products and technologies that will drive future growth.
FINANCIAL PERFORMANCE:
3M has consistently generated strong financial results over the past few years. In the most recent fiscal year, the company reported revenue of $33.8 billion and earnings per share of $10.33. 3M's return on equity (ROE) is 36.1%, which is significantly higher than the average for the S&P 500 index. 3M's stock price has been on the rise in recent months. The stock price has increased by over 20% in the past year. This is likely due to a number of factors, including the company's strong financial performance, its positive outlook for the future, and the previously low interest rates environment.
VALUATION:
3M's stock is currently trading at a price-to-earnings ratio (P/E) of 10.1. This is below the average P/E ratio for the S&P 500 index, which is 15.7. This suggests that 3M stock may be undervalued.
DIVIDENDS:
3M is a dividend-paying company. The company has increased its dividend for 60 consecutive years, which is a testament to its strong financial performance. The current dividend yield is 6.19%, which is higher than the average dividend yield for the S&P 500 index.
RISKS:
There are some risks associated with investing in 3M stock. (1) The company faces competition from other global manufacturers, (2) it is also exposed to economic downturns related to the technology sector, and (3) the raised interest rates, by the Feds, opposed to 3M's stock price. When interest rates are increased, investors are more likely to lessen their investment in stocks, However, 3M has a strong track record of innovation and growth, which should help it to mitigate these risks.
However, it is important to do your own research before making any investment decisions. You should consider your own financial situation and risk tolerance before investing in any stock.

3M Position Trade✨ NEW: 3M...UT (3M, 3D) ✨ POSITION TRADE ✨
BLO1 @ 74.34
BLO2 @ 50.99 (Wealth Trade - I may never let this position go)
TP1 @ 112.53 (shave 25% from BLO 1)
TP2 @ 175.83 (shave 25% from BLO 1)
TP3@ 215.82 (shave 25% from BLO 1)
3M Co. is a technology company that creates industrial, safety, and consumer products. They operate under different segments such as Safety and Industrial, Transportation and Electronics, Health Care, and Consumer.
Recently, the company has faced a major challenge involving around 260,000 pending lawsuits due to their military earplugs malfunctioning. The outcome of these legal proceedings could greatly impact 3M, either causing severe consequences or presenting a unique investment opportunity.
Our team predicts that despite the uncertainty, institutions will likely intervene and purchase 3M's stock as it returns to its established pattern of gradual and steady growth, also known as the company's intrinsic or true value. However, it is important to acknowledge that the future outcome is still subject to change and could sway in either direction.
Here is my strategy: I plan to sell 25% of my BLO1 holdings at every take profit point, while keeping the remaining amount for a long-term investment. However, I have no plans to sell any of my BLO2 holdings and will be holding them for the long term. This is commonly referred to as the "diamond hand strategy."
Happy Trading‼️

3m is on monthly support 3m is on monthly support and all set to take off wait for the confirmation as it could be a great trade according to risk and reward ratio

3M Company (MMM) | Technically ready!3M Company (MMM)
3M is a multinational conglomerate that has operated since 1902, when it was known as Minnesota Mining and Manufacturing. The company is well known for its research and development laboratory and it leverages its science and technology across multiple product categories.
As of 2020, 3M is organized into four business segments: safety and industrial, transportation and electronics, healthcare, and consumer. Nearly 50% of the company's revenue comes from outside the Americas, with the safety and industrial segment constituting a plurality of net sales. Many of the company's 60,000-plus products touch and concern a variety of consumers and end markets.
A quite good dividend stock has arrived at the destination, hopefully :)
MMM has come down from its all-time high of more than 60%. So, to buy this you need to make also a bit of work with fundamentals but technically, as said, it has arrived inside a possible buying zone.
The technical criteria are:
1. Old resistance back in 2004 to 2012, starts to act as a support level. Yes, you can and actually you have to look back as far as possible to determine the strongest areas on the chart. The world has changed but human psychologic is still the same!
2. Mentioned many times that you have to keep an eye on the round numbers. Here is also the round number $100 and it matches with other criteria.
3. Channel projection, white lines. Typically the price moves inside the channels and sometimes it helps to find a decent support level. Currently, the projection runs nicely through the optimal buying zone.
4. Equal waves (AB=CD) and the D point, which completes the pattern, staying inside the buying zone.
5. All-time Fibonacci Golden ratio 62%. Basically draw from an all-time low to an all-time high and the Golden ratio is also there to add a bit of strength to the possible reversal area.
Technically an optimal buying zone could be $80 - $102
First targets $135-$150
Good luck!

MMM Major Confluence for a bottomThe confluence is unreal, going back to 1998. I think this could be an amazing buy.

MMM 3M Company Options Ahead of EarningsIf you haven`t bought those calls here:
Then analyzing the options chain of MMM 3M Company prior to the earnings report this week,
I would consider purchasing the 110usd strike price Calls with
an expiration date of 2023-9-15
for a premium of approximately $4.45.
If these options prove to be profitable prior to the earnings release, I would sell at least half of them.
I am interested to hear your thoughts on this strategy.