Repeated Weakening Pumps — Expecting 0.25–0.30 Before DopThe chart shows a clear pattern: price delivers a pump every time, but each subsequent impulse is weaker than the previous one . Momentum is fading, and the structure suggests that buyers are losing strength with every attempt.
In the short term, I expect another local push into the $0.25–$0.30 zone , aligning with previous reaction levels. However, given the consistent decline in pump strength, this move may form just another lower high, followed by the start of a new downward leg 0.1$
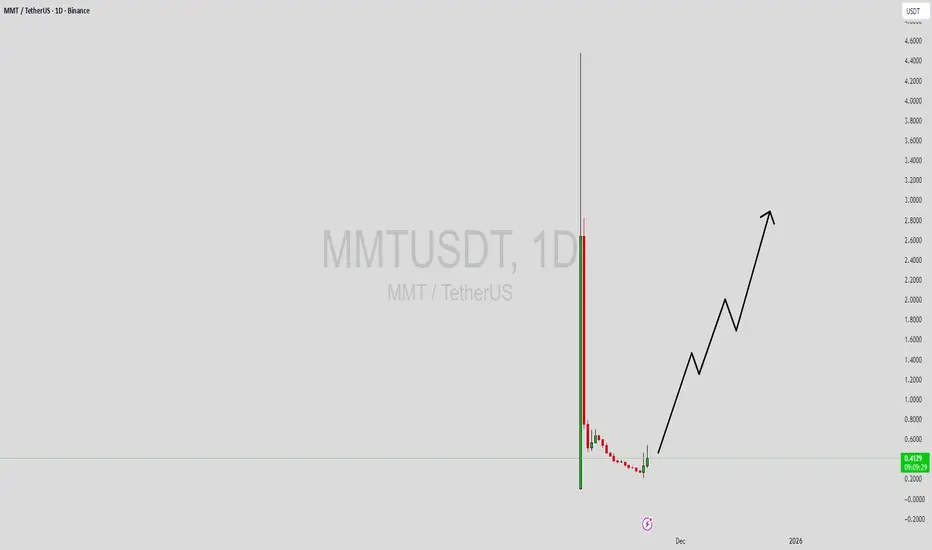
MMTUSDT

MMTUSDT Forming Bullish WaveMMTUSDT is forming a clear bullish wave pattern on the daily and 4-hour charts, a powerful continuation signal that underscores surging momentum in the Sui DeFi ecosystem amid late 2025's altcoin volatility. The price has been advancing through a series of higher highs and higher lows around $0.40, reflecting strong buyer conviction following the recent 94% daily pump and buyback program launch that tightened supply dynamics. With good trading volume exploding to over $1 billion in the last 24 hours—dominated by Binance's MMT/USDT pair—the setup signals robust accumulation, as RSI surges past 70 and the wave structure aligns with Momentum's ve(3,3) governance incentives. The projected move could lead to an impressive gain of 290% to 300%+ once the price clears the $0.50 resistance, targeting explosive levels up to $1.60 in the midterm uptrend.
This bullish wave pattern typically unfolds during recovery phases or established uptrends, symbolizing a decisive pivot to optimistic sentiment as MMTUSDT rebounds from its October lows near $0.29. Traders closely watching MMTUSDT are highlighting the intensifying impulse waves driven by over 2.1 million users, $600 million TVL, and $26 billion in cumulative volume, which position Momentum as the Sui chain's premier liquidity hub. The good trading volume adds confidence to this pattern, demonstrating that market participants are piling in early ahead of further ecosystem expansions like cross-chain RWA trading and liquidity incentives.
Investors’ growing interest in MMTUSDT reflects rising confidence in the project’s long-term fundamentals, from the November 10 buyback initiative using DEX fees to the airdrop resolution deadline that could spark renewed FOMO. If the wave confirms with sustained volume on a push above $0.45, this could unleash the start of a massive bullish extension, bolstered by listings on Bitget and LBank. Traders might find this a valuable setup for medium-term gains, especially as the bullish wave matures and buying momentum propels toward $2+ in the 2025 DeFi surge.
✅ Show your support by hitting the like button and ✅ Leaving a comment below! (What is You opinion about this Coin) Your feedback and engagement keep me inspired to share more insightful market analysis with you!
MMT Analysis (2H)On the higher timeframes, we are in a large bearish structure, but on the lower timeframes the structure has turned bullish, and it is expected to continue moving until all the marked liquidity on the chart is collected. There is a strong pivot on the chart, and the probability of the price getting rejected from it is high.
The targets for this rejection are marked on the chart.
A 4-hour candle closing above the invalidation level will invalidate this analysis
Do not enter the position without capital management and stop setting
Comment if you have any questions
thank you

MMTUSDT IdeaHey traders, its my view!
Short-Term Scenario for next 1–4 hours:
Entry: $0.52 – $0.54 Need current consolidation
Target 1: $0.79
Target 2: $1.60
Stop Loss: Below $0.47
Mid-Term Scenario (4–12 hours:
If price breaks and holds above $1.60:
Target 3: $2.58
Confirmation needed from MACD bullish crossover + volume increase.
Bearish Scenario in 30-Min chat:
If RSI dips below 30 again and price breaks below $0.45, further decline toward ~$0.38 is likely.
