#MNT/USDT Mantle Momentum: Still Full Throttle#MNT
The price is moving within an ascending channel on the 1-hour timeframe and is adhering to it well. It is poised to break out strongly and retest the channel.
We have a downtrend line on the RSI indicator that is about to break and retest, which supports the upward move.
There is a key support zone in green at the price of 1.39, representing a strong support point.
We have a trend to stabilize above the 100-period moving average.
Entry price: 1.43
First target: 1.47
Second target: 1.51
Third target: 1.58
Don't forget a simple money management rule:
Place your stop-loss order below the support zone in green.
Once the first target is reached, save some money and then change your stop-loss order to an entry order.
For any questions, please leave a comment.
Thank you.
MNTUSD

MNT/USDT —Retest: Will Mantle Hold the Line or Break Down?MNT has just completed a major breakout cycle from a long accumulation range below 1.40 USDT, marking the beginning of a strong expansion phase that pushed the price up to a peak of 2.87 USDT.
After this sharp rally, however, the chart shows a strong rejection, pulling the price back toward the historical breakout zone at 1.25–1.40, which now acts as the primary support base.
This area is more than just a technical level — it’s a decision zone that will determine whether MNT is ready to continue its mid-term bullish trend or confirm a distribution and potential trend reversal.
---
Structure & Price Pattern
The chart currently displays a breakout → retest → decision point structure, where price is testing a former supply area that has flipped into demand.
The latest 3D candle shows indecision after a strong selloff, signaling a tug-of-war between buyers defending structure and sellers pushing for breakdown.
As long as price holds above 1.25, the higher-low formation remains intact, keeping the mid-term uptrend technically valid.
---
Key Technical Zones
Main Support: 1.25–1.40 (key structural zone).
Minor Resistance: 1.73 (pivot retest zone).
Major Resistances: 2.48 and 2.87 (liquidity zones).
Next Supports if breakdown occurs: 1.00 → 0.85 → 0.45.
---
Bullish Scenario
If MNT manages to close a solid 3D candle above 1.40, this move would confirm a successful retest of the major breakout.
Such confirmation could trigger Expansion Wave 2, with potential upside targets at 1.73 → 2.48 → 2.87.
This scenario highlights the strength of buyers maintaining control over demand and extending the mid-term continuation trend.
---
Bearish Scenario
If selling pressure continues and the price closes below 1.25, the prior breakout risks becoming a false breakout or bull trap.
This scenario could trigger a liquidity sweep toward 1.00 – 0.85, and in more aggressive conditions, an extended retracement down to 0.45.
Such movement would signal the end of the expansion phase and the start of a redistribution phase.
---
Market Narrative & Conclusion
MNT is now sitting in the most critical zone of its technical cycle.
The 1.25–1.40 range will decide the next chapter:
Holding above = foundation for a new expansion phase.
Breaking below = confirmation of distribution and corrective structure.
Technically, this is the “make-or-break retest” — a moment that often precedes the next major move in the altcoin market.
---
#MNT #Mantle #Crypto #Breakout #Retest #AltcoinAnalysis #TechnicalAnalysis #KeySupport

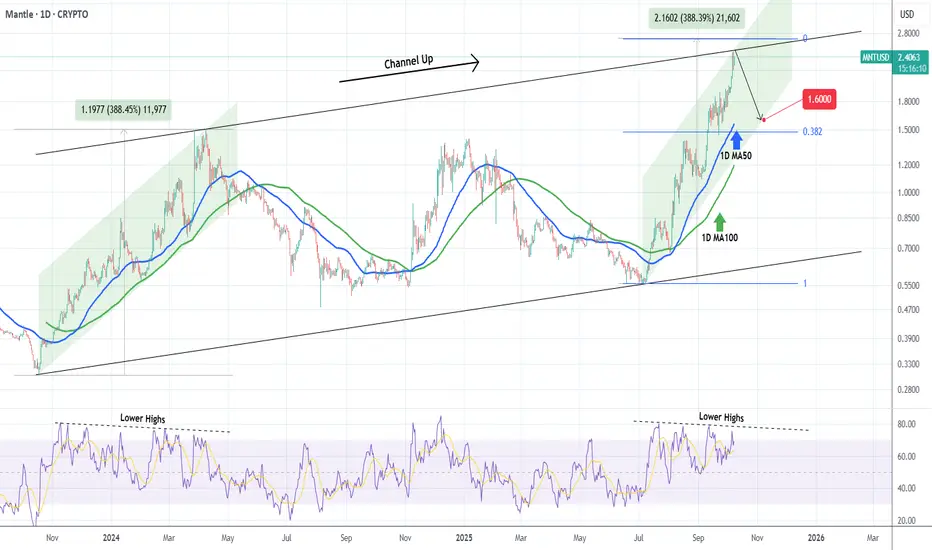
MANTLE Hit the top of its 2-year Channel Up. Correction ahead?Mantle (MNTUSD) has been trading within a Channel Up since its October 18 2023 market bottom and right now the price just hit the top (Higher Highs trend-line) of this pattern.
The current Bullish Leg has almost risen as much as the first one (+388.45%) so technically a pull-back wouldn't be unexpected at this point. Before it resumes the long-term trend and potentially breaks above the Channel Up, we expect the price to test at least its 1D MA100 (green trend-line), which is the typical Support during such Legs, a 1.600.
-------------------------------------------------------------------------------
** Please LIKE 👍, FOLLOW ✅, SHARE 🙌 and COMMENT ✍ if you enjoy this idea! Also share your ideas and charts in the comments section below! This is best way to keep it relevant, support us, keep the content here free and allow the idea to reach as many people as possible. **
-------------------------------------------------------------------------------
💸💸💸💸💸💸
👇 👇 👇 👇 👇 👇
Mantle Eyes Explosive 22% Rally Toward Key $1.29 TargetHello✌️
Let’s analyze Mantle’s price action both technically and fundamentally 📈.
🔍Fundamental analysis:
Mantle is launching a crypto bank and a $400M MI4 fund with BTC, ETH, SOL, and stablecoins in Q3 2025. If it takes off, MNT could see more use and interest from big investors.💹
📊Technical analysis:
BYBIT:MNTUSDT has held its value and respected key Fibonacci support levels during the latest market pullback 📉. Backed by solid fundamentals and strong bullish volume, I maintain a positive outlook, projecting a potential 22% move toward the 1.29 target 🚀.
✨We put love into every post!
Your support inspires us 💛 Drop a comment we’d love to hear from you! Thanks, Mad Whale

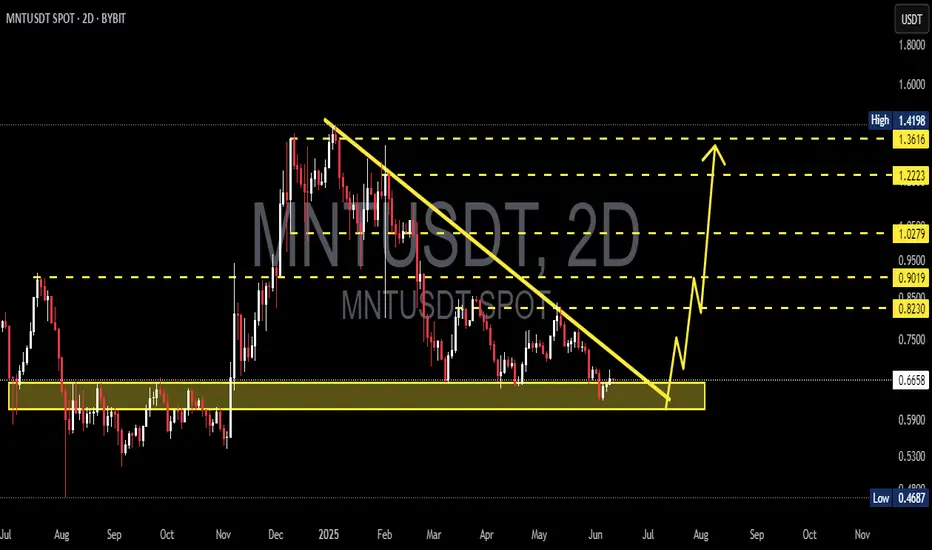
MNT/USDT Testing Strong Demand Zone – Rebound or Breakdown AheadDetailed Analysis of MNT/USDT (2D Timeframe):
The MNT/USDT pair is currently testing a strong demand zone between $0.44 – $0.58, which has acted as a key accumulation area since 2024. This level has previously triggered strong bullish reversals, making it a crucial point for the next move.
📈 Bullish Scenario:
Active Demand Zone: Price is currently sitting in a well-established demand area (highlighted in yellow), indicating potential for a strong bounce if buying pressure increases.
Upside Potential: A bounce from this zone may push price toward key resistance levels:
$0.6612 (initial minor resistance)
$0.8002 (psychological and technical barrier)
$0.9038 and $0.9500 (previous resistance zones)
Further Fibonacci extension and major resistance levels at: $1.0632, $1.2255, and $1.4126
Pattern Formation: There is potential for a Double Bottom pattern if price rebounds and breaks above $0.80, confirming a medium-term bullish reversal.
📉 Bearish Scenario:
Breakdown Risk: A confirmed breakdown below the $0.5836 support and especially under $0.44 would flip the structure to bearish.
No Strong Support Below: A drop beneath $0.44 could trigger a free fall toward $0.35 or lower, with minimal technical support in that range.
Bearish Confirmation: A breakdown with high selling volume would signal a strong distribution phase and continuation of the downtrend.
🔍 Pattern & Market Structure Summary:
The zone between $0.44 and $0.58 represents a long-term accumulation base.
If this level holds, it could spark a significant bullish move, especially if accompanied by strong volume and market sentiment.
If it fails, the chart will confirm a structural breakdown, with potential for deeper bearish continuation.
📌 Key Levels to Watch:
$0.44 – $0.58 Main Support / Demand Zone
$0.6612 Minor Resistance
$0.8002 Historical Resistance
$0.9038 – $0.9500 Key Resistance Zone
$1.0632 – $1.4126 Bullish Extension Targets
#MNTUSDT #CryptoAnalysis #TechnicalAnalysis #AltcoinSetup #DemandZone #BreakoutTrade #BullishScenario #BearishScenario #CryptoSignal

MNTUSDT 2D AnalysisMNT ~ 2D Analysis
#MNT Buy back gradually from this support block with a short term target of at least 10%+ from here. Long term target $1.4
MNTUSDT 1D Analysis MNT ~ 1D Analysis
#MNT Buy gradually after successfully breaking through this resistance line with a short-term target of at least 10%++

Long idea on $MNTI consider a candle with a large downward shadow a good opportunity to enter a position. Preferably, if the price after such a stabbing returns to 50% of the momentum of that candle, it means that a big player accumulates a position. Of course, if we fix below this figure, the signal is canceled

#MNT/USDT#MNT
We have a bearish channel pattern on a 12-hour frame, the price moves within it, adheres to its limits well, and is expected to break it upwards strongly.
We have a green support area at 0.800
We have a tendency to stabilize above moving average 100
We have a downtrend on the RSI indicator that supports the price higher
Entry price is 1.04
The first goal is 1.17
The second goal is 1.31
the third goal is 1.45

MNT - Is it a Perfect Buy Opportunity?The current support level presents a tempting opportunity.
Currently trading at $1.10, finding support on the 4-hour timeframe chart. If bulls can hold the price at or above this support level, it could signal a potential reversal and an upward trend.
If the bulls can maintain control, $1.1452 is a possible target price. This represents a potential upside of approximately 4% from the current price.
Caution is always advisable, conduct your own research and employ proper risk management strategies before making any investment decisions.

MANTLE (MNT)Mantle (MNT) is an emerging cryptocurrency that focuses on creating a robust layer-1 blockchain platform aimed at delivering high scalability, security, and interoperability. Mantle aims to streamline blockchain adoption across various industries by offering a flexible and efficient framework that supports a wide array of decentralized applications.
The current price of Mantle (MNT) is $0.97 with a 24-hour trading volume of $10 million. MNT has seen a rise of 15% in the last 24 hours, reflecting increasing market confidence and investor interest in its foundational technology.
Given Mantle's commitment to advancing blockchain utility and its recent positive market trends, the next price targets for MNT might be set at $1.2, $1.40, and $2.45. Investors could consider taking a position at the current price. This trading idea takes advantage of the ongoing enthusiasm for innovative blockchain platforms that promise to facilitate broader adoption and enhance technological capabilities.
