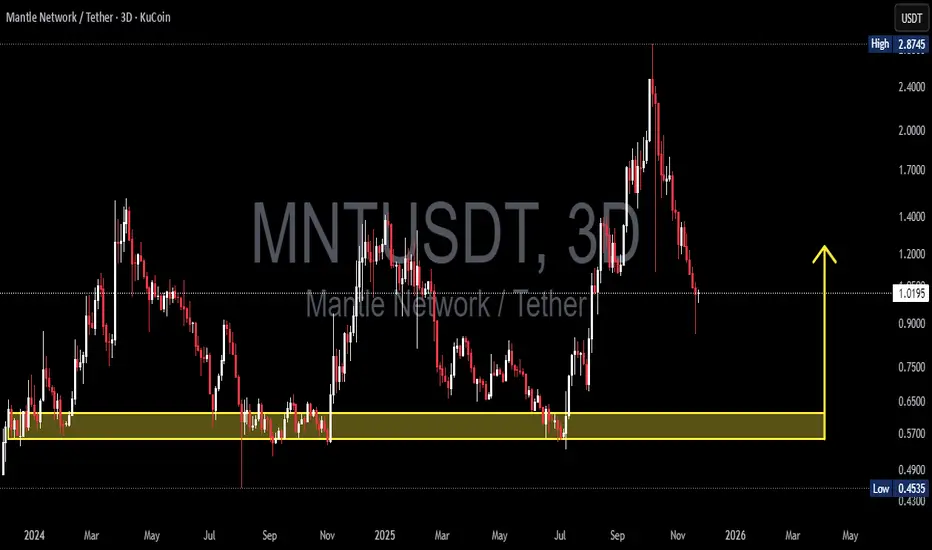
MNT/USDT — Decision Zone! Strong Rebound or Deeper Breakdown?MNT/USDT (3D) is entering the most critical phase since its parabolic rally to 2.87. After an aggressive vertical run driven by pure momentum and euphoria, the market is now in a decisive phase — where the next major trend will be defined.
The sharp drop from the peak indicates heavy distribution and a clear shift in control from buyers to sellers. But the bigger story isn’t finished yet—because price is now approaching the key historical demand zone at 0.62–0.555, an area that has acted as the main defensive wall for bulls and the birthplace of multiple strong reversals over the past year.
This is where “smart money” usually plays.
This is the battlefield that will determine whether MNT revives its mid-term bullish trend or enters a full macro downtrend.
---
🔥 Key Technical Patterns & Structure
1. A Complete Blow-Off Top
The vertical rally to 2.87 followed by a large reversal candle signals exhaustion and strong distribution.
2. Structured Correction Toward Demand
Price is sliding downward in a controlled wave structure toward the highlighted 0.62–0.555 zone.
3. Demand Zone = The Make-or-Break Area
This zone has repeatedly acted as:
strong rebound origin (Jul–Sep 2024)
major accumulation base (Q1–Q2 2025)
launchpad for the rally to local highs
If this zone holds again, bulls regain the upper hand.
If it breaks, momentum shifts decisively to bears.
---
🟢 BULLISH SCENARIO — The Path to a Strong Rebound
A bullish reversal becomes valid only if:
1. Price taps the 0.62–0.555 zone and prints a strong 3D reversal candle
(hammer, bullish engulfing, long rejection wick).
2. Market forms a Higher Low on the 3D timeframe
This signals the end of the downturn and the birth of a new bullish leg.
3. Break & 3D Close above the 1.20–1.40 region
This resistance cluster is the gateway to a full recovery.
➡️ Bullish Targets:
1.20 → 1.40 → 1.70 → 2.20 → 2.80 (local peak)
➡️ Smart-Money Accumulation Zone:
0.62 – 0.555
---
🔴 BEARISH SCENARIO — If the Demand Zone Breaks
The bearish narrative activates if:
1. Price closes below 0.555 on the 3D chart
This is a strong structural breakdown.
2. 0.62–0.555 flips into resistance after a failed retest
This is the most reliable confirmation of bearish continuation.
3. Price moves toward the liquidity pool at 0.45
A historically untouched low-level liquidity zone.
➡️ Bearish Targets:
0.555 break → 0.45 → potential deeper capitulation
---
🎯 Final Conclusion
The 0.62–0.555 demand zone is the most important level of the year for MNT.
If it holds → a major bullish recovery is possible.
If it breaks → the market shifts into a deeper correction phase.
This is the moment where the next big directional move will be decided.
#MNTUSDT #Mantle #CryptoAnalysis #KeyLevels #DemandZone #PriceAction
#MarketStructure #BullishScenario #BearishScenario #SmartMoney #ReversalZone
Mntusdsignals
MNT/USDT —Retest: Will Mantle Hold the Line or Break Down?MNT has just completed a major breakout cycle from a long accumulation range below 1.40 USDT, marking the beginning of a strong expansion phase that pushed the price up to a peak of 2.87 USDT.
After this sharp rally, however, the chart shows a strong rejection, pulling the price back toward the historical breakout zone at 1.25–1.40, which now acts as the primary support base.
This area is more than just a technical level — it’s a decision zone that will determine whether MNT is ready to continue its mid-term bullish trend or confirm a distribution and potential trend reversal.
---
Structure & Price Pattern
The chart currently displays a breakout → retest → decision point structure, where price is testing a former supply area that has flipped into demand.
The latest 3D candle shows indecision after a strong selloff, signaling a tug-of-war between buyers defending structure and sellers pushing for breakdown.
As long as price holds above 1.25, the higher-low formation remains intact, keeping the mid-term uptrend technically valid.
---
Key Technical Zones
Main Support: 1.25–1.40 (key structural zone).
Minor Resistance: 1.73 (pivot retest zone).
Major Resistances: 2.48 and 2.87 (liquidity zones).
Next Supports if breakdown occurs: 1.00 → 0.85 → 0.45.
---
Bullish Scenario
If MNT manages to close a solid 3D candle above 1.40, this move would confirm a successful retest of the major breakout.
Such confirmation could trigger Expansion Wave 2, with potential upside targets at 1.73 → 2.48 → 2.87.
This scenario highlights the strength of buyers maintaining control over demand and extending the mid-term continuation trend.
---
Bearish Scenario
If selling pressure continues and the price closes below 1.25, the prior breakout risks becoming a false breakout or bull trap.
This scenario could trigger a liquidity sweep toward 1.00 – 0.85, and in more aggressive conditions, an extended retracement down to 0.45.
Such movement would signal the end of the expansion phase and the start of a redistribution phase.
---
Market Narrative & Conclusion
MNT is now sitting in the most critical zone of its technical cycle.
The 1.25–1.40 range will decide the next chapter:
Holding above = foundation for a new expansion phase.
Breaking below = confirmation of distribution and corrective structure.
Technically, this is the “make-or-break retest” — a moment that often precedes the next major move in the altcoin market.
---
#MNT #Mantle #Crypto #Breakout #Retest #AltcoinAnalysis #TechnicalAnalysis #KeySupport

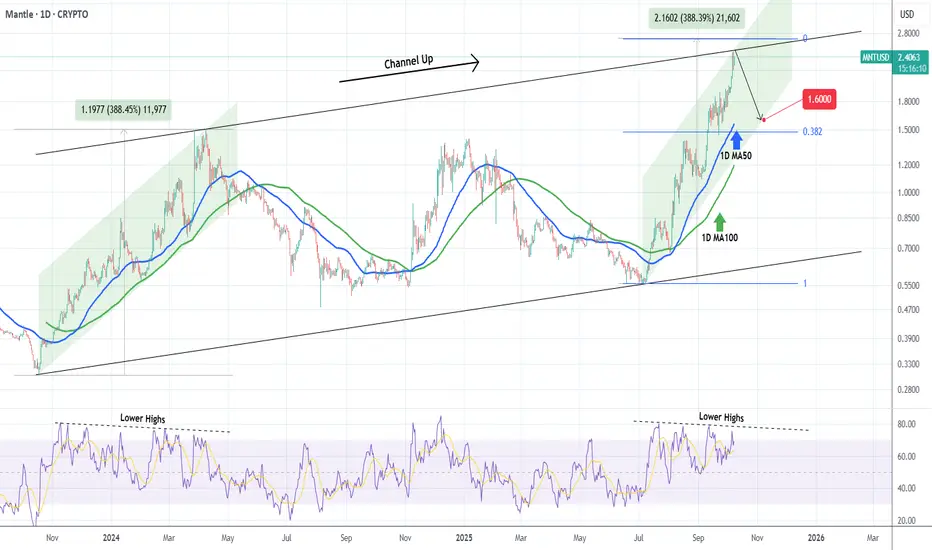
MANTLE Hit the top of its 2-year Channel Up. Correction ahead?Mantle (MNTUSD) has been trading within a Channel Up since its October 18 2023 market bottom and right now the price just hit the top (Higher Highs trend-line) of this pattern.
The current Bullish Leg has almost risen as much as the first one (+388.45%) so technically a pull-back wouldn't be unexpected at this point. Before it resumes the long-term trend and potentially breaks above the Channel Up, we expect the price to test at least its 1D MA100 (green trend-line), which is the typical Support during such Legs, a 1.600.
-------------------------------------------------------------------------------
** Please LIKE 👍, FOLLOW ✅, SHARE 🙌 and COMMENT ✍ if you enjoy this idea! Also share your ideas and charts in the comments section below! This is best way to keep it relevant, support us, keep the content here free and allow the idea to reach as many people as possible. **
-------------------------------------------------------------------------------
💸💸💸💸💸💸
👇 👇 👇 👇 👇 👇