Monero Price Analysis: Feast or Famine VersionFor those that have been following Monero, you’ve probably noticed the extraordinarily bullish sentiment that has taken hold of the protocl in recent weeks.
There are a few reasons for that:
1. On a technical trading level, Monero was looking delectable. Period.
2. There was a report that came out that valued Monero somewhere in the upper reaches around $40k at some point in the near future (which is a few hundred/thousand percent above where it is currently).
3. Monero is a solid project in general and things that are fundamentally solid in any market, with awareness and marketing behind it are never going to die.
Now that we got those facts out of the way, let’s get to the actual price analysis itself.
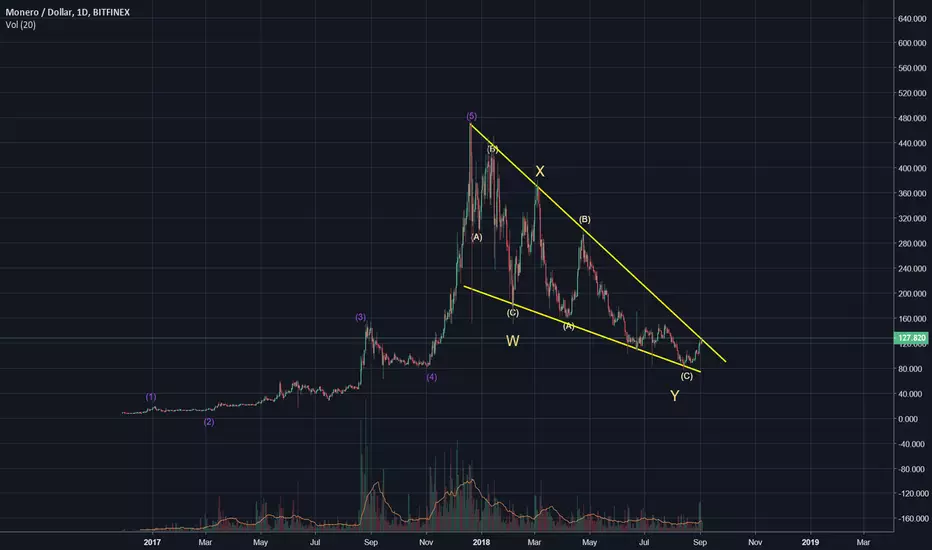
Monero Price Analysis
From the chart, we can see a break above the baby-symmetric triangle (which resulted in a reversal), into a couple of bounces that eventually let the price start jumping out of the gym before touching back down to earth (where it is now).
If the mini-uptrend on the daily chart holds, then one should expect that the price will be increasing for Monero at any point now.
Below, is another illustration of the chart to help traders get a better visual of what’s going on:
If the uptrend were to hold here, then the green arrow should symbolize where the price action will head to in the future.
But we can not just take this at face value!
This is crypto, and the price could just as easily break back down below the uptrend line.
There are a slew of negative price signals on the daily
Exponential Moving Averages
Burnt Orange = EMA-26
Lime Yellow = EMA-12
Looks like the EMA-12 may be headed down below the EMA-26, which would be bearish and the price has already crossed below both EMA indicators, which is bearish in itself. So, this is something to watch for.
However, it must be noted that the exponential moving averages are lagging indicators.
Its a bit messy, but you should still be able to clearly see the bearish cross of the MACD as well as the negative Histogram just getting started and the current bar is bigger than the last, and it also looks like the bars have just started on the negative side too. So, it looks like there's no waning on that situation coming anytime soon.
Bollinger’s Bands
Price isn’t even at the bottom of the Bollinger’s Bands on the daily. No bounce in sight.
(Continued on September 11th, 2018)
Let’s Go to the 2 Hour
As you can see in the photo above, the uptrend appears to be holding fairly and we can see a slight bounce off of the trendline at the end.
The yellow squares that you see are indicative of the touches on the trendline (please note that this does not need to be an “exact” touch, just within the general realm/region).
RSI(14) on the 2H
Truthfully, the RSI is a bit iffy here, but it does appear to be on its way up.
XMR’s fate will probably be decided, in large part, by the performance of the crypto market in general.
If the crypto market s**** the bed at some point in time, then yeah, it’s most likely that the price of Monero is going to plummet with it. While it has been defying the market trend over the past month, it has not been entirely immune to downward moves.
For the most part, Monero has been on the move while Bitcoin/crypto markets are moving sideways/going up. But when the market is headed downward, it has generally been consolidating as well (we can even observe this phenomenon on the charts now).
However, the fact that the uptrend line has held so solidly is fairly indicative of the fact that it is proving to be a reliable point of support for the price. But, a break below this could lead to the same disastrous drop in price that we had seen before.
The two pictures above show the inherent risk to traders if they are “wrong” about their long decision.
Conclusion (Strategy Advocacy; Not Financial Advice)
If it were left up to the author’s hands, and they were resolute on making some sort of play on Monero, then the best play would probably be to wait.
The author is unsure about the liquidity of shorts on Bitfinex’s platform, but if the price does break down below the uptrend line that it is on, then Monero would be an excellent short. That’s something that most readers have probably gathered at this point.
A price where this breakage below the uptrend would probably be most ‘apparent’, would be at $100. Or, one could wait until there is another massive decrease in the markets, and make sure to short a coin like Monero, because it is more than likely that it will finally depreciate like the rest of the market once it has finally broken its uptrend.
Conversely, if this does not happen, then a tentative long position should be placed at the next resistance point that gets broken.
It’s fair to assume that the next notable resistance point for Monero is hovering in the $108-$110 range.
This resistance point was determined by looking at the top of the range that Monero is trading in.
Thus, if the price breaks above the point where Monero is at currently, it would be most prudent to place a long position there and then place a S/L just below the resistance point.
Placing a long where the price is at currently could be really risky, even if you have a solid S/L on the market because a dramatic reduction in price could lead to your S/L not being fulfilled at all. And such an event is much more likely to happen in the wake of a major sell off or decrease in price (which tends to happen when price breaks below a trendline).
In either case, be safe trading!
Monerousd

MONERO - IT'S ALL ABOUT THAT TREND LINE - CryptoManiac101Pattern is bullish with this trade
What we need is to stay above that trend line which will confirm bullish movement, otherwise we will see demand zones
If you enter today have tight SL. Define how much you can afford to risk and go between 5% - 10% in SL from entry
Enjoy this trade advice my Crypto Maniacs, but remember to invest only what you can afford to lose or you're going right back to poverty on drop. We are not your financial advisors.
BITCOIN IS WHAT WILL GIVE MORE BULLISH INCENTIVE FOR MONERO

A second Chance to Buy in XMRUSD ...
Midterm forecast:
There is no trend in the market and the price is in a range bound, but we forecast resumption of uptrend.
Technical analysis:
While the RSI uptrend #1 is not broken, bullish wave in price would continue.
The price is above the 21-Day WEMA which acts as a dynamic support.
Relative strength index (RSI) is 50.
New trading suggestion:
The price is in a range bound and we forecast the uptrend would resume.
There is still a possibility of temporary retracement to suggested support line (110). if so, traders can set orders based on Price Action and expect to reach short-term targets.
If you missed our first HUNT, you have a second chance to buy above the suggested support line (110).
Entry signal:
Signal to enter the market occurs when the price comes to "Support line" then forms one of the reversal patterns, whether "Bullish Engulfing" , "Hammer" or "Valley" , in other words,
NO entry signal when the price comes to the zone BUT after any of reversal patterns is formed in the zone.
To learn more about "Entry signal" and special version of our "Price Action" strategy FOLLOW our lessons:
Trade Setup:
We opened 11 BUY trade(s) @ 89.47 based on ' Valley' entry method at 08.15.2018.
Total Profit: 25712 pip
Closed trade(s): 5606 Profit
Open trade(s): 20106 Profit
Closed Profit:
TP1 @ 105.00 touched at 08.27.2018 with 1553 Profit.
TP2 @ 130.00 touched at 08.27.2018 with 4053 Profit.
1553 + 4053 = 5606
Open Profit:
Profit for one trade is 111.81 (current price) - 89.47 (open price) = 2234
9 trade(s) still open, therefore total profit for open trade(s) is 2234 x 9 = 20106
All SLs moved to Break-even point.
Take Profit:
TP3= @ 149.00
TP4= @ 170.00
TP5= @ 192.00
TP6= @ 227.00
TP7= @ 258.00
TP8= @ 298.00
TP9= @ 378.00
TP10= @ 469.00
TP11= Free

A second Chance to Buy in XMRUSD ...
Technical analysis:
While the RSI uptrend #1 is not broken, bullish wave in price would continue.
The price is above the 21-Day WEMA which acts as a dynamic support.
Relative strength index (RSI) is 50.
New trading suggestion:
The price is in a range bound and we forecast the uptrend would resume.
There is still a possibility of temporary retracement to suggested support line (110). if so, traders can set orders based on Price Action and expect to reach short-term targets.
If you missed our first HUNT, you have a second chance to buy above the suggested support line (110).
Entry signal:
Signal to enter the market occurs when the price comes to "Support line" then forms one of the reversal patterns, whether "Bullish Engulfing" , "Hammer" or "Valley" , in other words,
NO entry signal when the price comes to the zone BUT after any of reversal patterns is formed in the zone.
To learn more about "Entry signal" and special version of our "Price Action" strategy FOLLOW our lessons:
Trade Setup:
We opened 11 BUY trade(s) @ 89.47 based on ' Valley' entry method at 08.15.2018.
Total Profit: 25712 pip
Closed trade(s): 5606 Profit
Open trade(s): 20106 Profit
Closed Profit:
TP1 @ 105.00 touched at 08.27.2018 with 1553 Profit.
TP2 @ 130.00 touched at 08.27.2018 with 4053 Profit.
1553 + 4053 = 5606
Open Profit:
Profit for one trade is 111.81 (current price) - 89.47 (open price) = 2234
9 trade(s) still open, therefore total profit for open trade(s) is 2234 x 9 = 20106
All SLs moved to Break-even point.
Take Profit:
TP3= @ 149.00
TP4= @ 170.00
TP5= @ 192.00
TP6= @ 227.00
TP7= @ 258.00
TP8= @ 298.00
TP9= @ 378.00
TP10= @ 469.00
TP11= Free

Targets hit. Lower High made on 1W. Bearish reversal.Monero eventually made a Lower High (Highs/Lows = 0.0000) on the 1W Falling Wedge (red dotted lines/ RSI = 42.243, MACD = -24.873, B/BP = -27703), which is the long term pattern that dictates the trend, hitting in the meantime our 115.494 and 120.927 targets. As seen on 1D the rejection has been emphatic with 5H oversold (STOCHRSI = 0.000, Williams = -88.858). We are now short on XMRUSD with TP = 75.792 and 64.104 in extension.

[Monero] Little Correction Before RiseMonero is ripe for a 4th wave correction to $110 levels.
I am buying during this wave because the 0.618 fib level is a maximum drop.

Monero bearish BAT Nice harmonic pattern developed in Monero, as we have run into resistance. Im looking for monero to retest the down trend line it has broken out of.
Dan

Wedge Test, Resistance TestThis is a huge testing point for Monero. Drew this up a couple days ago and if monero can break through that wedge area, the next resistance test point would be $155. However my gut, which I hope is wrong, is telling me monero is going to drop a test the support line at $115. If it can hold over $115, monero should be go at least $155 before October. If monero breaks past $115, it will test past support of $85 which I'm confident it will hold. Again, if monero breaks past $115, it shouldn't break out in mid to late October. The next week will be critical for the whole crypto market. P.S. this is not investment advice.

XMRUSD (D): Monero forecast vs USDRegular and logeritic chart (below)...
Maybe also interesting: research.bloomberg.com
Let's see what happens. Happy trading. :-)

MONERO WIRELINES PART III like to see how my ideas of novice trader were not so bad.
Fault of inexperience I overestimated the partial rise and monero is today were the arrows said.
Monero like many other coin is approaching the supply zone . This zone was a demande zone from november till june and finally was broken. In July monero did a nice big flag and was pushed away from this zone like a meteorite directed to the .. old demande zone.
Now is approaching again this level.
Here we have
1) Negative trendline
2) Demand/supply zone (i think supply zone )
3) support of the flag.
In the gray circle you have a clear bullish fractal . It is not so big so the power of the fractal is not enough to sent monero to the moon.
Your choise if you want to hodl or sodl.
Personally I trodl and I would wait a more safe entry before buying monero.
PS: based on this idea you can spot the next correction of bitcoin.

Is Monero on its way to the moon or will it fall??The biggest question of all? Are we heading higher here or has the correction finally completed??
It is about to retrace here, if in impulse I expect a drop to around 111 before heading upwards for its 5th wave. either way the next few days will likely be sideways. but 111 is a good target to reach for for a short
RSI indicates overbought, either way its coming down, though for a quick correction or are we going to find a lower low?
Making charts to buy wine and pay for surfboard repairs. #nofinancialadvice

Finally a breakout?Monero almost finished the falling wedge pattern (bullish pattern).
Watching the trend line for a breakout.

There is a possibility for the beginning of an uptrend in XMRUSDTechnical analysis:
. MONERO/DOLLAR is in a downtrend and the beginning of uptrend is expected.
. The price is below the 21-Day WEMA which acts as a dynamic resistance.
. The RSI is at 39.
. While the RSI and the price downtrend in the Daily chart are not broken, bearish wave in price would continue .
Trading suggestion:
. There is a possibility of temporary retracement to suggested support zone (84.00 to 73.00). if so, traders can set orders based on Price Action and expect to reach short-term targets.
Beginning of entry zone (84.00)
Ending of entry zone (73.00)
Entry signal:
Signal to enter the market occurs when the price comes to "Buy zone" then forms one of the reversal patterns, whether "Bullish Engulfing" , "Hammer" or "Valley" in other words,
NO entry signal when the price comes to the zone BUT after any of the reversal patterns is formed in the zone.
To learn more about "Entry signal" and the special version of our "Price Action" strategy FOLLOW our lessons:
Take Profits:
TP1= @ 105.00
TP2= @ 130.00
TP3= @ 149.00
TP4= @ 170.00
TP5= @ 192.00
TP6= @ 227.00
TP7= @ 258.00
TP8= @ 298.00
TP9= @ 378.00
TP10= @ 469.00
TP11= Free

Break-out confirmed. Attempt for a Lower High and then short.Monero is about to break the Rectangle's 109.147 Resistance, having already crossed the resisting line (straight blue) of the 1D Falling Wedge (now on bullish Highs/Lows = 6.3066, B/BP = 16.4176). Crossing the Rectangle is translated into an attempt to price a Lower High on the 1W level, which remains a strong bearish Falling Wedge (MACD = -27.038, Highs/Lows = -6.4217, B/BP = -51.2617). The Lower High should be between the 0.5 and 0.618 Fibonacci Retracement zone (113.099 - 122.130) from the previous 1W High = 150.042. We expect the blue curves to contain any further upside attempts on XMRUSD.

Consolidation steady with strong support. Await for break out.XMRUSD is consolidating on 4H within a 75.550 - 109.192 Rectangle (Ultimate Oscillator = 49.694). So far the Resisting Lower High trend line (illustrated in blue) contains any upside attempts. We need to wait for a clear break out on this line to go long (TP = 115.494 and 120.927 (0.618 Fibonacci)), or a break of the Rectangle's support to go short (TP = 64.104). Scalping the Rectangle is the option on Monero for day traders.

XMRUSD - DAILY CRYPTO - 19. AUGUST 2018WELCOME TO DACAPITAL TRADING!!
XMRUSD just started moving as expected, quick Timeframe breakdown for free and everybody.
1 HOUR
Strong bullish reaction after taking out 76.000
4 HOUR
Bullish wave started and forming new H4 Highs expecting more pressure
LEVELS
BUY XMRUSD @ 98.090
SL @ 91.580 (6.7%)
Trendtrading without TP Level!!!
We´ll move our SL Level every Day and ride the Wave be patient*
Enjoy our limited Free Content and Setups,
leave us a like and Comment!!
DACAPITAL TRADING

Targets hit. Expecting a retrace. Long.Both TP = 115.494 and 102.00 in extension have been hit for Monero, as the 1D Rectangle broke on the downside (RSI = 33.951, MACD = -9.930, Highs/Lows = -10.6465, B/BP = -23.8378). As explained the price was always geared to follow the long term dictating bearish trend of the 1W Falling Wedge and the most optimal strategy always is to short every Lower High (Highs/Lows = -31.2469). We now expect a nearly 50% (118.30) Fibonacci retracement so will go long to the previous support and TP = 115.494.

$XMRPeople who are holding aren't looking at their BTC value
- chart is all based off BTC movement, could easily dump much lower
- Alts will fall with bitcoin

Range Rover SVR Which will get in Mode Sport soonThis is just a range trading no worries and soon we will get to the moon using our Range Rover SVR Sport !!
Happy trading!!

Rejected on the 1st 1D Resistance. Short.Monero has met again the 151.54 Resistance on the 1D Rectangle (RSI = 47.266, STOCH = 47.810, ADX = 27.041) and is once more rejected with Highs/Lows = -2.0725 and B/BP = -3.6664 indicating an imminent 101.044 support test. We are short on XMRUSD with TP = 115.494 and 102.00 in extension.

