Monero had lower liquidity during the Asian session Monero had lower liquidity during the Asian session demonstrating several price gaps. The currency pair moved above the local ascending trend line during the American session, but then fell below it and even managed to cross the support area at 214. However, bears were unable to change the situation significantly as XMR price jumped off the midterm descending trendline (paint in green on the screenshot).
Later the Asian session XMR/USD managed to jump over the support area at 214. There are no candlestick signals currently.
Possible scenarios for Monero are the following:
XMR/USD will move towards the next resistance area at 219 and test this level.
Monero will cross the current support area at 214 and fall below it targeting the midterm descending trend line (green). The next aim may also be at the next support area (204).
The currency pair will stay close to the current levels with no significant fluctuations.
The currency pair jumped off the lower border of the Ichimoku cloud on the daily chart meaning bulls may have chances to change the situation in the nearest future.
Check the full crypto analysis HERE
Monerousd

Monero is trading below the ascending trend lineMonero is trading below the ascending trend line, but above the descending mid term trend line, meaning the bulls have almost gained the momentum and have the opportunity to change the situation. XMR/USD is above the Ichimoku cloud and crossed two levels within several hours, indicating serious intent.
The main two scenarios for the next 8-10 hours are the following:
The price will break through the ascending trend line and go towards the next resistance area at $219. If this happens, buyers will finally restore their domination and bulls can expect an even greater rally.
XMR/USD bounces off the ascending trend line from below, crosses the support area at $214 (the price is testing it now) and declines towards the mid term descending trend line.
Check more details HERE

Monero followed the other allies on the weekendMonero followed the other allies on the weekend as the price went along the local ascending trend line. XMR/USD entered the Ichimoku cloud and reached its upper border. However, the Ichimoku cloud prevented Monero from fluctuating higher and the price declined towards the lower border of the formation first and then left it crossing the lower border.
Altcoins are trading close to the support area at 196 at the time of writing of this review. There are two scenarios here. In case of appearing any reversal candlestick signal, the price is able to jump off the support and start its way towards the resistance area at 204. However, bulls will have to cross the Ichimoku cloud in order to reach their local targets.
Otherwise, Monero will develop its downtrend. The first target, in this case, lies close to Friday’s lows.
Let’s take a look at the daily chart. The lower side of the Ichimoku cloud rejected the price. XMR/USD was trying to establish the uptrend during the weekend, but as we can see it now, bears are still in control in midterm and want to push the price even lower.
Check the full crypto analysis HERE

Monero fell below the descending trend lineMonero fell below the descending trend line confirming the downtrend. Monero price crossed the Ichimoku cloud during the American session and a couple of support line within the Asian session. XMR/USD is below the support line at 214.54 area. We think that Monero is going to test this level in the next couple of hours. The currency pair looks to start a correction at least.
There are two scenarios here. XMR price may return to 214.54 area, test it successfully and go higher. Bulls will have an opportunity to reach the next resistance level at 219.70 area. This may happen today. The next target for the buyers is the descending trend line in the case. However, to reach all those goals, bulls need a deep correction at least.
Bears scenario will be available in case of failure of the current resistance line test. XMR/USD is likely to fall further towards 204 area as there are no clear supports on the way (they may appear, however).
As for the daily chart, XMR/USD continues to fall towards the lower border of the Ichimoku cloud. The closest midterm support lies within the 204 area (coincides with the closest hourly short-term support line).
Monero price is far from the long-term descending trendline meaning bears have total control over the market.
Check the full crypto analysis HERE

Monero is still in limboMonero is still in limbo as bulls and bears are fighting for the descending trend line. XMR/USD went above the trend line during the American session and we have noted this in our latest brief review. However, bulls were unable to hold their positions as bears pushed the currency pair lower.
Monero price has recently tested the lower boundary of the Ichimoku cloud and formed a pin bar. The next candlestick crossed the descending trend line. Now, we are above this line and the Ichimoku cloud. Bulls have regained the initiative and are likely to develop their success in the nearest future.
Monero price is above the $229 resistance line area. The next resistance area is at $235. There is a secondary scenario here. Another possibility is for bears to take the initiative and drive XMR/USD lower. In this case, they have to cross the support line area at $229 and then to successfully test the descending trend line in order to push the price lower.
We are still in the middle of nowhere on the daily chart as XMR price is within the Ichimoku cloud and seems to avoid falling towards the lower boundary of the formation. XMR/USD is below the long-term descending trendline meaning bears are still in total control over the market.
Bulls are trying to regain initiative and there is a probability that XMR price will move towards the $252 resistance level area to test it.
Check the full crypto analysis HERE

XMR/USD reached a very important supportMonero still follows its morning scenario as the currency pair reached a very important support within 220 area. The support was established in April 2018 after the price skyrocketed from 200 to almost 230.
XMR/USD was inside the Ichimoku cloud today, but left the formation and accelerated its decline. The price broke out the previous support (228 area) and went downwards even further. There is a sort of a correction currently. The evident scenario is that Monero will try to return towards 228 area in order to test it. However, you need also to be prepared for further bears’ attacks. The price may fall below 200 in this case within several days.
Check the full crypto analysis HERE

Monero is still under the pressureMonero is still under the pressure as it fluctuates below the downside trend line. Midterm bears drive the currency pair even further downwards and their next target seems to be close to 175.00 area support line.
Monero shows no sign of a tendency reverse. Monero price has recently jumped off the downside trend line and is slightly going down.
Bulls are able to make a counter attack either now, when Monero price is still close to 250.00 area resistance line or close to the 175.00 support line area.
As for the Ichimoku indicator, Monero fluctuates within the cloud. Monero price rejected the upper side and is going downwards to test the lower line which is also not far from 175.00 level.
Monero price is close to the resistance on the hourly chart. Bears still have power as they do not allow bulls to make any further steps above 235.00. However, if we take a look at the whole picture, we can see a kind of reversed head and shoulders formation and if it is real, we are in the neckline area now. The next resistance area will be close to 242.00 level.
Monero enters the Ichimoku cloud but does it quietly, with no momentum. Short term traders should pay attention to what is going to happen in the nearest future. If Monero goes through the Ichimoku cloud, it may gain momentum and reach 242 area even today. As for the alternative scenario, Monero price is able to reverse towards the lower line of the Ichimoku cloud.
Check the full crypto analysis HERE

Monero, what are you doing?Hello everybody and welcome to my XMR analysis. If you are like me then you must be a big fan of Monero too, however, over the last 14 days XMR has been testing our patience after a failed attempt to break the USD 300 level. Today I'll share with you my thoughts and ideas that I have been working on and following for the last few weeks. If you like my analysis please give a 'thumbs-up' and/or follow me for more ideas in the future.
So lets dive into Monero. In the previous and fierce rally of a bit more than 2 weeks ago, XMR made a strong move towards USD 300 but failed to break this important resistance. Coming from USD 160, XMR almost doubled in value within 2 weeks. Unsurprisingly the bulls ran out of steam after 2 weeks and had to retrace.
To understand the whole situation we need to look back to the last few weeks and take a multi dimensional approach. In the daily chart below you can see that XMR is in an upward moving channel. Although XMR failed to breach USD 300k it has found strong support on the 200 day Exponantial-Moving-Average (EMA) with a wick finding support on the 50 EMA.
After the failed attempt to break the USD 300 level, XMR initially found support at the psychologically important level of USD 250 but later moved to mid 230 levels with a wick going all the way to USD 220. To understand what happened here we need to have a look to the XMR/BTC chart as well. In the 4-hour chart below we can see that in the previous Monero rally, XMR was very close to reaching a new All-Time-High (ATH). When XMR failed to breach USD 300 it retraced all the way back until the 200 EMA where it found a bit of support but which didn't sustain. After that it fell back to the 50 EMA where it found stronger support. As you can see, XMR has found strong support on the 50 EMA on this level for the last few months and is currently holding up pretty well again.
Although XMR is an altcoin with very distinct features compared to Bitcoin, it is currently very tied (as all altcoins) to the action going on with BTC. Last week we experienced a failed attempt from BTC to breach the important USD 10k level and this is holding the whole altcoin market in a grip. I believe that Bitcoin is currently preparing for another attempt to breach USD 10k and if it succeeds, XMR will likely profit from this as bulls will have the confidence to aim for the USD 300 mark again.
Going back to the XMR/USD chart again - on the 4 hour chart - we are also forming a descending wedge. Downside momentum is decreasing and a potential break-out increasing.
At the same time we are noticing that the Relative-Strength-Index (RSI) is turning bullish. The Commodity-Channel-Index (CCI) is at a healthy level and the Moving Average Convergence Divergence (MACD) is rolling over to become bullish again. These indicators are at a healthy level for a new rally since we do not want them to be over-bullish or over-bought now.
So did we found a bottom and where are we heading?
For now I think we either hit the bottom or are very close to it. XMRBTC and XMRUSD is currently finding strong support at the 200 and 50 EMA and sell volume is rather low. A new attempt to break USD 300 is in my opinion very likely so I expect XMR to at least touch USD 290 in the next 2 weeks.
At the same time we need to carefully watch any BTC action. If BTC fails to break USD 10k and starts to retrace to USD 8k levels (or lower?) I expect the whole altcoin market to take a significant pull back as well. XMR will then retrace as well where the first level of support would be USD 200 which has been a strong support level in the past.
This is not investment advice. Please do your own research before investing.

MONERO-USD WEEKLY CHART ON LOG-SCALEXMR/USD price has been steadily increasing for the last 2 years within an upward parallel channel (on logarithmic scale). It seems to have broken downward from the parallel channel recently, which is a clear warning sign that it has lost its momentum.

Monero investors are still in despairWe don’t have any good news for Monero investors today. The asset is experiencing difficulties with rising above the $260 level, which has turned into a resistance. Young bull calves (we can’t quite call them mature bulls) were able to push the price out of the descending channel for a short time, but could not hold the position.
But even if success favored the horned ones, the parallel expansion of this channel a little bit higher would certainly foil plans for further growth. Because of this, we predict that the asset will once again test the level of $230, where buyers should try their hardest to support the coin.
We don’t see any prospects of rapid growth for Monero - at best, the bulls can expect a test of the previous local high- $300.
The medium-term goal of $340, which we marked on the chart, can be kept in mind, but there are no reasons to count on its rapid achievement.
Check the full crypto analysis HERE

MONERO not far away from next turning pointMONERO has had a wonderful rally from about 160$ to actually 275$ (+70%). I think we´re now in the proximity of the next turning point.
A) the ascending trend channel is very steep - and such movements don´t last for long
B) EW shows we´re already in wave 5 (motive) - and wave 5 could be a shorter one
C) we´re not far away from the long desending trend line (red) - last time wave 5 was finished when it had reached this line - this could happen again
D) also there are several resistances (fib retracements)
I would be prepared that Monero changes the direction and would head to lower prices. So long as the sentiment in whole market is positive the correction wouldn´t be strong.
To give positive signals MONERO had to break the long descending trend line and should stay above.
Indicators:
RSI at the limit to overbought zone - but still some space left
MACD positive, trigger about signal and climbing.
Volume: losing strength - momentum is lacking
immediate stop:
If Monero plumps out of trend channel and breaks long fib retracement at 38.2% (235$)

Monero SinksThere is still no cause for joy in the Monero camp. It’s true that the support of $230-$235 has held, but trade volumes are not indicating any enthusiasm from buyers, and the asset itself continues to move in the lower register of the descending channel.
In the course of the day, we expect a repeat test of $235. If it does not hold (especially in case of negative developments on Bitcoin), the possibility of a decline to the range of $213-$220 will be higher.
In this case, correction will reach the 0.618 value of the Fibonacci grid, and if even at this level investors remain indifferent, we will have to reconsider the attractiveness of the asset for the medium term.
Nevertheless, the huge amount of capital that came into Monero on April 18 is still there, and will certainly be defended- there is no reason to panic at the moment.
Check the full review HERE

Monero in DistressDuring the last few days, things are not going well for Monero, and we note a decrease in investor interest. Having reached the mark of $300 in the middle of last week, the asset didn’t just enter a correction but also formed a descending channel.
At the time of writing, Monero is trading at $245, the 0.382 value of the Fibonacci retracement. Next comes the support zone $230-$235, where we expect a surge in buyer activity. To say with certainty that the price will not go down would be to forget the lessons that the market has repeatedly taught us. However, the probability of this is slight. Until Monero leaves the descending channel, it is too early to talk about further growth.
Check the full crypto review HERE

Monero - Breakout SetupThe Monero is going down last few hours and broke the key support level at 249. Now, this support acts as a resistance level. The price is backtesting the structure and price fall is expected. The more sellers are going to step in, which push the price down.

XMRUSD (D): Monero is one of kind, but ... ... a correction is currently possible. there is no question that monero will go its way. it has special feature as a currency. what is the current situation? monero has performed very well in the last days and weeks. the next big resistance line (around 300 USD) is in sight. here is the question of profit taking or waiting for the break of the resistance line. i am currently a bit more cautious at monero.
Let's see what happens. Happy trading. :-)

Monero is on The Way DownAfter reaching the goal of $300, Monero has already corrected to $265, which coincides with the 0.236 value of the Fibonacci grid, but we believe that this is far from being the limit. With a high degree of probability, this first stage of decline will be followed by a return to the lower register of the ascending channel and correction to at least $245.
At this level, we expect a surge in buyer activity, but pressure from the falling Bitcoin can erase all efforts to protect long-term positions. In that case, the pain limit for investors at the moment is located at the value of $230, which coincides with a powerful mirror level of support-resistance. A deeper correction will undo all previous successes of buyers and greatly damage the reputation of the asset.
Check the full crypto analysis HERE

WIRELINES FOR MONERO2 Ways for Monero the black one... bullish soon
the red one bullish later.
If you look the price pattern we see some similarities with may /september.
If you look the RSI it looks like september/november.
It is easy. if it hold the black dotted line ---bullish immediately
if it break the dotted line we have to wait some months.
Enjoy the rides
BIO


Monero Reaches Targets EasilyThe positive mood reigning on the market helped Monero reach the next growth target which we indicated earlier, $280, without too much effort. Meanwhile, the graph shows the formation of an expanded ascending channel, the width of which allows the asset to be safely corrected to $250.
After that, the next perspective target will be the range of $290-$300, where historical trading volumes were at the maximum, which is expressed by a strong mirror level of support - resistance.
At the moment, Monero is one of the most stable assets, the growth and fall of which can be predicted by methods of technical analysis with high accuracy. Our recommendations regarding the holding and increasing (in case of a dip in the price) of the asset remain in force.
Check the full crypto analysis HERE
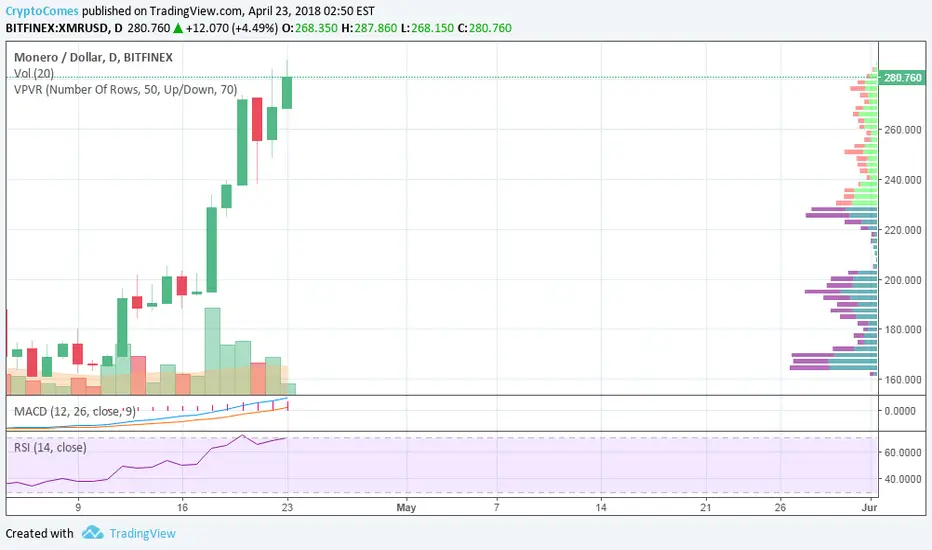

Volume Surges for MoneroYesterday's forecast for Monero was exactly on point, and the bulls’ target of $220 was executed with high accuracy. However, even we underestimated the amount of capital that flowed into the asset after leaving the long-term descending channel. Thanks to the strong support of investors, on Wednesday the price went up to $230, where it remains now.
On the way, Monero broke through the ascending channel, and now, to build its extension, it will take a bit more time and data.
The asset continues to look better than the market, the perspective goal is at $260, where the bulls will certainly meet with a rebuff.
It is quite likely that before continuing the climb, investors will be obliged to take a little break - the range $220 - $ 230 is perfectly suitable for this purpose.
Check the full crypto analysis on BTC and altcoins HERE

Monero large volume increase 4/17+4/18Large increase in volume of privacy coin XMR/Monero on the same day as the tax deadline in the U.S. and also the same day that the hyped privacy coin XVG/Verge announced their partnership with Pornhub. The price quickly decreased.
Short temporarily and Long soon after.
Who pays for porn in 2018?

Monero is Ready to Surprise InvestorsWhat the Litecoin investors still have to do, Monero fans are doing right now: the first thing that catches the eye on the chart is the lateral trade in the range of $190 - $205. Because of it, the price has formed a beautiful bullish flag, which is practically resting against the boundary of a long-term descending channel. Of all the possible scenarios of preparing for the break through a strong resistance, this is the most effective one.
Given the bulls’ success, $220 will become the target with a triple confirmation (dimensions of the figure, the mirror level, the Fibonacci grid).
Confident readers can try to trade from the break in the boundary of the channel, with a stop-loss order in case of a false break. As for the correction scenarios, the level of $190 is stll looking like a reliable support for buyers.
Check the full crypto analysis HERE
