MOVEUSDT — Descending Triangle Critical: Breakout or Breakdown?📊 Chart Analysis
The MOVE/USDT daily chart is currently forming a clear Descending Triangle pattern. This structure is defined by:
A downward sloping resistance trendline (yellow) that has been pressing the price lower since the beginning of the year.
A horizontal support zone (yellow box) around 0.105 – 0.125 USDT, acting as the last stronghold for buyers.
This pattern signals that the market is in a compression phase. Price has repeatedly failed to break above the descending trendline, while support has also been tested multiple times but still holds. This indicates we are entering a make-or-break moment for MOVE.
---
🔼 Bullish Scenario
If price manages to break above the descending trendline with a strong daily close and rising volume, this could be a potential reversal signal.
First confirmation level: Breakout above 0.1514.
Upside targets:
TP1: 0.1514 (+20%)
TP2: 0.1841 (+46%)
TP3: 0.2465 (+96%)
With sustained momentum, a mid-term target could extend to 0.4018 or higher.
The bullish case would be further supported by signs of bullish divergence on RSI or MACD.
---
🔽 Bearish Scenario
On the other hand, if price fails to hold the 0.105 – 0.125 support zone and closes daily below this area with increased volume, strong selling pressure could drive further downside.
Bearish targets:
0.087 (−31%)
0.075 (−40%)
0.050 (−60%)
A confirmed breakdown from a descending triangle within a downtrend often signals a strong continuation to the downside.
---
📌 Pattern & Implications
Descending Triangle is typically a bearish continuation pattern, though false breakouts to the upside are not uncommon in crypto markets.
The current support zone is the critical decision level that will determine the next major move.
Traders should wait for a confirmed breakout or breakdown before committing, in order to avoid bull traps or bear traps.
---
⚖️ Conclusion
MOVE/USDT is standing at a critical decision point.
Bullish bias if daily close above the trendline and 0.1514 with strong volume → upside potential to 0.1841 / 0.2465.
Bearish bias if daily close below 0.105 → downside targets at 0.087 / 0.075.
This is a make-or-break moment, and confirmation from price action and volume will be crucial before entering a position.
---
#MOVE #MOVEUSDT #Crypto #TechnicalAnalysis #DescendingTriangle #SupportResistance #Breakout #BearishScenario #BullishScenario #DYOR
Movesignals

MOVEUSDT Long-Term Downtrend Line – Breakout or Downside Ahead?📊 MOVE/USDT Chart Analysis (1D Timeframe)
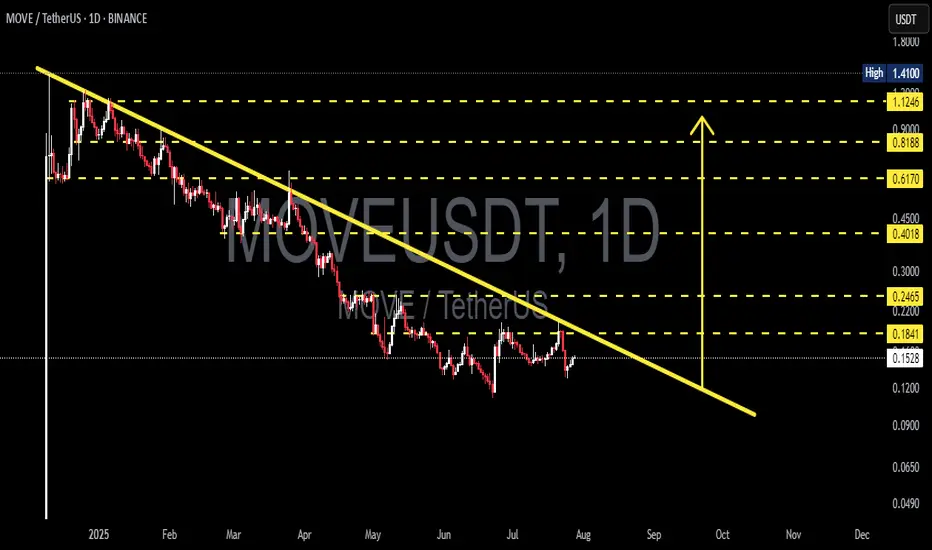
On the daily chart, MOVEUSDT has been locked in a strong downtrend since early 2025. The dominant descending trendline (yellow) clearly outlines the continuous selling pressure, with a series of lower highs and lower lows.
Price is currently trading just below this trendline and hasn’t confirmed a breakout yet. However, there are signs of accumulation in the lower zone, indicating a possible trend reversal if a breakout is confirmed.
---
📌 Identified Pattern
A descending triangle has formed in the medium term, though its bearish momentum seems to be weakening.
A potential double bottom pattern may be developing near the $0.1200–$0.1300 support area.
---
📈 Bullish Scenario
If the price manages to break above the descending trendline and close above the key resistance at $0.1841, we could see a bullish continuation toward:
Target 1: $0.2200
Target 2: $0.2465
Target 3: $0.4018
Further upside could aim for Fibonacci retracement levels like $0.6170, $0.8188, and potentially $1.1246 if volume confirms the breakout.
A strong bullish confirmation would come with high volume and a daily candle close above the trendline.
---
📉 Bearish Scenario
If the price gets rejected at the trendline again and breaks down below the $0.1200 support:
Next support levels to watch: $0.0900
Followed by $0.0650 and $0.0490 if bearish momentum increases.
A breakdown below these zones may signal a continuation of the long-term downtrend.
---
💡 Conclusion
MOVEUSDT is at a crucial decision point. A breakout from this long-standing downtrend could trigger a significant trend reversal, while another rejection might continue the bearish cycle. Watch for volume spikes and daily closes above the trendline to confirm the next move.
#MOVEUSDT #CryptoChart #TechnicalAnalysis #CryptoBreakout #AltcoinWatch #TradingStrategy #DescendingTrendline #FibonacciLevels #CryptoSupportResistance #BullishSetup #BearishSetup
MOVE (SPOT)BINANCE:MOVEUSDT
#MOVE/ USDT
Entry range(0.1530 - 0.1560)
SL 4H close below 0.1490
T1 0.17
T2 0.18
T3 0.20
T4 0.22
_______________________________________________________
Golden Advices.
********************
* collect the coin slowly in the entry range.
* Please calculate your losses before the entry.
* Do not enter any trade you find it not suitable for you.
* No FOMO - No Rush , it is a long journey.

MOVEUSDT 12HMOVE ~ 12H Analysis
#MOVE This trade is very high risk. Buy gradually after successfully penetrating this resistant line with a short -term target of at least 10%+.
