Structural Compression Phase🔎 Overview
This idea focuses on identifying potential bullish expansion after a multi-day price consolidation inside the EMA 100 High–Low Band.
The structure highlights range compression, swing-based trendline pressure, and rising volume during consolidation, which together can signal a market preparing for directional movement rather than random noise.
────────────────────────────
📘 Core Components
EMA 100 High–Low Band
• The EMA 100 High–Low Band represents fair value and balance.
• Price consolidating inside this band suggests indecision and energy buildup, not trend weakness.
Pivot High–Low Swings
• Pivot Highs and Pivot Lows are used to map internal market structure.
• Two swing-based trendlines are drawn:
• One connecting lower highs
• One connecting higher lows
This creates a structure squeeze within value.
────────────────────────────
🛠 Market Structure Concept
Consolidation & Compression
• Price has remained inside the EMA High–Low Band for multiple sessions.
• Swing highs are compressing downward while swing lows are compressing upward.
• This reflects decreasing volatility and controlled price action, often seen before expansion.
────────────────────────────
📐 Trendline Structure
• Upper trendline connects progressively lower swing highs.
• Lower trendline connects progressively higher swing lows.
• Both trendlines converge, indicating structural pressure.
This is not direction — it is preparation.
────────────────────────────
📊 Volume Behavior
• Volume is above average while price remains in consolidation.
• Rising participation without range expansion suggests absorption, not exhaustion.
• This behavior often precedes directional acceptance, not immediate rejection.
────────────────────────────
📈 Bullish Expansion Context (Structure-Based)
• A clean acceptance above the upper swing trendline
• Followed by price sustaining above recent structure highs
• While remaining supported outside the EMA High–Low Band
This sequence would indicate resolution of compression rather than a false breakout.
────────────────────────────
🧭 Validation, Devalidation & Projection Framework
Validation Line (Strength Confirmation)
• A candle close above the validation line confirms structural acceptance.
• This signals that the compression phase has resolved with strength, not noise.
Devalidation Line (Structure Failure)
• A candle close below the devalidation line invalidates the setup.
• This indicates failure of compression logic and negates the structural thesis.
Target Line (Maximum Structural Projection)
• Once validated, the target line represents the maximum expected structural expansion based on current compression range.
• This is a projection reference, not a prediction.
Devalidation as Protection
• After validation, the Devalidation level acts as a structure protection zone.
• A sustained close below this level signals loss of acceptance and invalidates continuation logic.
────────────────────────────
📝 Summary
• EMA 100 High–Low Band defines balance and value.
• Price consolidates inside the band for multiple sessions.
• Swing-based trendlines show structural compression.
• Volume expands during consolidation, indicating participation.
• Validation and devalidation lines define acceptance and failure zones.
• Target and revalidation levels provide structured projection and protection.
• The idea focuses on structure resolution, not prediction.
• Direction is assessed only after acceptance, not anticipation.
────────────────────────────
⚠️ Disclaimer
📘 For educational purposes only.
🙅 Not SEBI registered.
❌ Not a buy/sell recommendation.
🧠 Purely a learning resource.
📊 Not Financial Advice.
Movingavarage

UNH – Weekly / Daily Structure | Potential Wave 3 SetupThesis
UNH is working through a corrective phase and attempting to transition into a new impulsive structure, with a potential Wave 3 setup forming.
Context
- Daily timeframes
- Deep corrective move completed (ABC structure visible on higher timeframe)
- Price currently trading below the 200-day moving average
- Long-term trend remains intact on the weekly chart
What I see
- Price has stabilized above the recent lows
- A higher low is in place on the daily chart
- Price is approaching the 50-day moving average, acting as near-term resistance
- Structure suggests a basing phase rather than continuation lower
What matters now
- A clean break and hold above the 50-day MA (~$334) would improve short-term structure
- The key confirmation level remains the 200-day MA ($350 area)
- Until that level is reclaimed, both consolidation and continuation scenarios remain valid
Buy / Accumulation zone
- Current consolidation range above recent lows remains the area of interest
- Risk is defined against the recent base
Targets
- First major structural target sits at the 200-Week MA at $460 area
- If reclaimed 200-Day MA, the larger Wave 3 reference aligns with the 1.618 Fibonacci extension near the $540 area
- Dividend yield remains supportive (~2.6%)
Risk / Invalidation
- Loss of the recent higher low would weaken the reversal thesis and I will start the alternative Wave counting

BTC Macro Outlook (Regression, SMA)Long-term price analysis using confluence of Log regression bands, SMA's, and Fibonacci retracements.
Possible case for a test of the 400w SMA, based on % distance to previous all-time highs.

NAS100 – 30-Minute Timeframe Tradertilki AnalysisMy friends, greetings,
I have prepared a NAS100 analysis for you on the 30-minute timeframe.
My friends, if NAS100 reaches the positive levels between 25.001 and 24.951, I will open a buy position and target the 25.258 level.
My friends, I share these analyses thanks to each like I receive from you. Your likes increase my motivation and encourage me to support you in this way.🙏
Thank you to all my friends who support me with their likes.❤️

EURUSD BUY OPPORTUNITY SWING TRADERS 30min There is a clear trend break and retest on 30min timeframe. Waiting for price to retest the support level and hit off 10 20 EMA. Targeting 1.17100. 4hr timeframe EMA's are also on uptrend. Potentially big rr trade....

GLUE jumped 191% with 93% score on the indicator almost perfectHi guys,
A stock that jumped in the daily scan of the indicator and could be very interesting right now.
It received a score of 93 percent and therefore caught the eye like fire. My indicator is simply enthusiastic about it - it sees an almost perfect setup for momentum there.
It has a near-perfect stop and the third quarter 2025 reports were released this morning before the open. These reports can move the stock in either direction, so I recommend waiting to see the market's reaction and then perhaps considering an entry. I personally will not enter until I see that the market has digested the reports.
About the company:
Monte Rosa Therapeutics is a relatively small company from Boston that was founded only in 2019, but it is doing something really special. They have developed an innovative technology called Molecular Glue Degraders (MGD for short). It's basically a type of small drug that uses the body's natural mechanisms to break down proteins that cause disease instead of just blocking them.
Their secret engine is called QuEEN and uses artificial intelligence to identify proteins that can be broken down and design precision drugs. It's a technology that's considered revolutionary in the industry because it can treat diseases that no other drug has been able to treat.
The company is currently developing three main drugs in parallel. MRT-2359 to treat cancers driven by the MYC protein (including hard-to-treat prostate cancer), MRT-6160 for autoimmune and inflammatory diseases like lupus, and MRT-8102 for inflammatory diseases related to the NLRP3 mechanism. The first drug is already in advanced clinical stages with promising results, and the other two are in the early stages of human testing.
Institutional investors and large banks believe in this company. They have 10 analyst coverage and the majority of the average is BUY with an average target price of $13.50, which is another increase of almost 110 percent from the current price.
Massive Collaborations:
This is the interesting part. Last September, they announced a second collaboration with Novartis, one of the largest pharmaceutical companies in the world. In this agreement, Novartis paid them $120 million immediately in cash, and there is another potential of $5.7 billion if they meet all the milestones.
This is in addition to the first agreement they already had with Novartis in October 2024 for the drug MRT-6160, where they received $150 million upfront and up to an additional $2.1 billion in milestones. In total, there is a potential of almost $8 billion from the two agreements with Novartis alone.
They also have a collaboration with Roche to research and develop additional drugs in the field of cancer and neurological diseases. This shows that their technology is of interest to the big players in the industry.
Latest news:
Last week, the company presented strong preclinical data on MRT-6160 at the ACR Convergence 2025 conference, showing that the drug degrades more than 90 percent of the VAV1 protein and significantly inhibits the function of T and B cells. This is important because VAV1 is involved in many autoimmune diseases.
A few weeks ago, they announced that they would be attending four investor conferences in November-December 2025, including at Guggenheim Healthcare in Boston, TD Cowen Immunology Summit, Jefferies Global Healthcare in London, and Piper Sandler in New York. This means that they want to promote their story to big investors.
In March 2025, they presented exciting results from the clinical study of MRT-2359 in patients with castration-resistant prostate cancer (CRPC). Of the three patients treated, one achieved a confirmed partial response (PR) and two achieved stable disease (SD). Interestingly, all three patients had mutations that link resistance to standard treatments. In one of them, PSA levels dropped by 90 percent and the tumor shrank by 57 percent. As a result, they plan to expand the study to 20-30 more patients.
In July 2025, they began dosing the first people in a phase 1 study of MRT-8102 (the anti-inflammatory drug) with results expected in the first half of 2026.
In their second-quarter 2025 financial statements released in August, they reported revenue from collaborations of $23.2 million, a huge jump from $4.7 million in the same quarter last year. Their net loss fell from $30.3 million to $12.3 million. They have $295.5 million in cash that should fund operations through 2028.
In the fourth quarter of 2024 (reported in March 2025) they reported a colossal $60.6 million in revenue from collaborations and $38.9 million in R&D expenses.
Technical View:
Technically, the stock was at an ATH of around $44 in September 2021 and then crashed to $3.50 in August 2025. Since then, it has been on a strong rise and has already climbed to $13.22, a 191% increase in three months.
It is now at $12.31 in a three-day consolidation in the range of 11.50-13.22. The price is above the EMA10 at 11.9 and above the SMA200 at 5.88. There is a Perfect Order of all moving averages here and they are rising at a slope of 24.34 percent - this is a Strong Uptrend.
The average volume is 1.13 million shares per day and the ADR (average daily volatility) is 7.61 percent. The RSI is at 68.3 which is still normal and not overbought. The performance ratio compared to the S&P 500 is 181.93 percent - the stock is simply driving the market crazy.
In the last 10 days there have been 6 Higher Highs and 6 Higher Lows, this is a classic and clean uptrend.
There are currently no distribution signs or warnings on the chart. This is a Setup looking Ready for a breakout.
Weekly Trend:
Here I have one comment - in the weekly view the trend is still Neutral. This means that although the stock has made a strong increase in recent months, it has not yet clearly broken above significant resistance levels on the week. This should be taken into account.
*Sentiment and Social Networks:
I searched StockTweets and Reddit and saw that there are discussions, but they are not super active. This is not a stock that is talked about a lot on the networks or social media.
The main investors here are institutional rather than retail traders. The sentiment on StockTweets seems neutral to slightly positive but there is not a lot of activity there.
The analysts and experts are actually very positive. There are 9 companies with an Outperform or Buy recommendation, an average of 1.8 (scale of 1 to 5).
The risks:
This is still a clinical-stage biotech company without sales of real drugs. All the drugs are still in development and they have to go through the regulatory processes. If one of the clinical trials fails, the stock could collapse. Their cash is only supposed to last until 2028 and if they don't get more money from Novartis or other investors, they will have to raise capital.
The biotech sector is one of the most volatile and risky sectors. Most companies at this stage fail. The stock's beta is 1.53, which means it is 50 percent more volatile than the market.
It should be noted that the M-Score (financial manipulation indicator) has a score of 23.4 which could indicate a warning, but this is common in biotech companies at this stage because there is a lot of fluctuation in revenue from collaborations.
In conclusion:
I'll wait for the report.
My method is always to wait for large volume in the pre-market, which is at least 1.5 times and preferably the average volume, and then use my ORB indicator to get additional confirmation in the first 5 minutes of the open; but since they have reports coming out and I still don't know if it'll be far enough to cause a commotion in the pre market I'll wait.
This is a stock that my indicator really likes technically - it has a Perfect Order, strong momentum, and a clean setup. Fundamentally it has innovative technology, collaborations with giant pharmaceutical companies, promising clinical data, and good cash for several years.
But this is biotech with all the risks that come with that. The reports came out this morning and the current price of $12.31 already embodies some of the expectations. I personally wouldn't enter now before seeing the market's reaction to the reports and maybe wait for a small pullback to the 11-11.50 area where there is support. If it breaks 13.48 on high volume then you could consider entering with a very short stop loss below 11.84.
Definitely a stock to watch, but with great caution.
Just before you jump in:
Listen, I'm not an investment advisor and I don't want to be one. What I've written here is simply my analysis with the indicator I developed, and it could be completely wrong.
Biotechnology is not a game - it's one of the riskiest sectors there is. Ninety percent of clinical-stage companies fail and the money goes down the drain. You could lose everything.
I **do** not own this stock now and **will** not enter before I see what happens with the reports that came out today . I don't know you, I don't know the state of your portfolio, and I don't know how much risk you can take.
Before you put money in - do your homework, talk to someone professional who knows you, and only then decide. And don't invest money that you need for your electric bill.
Good luck to all of us, and may the goddesses shower us with an abundance of money.

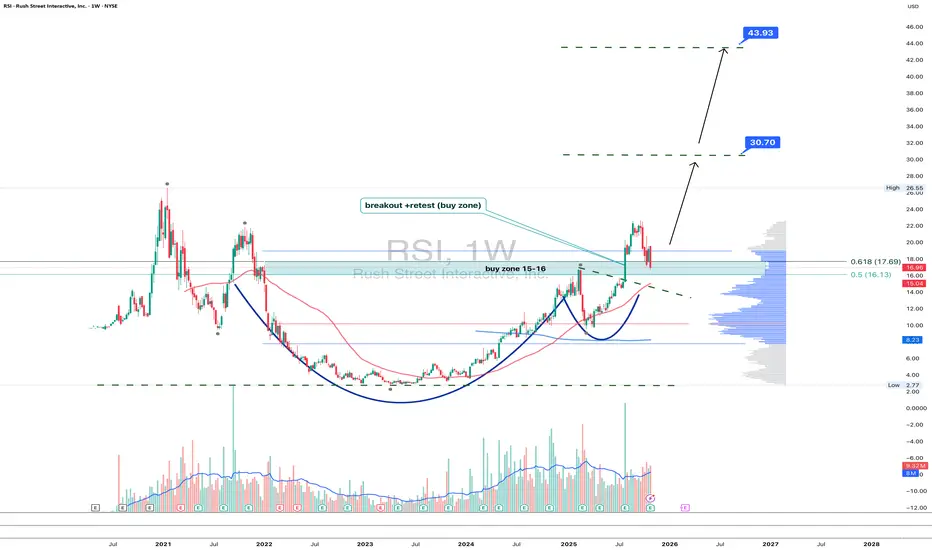
RSI 1W - gambling or smart retest?Rush Street Interactive (RSI) just confirmed a breakout above the 15–16 zone with a textbook retest - a classic bullish setup. The weekly chart shows a clean “cup and handle” structure backed by rising volume. Current pullback is forming right inside the buy zone, suggesting potential continuation.
Fibonacci extensions highlight 30.7 and 43.9 as key upside targets. As long as price holds above 15.5–16.0, the bullish bias stays intact. A breakout above 18.0 would confirm the next leg higher.
Fundamentally , RSI benefits from ongoing online gambling legalization across the US and improving profitability in core states, which could attract institutional inflows.
In the gambling world, luck rarely repeats - but this chart looks like the house might finally lose.
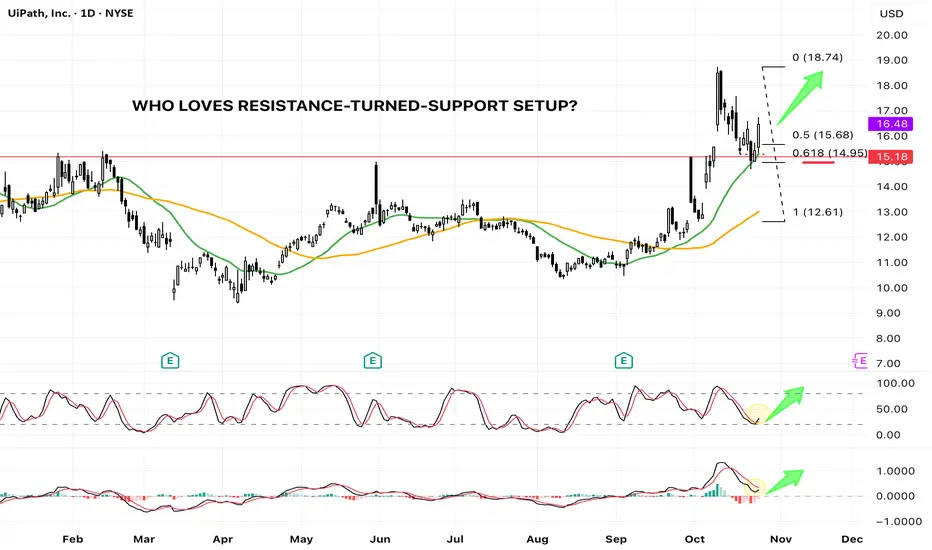
PATH - Textbook R/S Flip at Key Fib & MA Support (Bullish Setup)UiPath ( NYSE:PATH ) spent the majority of 2025 range-bound, oscillating between the $10 and $15 marks. This consolidation phase ended dramatically in early October, when the price decisively breached the long-standing 2025 horizontal resistance at approximately $15.
The breakout led to a swift rally, tagging a new year-to-date high of $18.74 . Following this strong move, the stock began a healthy retracement, pulling back to test the very level that had previously acted as resistance—the classic Resistance-Turned-Support (R/S Flip) setup.
The Confluence of Support
This current pullback is resting on a powerful confluence of technical supports, significantly increasing the probability of a bullish continuation:
1. Horizontal Support: The previous major resistance line (around $15) now acts as a crucial horizontal support.
2. Moving Average Support: The price is testing the 20-day Simple Moving Average (SMA 20, Green Line) . Importantly, this is the first time the price has pulled back to the SMA 20 since the bullish SMA 20/SMA 50 Golden Cross , signaling a strong trend retest.
3. Fibonacci Golden Pocket: The retracement has landed perfectly into the 0.618 Fibonacci Retracement level (from the $12.61 swing low to the $18.74 swing high), a statistically significant reversal zone often called the "Golden Ratio."
Momentum Indicators Confirm Bullish Bias
Beyond the price action, our auxiliary indicators are flashing constructive signals:
* Stochastic: The Stochastic oscillator is reversing from the oversold territory and is showing a clear bullish cross , indicating waning selling pressure and the start of a new upward momentum cycle.
* MACD: The Moving Average Convergence Divergence (MACD) indicator is attempting a bullish cross above the zero line , a powerful sign of increasing positive momentum.
Conclusion
The confluence of price action and indicator signals presents a high-probability bullish setup. The market is currently rewarding the successful test of the R/S flip at the 0.618 Fib and SMA 20 support.
While this setup suggests a strong likelihood for the next leg higher, traders must remember that trading involves probabilities. A clearly defined stop-loss is essential to manage risk should the market invalidate this robust support zone.
XAU/USD Intraday Plan | Support & Resistance to WatchGold remains under downside pressure after failing to hold above the 4151 resistance yesterday, with price now trading around 4104. The metal continues to trade below both the MA50 and MA200, confirming that short-term momentum remains bearish within a broader corrective phase.
If buyers can reclaim 4117 and 4151, a corrective bounce toward 4192 and 4227 may follow. However, failure to defend 4075 could trigger another wave of selling toward 4020, and potentially deeper into the 3984-3953 zone, where fresh demand could start building up.
📌 Key levels to watch:
Resistance:
4117
4151
4192
4227
Support:
4075
4044
4020
3984
🔎 Fundamental focus:
Gold continues to trade under macro uncertainty as the U.S. government shutdown drags on, delaying major data releases and weighing on investor confidence. The lack of economic transparency has led to erratic price swings, while persistent U.S.–China trade tensions and weaker manufacturing sentiment add further risk aversion.

Bitcoin STRONG Weekly Bounce - What's Next?Hello BTC Watchers 📈
📢 Bitcoin was trading right on top of a crucial support zone. But the price has successfully bounced in the weekly and made a strong comeback from the support zone.
The weekly moving averages
The daily moving averages
This is telling for a number of reasons. In the weekly we see a strong bounce above the moving averages as well as in the daily, and in the daily we had just bounced back from a correction which took us to the 100d MA (which is the general zone for a correction, or at least a wick towards that area. This indicate that in the short and longer term, the chart is looking up and bulls are in control.
What are you thoughts, new ATH or just a fakeout?

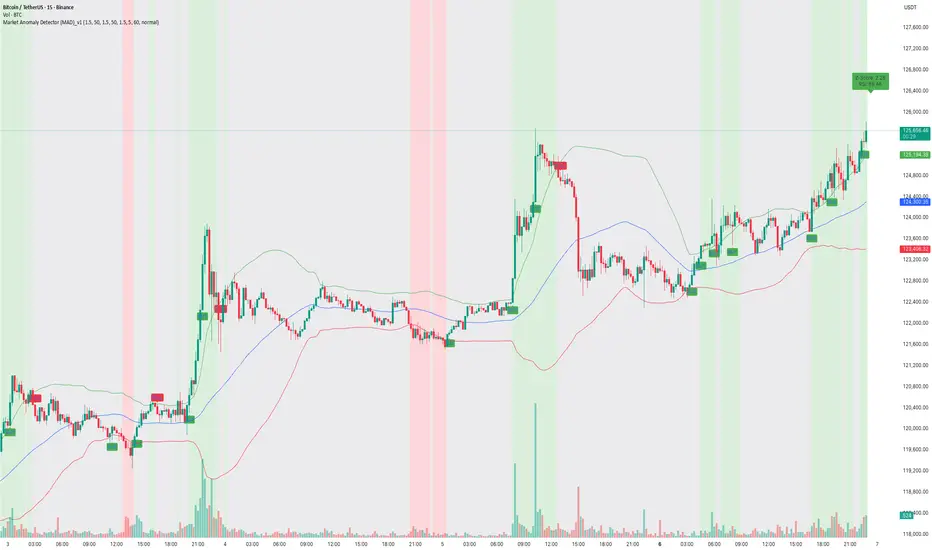
How to capture trend using MAD Indicator!📝 Description:
Watch how the Market Anomaly Detector (MAD) precisely captured the start of the Bitcoin breakout on the 15-minute chart — with no lag, early confirmation, and clear signals.
This BTC/USDT rally was flagged using:
• ✅ Z-Score Spike + RSI confirmation
• ✅ Volume Thrust + Trend Strength Filter
• ✅ Dynamic Zone Coloring for Visual Clarity
• ✅ Trade Cooldown Filter to avoid signal noise
💡 The green background highlights anomaly confirmation zones, while red indicates potential fakeouts or traps.
In this rally:
• The MAD indicator identified the compression breakout
• Maintained bullish zone with no false exit
• Generated a clean trend-following environment using adaptive logic.
🔍 Why MAD Works:
The MAD Indicator isn’t just about spotting anomalies — it adapts based on:
• Market volatility and relative volume
• Internal momentum using z-score logic
• Confirmation from RSI & EMAs
• A cooldown filter to prevent overtrading in choppy zones
📈 Perfect for scalpers, intraday traders, and short-term swing setups on crypto and stocks.
BULL 4H - Bulls are back in town?On the 4H chart, the setup looks solid: a falling wedge breakout with both MA50 and MA200 left below the price. Buyers stepped in with volume, confirming interest in the move. The first target sits around $18.35, and if momentum continues, the next checkpoints are $22 and $27.6.
From a fundamental angle, Webull keeps expanding its client base and strengthening its position in the competitive brokerage market. With retail trading demand still alive, recovery scenarios for the stock look plausible.
The tactical play is simple: as long as the price stays above the moving averages, bulls are in control. Still, watch for pullbacks - markets love to test support after breakouts.
And yes, the ticker “BULL” practically screams the trend. Just make sure you don’t treat it like a real bull - those don’t care about targets.

War is a Racket | DFEN | Long at $28.00The war machine keeps turning. Profits will reign. Direxion Aerospace and Defense 3x AMEX:DFEN never fully recovered from pandemic lows, but world peace is (unfortunately) far from reach. The uptrend in the chart has commenced. Personal entry point at $28.00.
Target #1 = $37.00
Target #2 = $50.00
Target #3 = $64.00

How to Use Moving Averages in TradingViewMaster moving averages using TradingView's charting tools in this comprehensive tutorial from Optimus Futures.
Moving averages are among the most versatile technical analysis tools available, helping traders analyze trends, identify overbought/oversold conditions, and create tradeable support and resistance levels.
What You'll Learn:
Understanding moving averages: lagging indicators with multiple applications
Simple moving average basics: calculating price averages over set periods
Key configuration choices: lookback periods, price inputs, and timeframes
How to select optimal lookback periods (like 200-day) for different trading styles
Using different price inputs: close, open, high, or low prices
Applying moving averages across all timeframes from daily to 5-minute charts
Analyzing price relative to moving averages for trend identification
Using 50-day and 200-day moving averages for trend analysis on E-Mini S&P 500
Mean reversion trading: how price tends to return to moving averages
Trend direction analysis using moving average slopes
Famous crossover signals: "Death Cross" and "Golden Cross" explained
Trading moving averages as dynamic support and resistance levels
Advanced moving average types: weighted and exponential moving averages
Applying moving averages to other indicators like MACD and Stochastics
Balancing sensitivity vs. noise when choosing periods
This tutorial may benefit futures traders, swing traders, and technical analysts who want to incorporate moving averages into their trading strategies.
The concepts covered could help you identify trend direction, potential reversal points, and dynamic trading levels across multiple timeframes.
Learn more about futures trading with TradingView:
optimusfutures.com
Disclaimer:
There is a substantial risk of loss in futures trading. Past performance is not indicative of future results. Please trade only with risk capital. We are not responsible for any third-party links, comments, or content shared on TradingView. Any opinions, links, or messages posted by users on TradingView do not represent our views or recommendations. Please exercise your own judgment and due diligence when engaging with any external content or user commentary.
This video represents the opinion of Optimus Futures and is intended for educational purposes only. Chart interpretations are presented solely to illustrate objective technical concepts and should not be viewed as predictive of future market behavior. In our opinion, charts are analytical tools—not forecasting

A Shining Year for Gold: Geopolitical Risks and Economic DynamicThe year 2024 may be a bright year for gold, but it coincides with a period of increasing geopolitical risks. Global political and economic uncertainties, while unsettling investors, may boost demand for safe-haven assets such as gold.
Another notable feature of this year is the decline in inflation and interest rates. It is expected that inflation will be kept under control, and central banks will opt for interest rate cuts. The -0.75% interest rate reduction can be considered as part of efforts for economic recovery.
Gold has traditionally been a sought-after investment in environments characterized by low inflation and interest rates. Therefore, the anticipated interest rate cut in 2024 may support gold prices. However, the persistent presence of geopolitical risks remains another crucial factor influencing the value of gold.
Investors will carefully monitor the performance of gold in 2024, taking into account both geopolitical developments and economic indicators in this complex and dynamic environment. In the face of potential risks, a diversified investment strategy may provide a more secure position.
-------------------
When I look at the gold mining index, I see a very positive increase.
-------------------
The graph of gold in 12-6-3 month time frames gives very positive clues that the price will rise.
------------------
My Goals for 2024
- 2200
- 2500
- 2700

EURGBP SELL NOW 5 MIN TIMEFRAME4HR 10 20 ema bearish, on 30 min it's hitting off ema. Targeting imbalance (shown in black line). Impulse correction continuation trading.

CARR – Bullish Breakout Toward Gap and ATHCarrier Global NYSE:CARR has closed above a key resistance zone near $76.50–$77.00 , indicating a possible breakout setup in progress. This move comes after a Golden Cross , where the 50 SMA crossed above the 200 SMA — a long-term bullish signal.
🔍 Technical Highlights:
✅ Golden Cross: Bullish momentum building.
✅ Breakout level: Price broke above horizontal resistance zone.
🔄 Next step: Wait for a potential retest of the breakout zone.
🔊 High volume on the breakout and retest would increase the strength and reliability of the setup.
🎯 Target Levels:
First Target (TP1): ~$80.00 — near the top of the existing gap.
Second Target (TP2): ~$83.32 — the current All-Time High (ATH).
🛡 Trade Plan:
Entry idea: After a clean retest of the breakout level with supportive volume.
Stop-loss: Below the retest zone or under 50 SMA (~$72-74 area).
Invalidation: If price falls back below resistance on high volume.
Conclusion:
CARR shows a strong breakout setup after a Golden Cross. A confirmed retest with volume could open the door toward the gap fill and new all-time highs.
DYOR – This is not financial advice.

Bitcoin Probabilistic Analysis in the 4-Hour TimeframeIf Jerome Powell lowers interest rates today, we will likely see this trend.
Based on MAKER buy/sell signals and the High/Low of the EMA 200 indicator.

Inverse H&S Breakout! EURGBP Eyes Resistance Zone Amid Eurozone EURGBP ( OANDA:EURGBP ) is moving between two Support zone(0.83870 GBP-0.83500 GBP) and Resistance zone(0.8511 GBP-0.8470 GBP) .
In terms of Classic Technical Analysis , EURGBP has managed to break the Neckline of the Inverse Head and Shoulders Pattern .
I expect EURGBP to rise to at least 0.84911 GBP and attack the Resistance zone(0.8511 GBP- 0.8470 GBP) .
-----------------------------------------------------------
EURGBP Fundamental Analysis:
1. Eurozone (EUR) Overview :
The Eurozone economy has shown moderate recovery signs after pandemic disruptions.
Inflation remains a concern, but the European Central Bank (ECB) is expected to maintain or even tighten monetary policy gradually to combat inflation.
Economic data such as GDP growth and industrial production are mixed but generally indicate slow growth.
Political stability in the Eurozone is relatively steady compared to the UK.
The ECB’s forward guidance leans towards cautious optimism, supporting EUR strength over time.
2. United Kingdom (GBP) Overview :
The UK economy faces several challenges, including slower growth prospects compared to the Eurozone.
Inflation has been high but the Bank of England (BoE) has been raising interest rates aggressively to control it.
Political uncertainties related to Brexit aftermath, trade deals, and fiscal policies have created some volatility.
Consumer confidence and retail sales have shown signs of weakness in recent months.
Overall, the BoE’s hawkish stance is strong, but economic fundamentals are less robust compared to the Eurozone.
3. Comparative Factors Favoring EUR Long :
The Eurozone's relatively better economic stability and growth prospects support EUR strength.
UK economic challenges and political uncertainties weaken GBP.
ECB’s more gradual tightening approach may prevent shocks, making EUR attractive.
Brexit-related trade issues continue to pose risks for GBP.
4. Risks to Consider :
Unexpected ECB dovish moves could weaken EUR.
Positive UK economic surprises or faster-than-expected BoE tightening might strengthen GBP.
External shocks like geopolitical tensions can affect risk sentiment, impacting both currencies.
-----------------------------------------------------------
Note: Stop Loss(SL)= 0.84221 GBP
Euro/British Pound Analyze (EURGBP), 4-hour time frame.
Be sure to follow the updated ideas.
Do not forget to put a Stop loss for your positions (For every position you want to open).
Please follow your strategy; this is just my idea, and I will gladly see your ideas in this post.
Please do not forget the ✅' like '✅ button 🙏😊 & Share it with your friends; thanks, and Trade safe.

$ETH Pressing Resistance – A Break Above Could Fly!CRYPTOCAP:ETH Update
Ethereum is looking strong right now.
The price is pushing against a key resistance zone near $2,725 and forming higher lows showing pressure is building for a breakout.
If it breaks above this zone clearly, ETH could rally toward $4,000 (that’s a 55% upside).
Support to watch on the downside is around $2,465 if price pulls back.
Keep an eye on ETH, this breakout could be big.
DYOR, NFA
#ETH #Ethereum

Bitcoin MA 50 crosses 100If history repeats, this could be even bigger gains soon ahead. The blue MA 50 just crossed the orange MA 100 which happened in Oct '24 as well as Oct '23 -- this time happening so soon could defy historical pattern, but with a possible Fed interest rate cut in the works, this could be huge.
After the recent Fed announcement that there would be no interest rate cuts at this time, the reason given was that the market was holding steady, though a recession was not entirely ruled out. If a recession starts to rear its ugly head before June 17th Fed meeting, they may change their outlook and enact interest rate cuts to ensure the economy can continue unscathed. Since Trump has walked back tariffs on China and is still working with the rest of the world to lower tariffs, the interest rates may not be cut in June.
What does this mean for Bitcoin?
A recession is still on the horizon, even without rate cuts and with lowered tariffs. The damage has already been done by tariffs, enough so that reports of impending empty shelves soon to hit stores this month is still a concern. People flock to other investment strategies when the market is so uncertain, hence Gold and Bitcoin getting their boosts recently.
It's my opinion that Bitcoin will continue to grow in price as investors scramble to keep their portfolios on an uptrend. The MA 50 and MA 100 crossing is a great signal and gives me confidence in a continuing uptrend.

PEPE | BULLSH | ALT can +150%PEPE seems to have bottomed out after flashing bullish signs on the chart.
Once we close ABOVE the 50 day moving averages (green line) in the weekly timeframe, that's when we'll know the bullish action is full steam:
Make sure you don't miss the update on BTC here:
______________________
BINANCE:PEPEUSDT

Copper | $6 ProjectionLike mentioned in my last copper post price has been holding up very well and is heading to $6.
Similar ABC fractal pattern to what we saw in '08 is still valid for this current price structure as well.
