MRVL Hidden Trend: Navigating the Silent DeclineMRVL Bear Flag Pattern
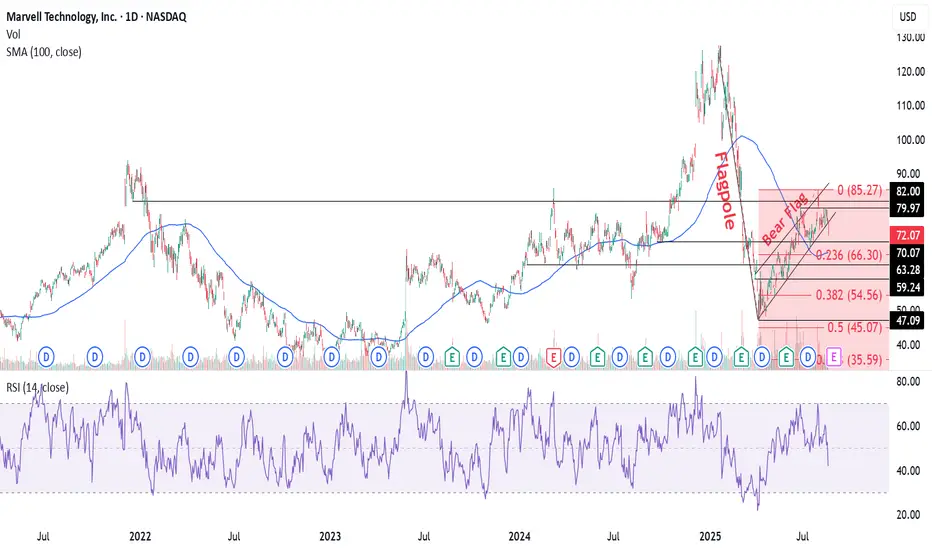
The MRVL chart indicates a bear flag formation, suggesting a continuation of the downtrend from its all-time high of $127.48 in January 2025. After hitting a low of $47.09 in April 2025, the stock consolidated between $47-$85. The recent breach below the sideways channel reflects the bear flag's flagpole, echoing the preceding downward trend.
Technical Indicators
The stock trades below its 50 DMA ($74.28) and 200 DMA ($83.13), reinforcing bearish sentiment. The daily RSI at 42 further underscores weakening momentum.
Trading Strategy
• Entry: $72-$70
• 1st Target : 100 DMA at $66.84, aligning with the 0.236 Fibonacci extension level at $66.30
• Next Targets : $63.28, $59.24, and $54.56
• Stop Loss : $80
Potential Downside
Should bearishness persist, the stock may revisit its 52-week low of $47.09, marking a significant support level.
Mrvlshort
Marvell Technology, Inc. (MRVL) Dips 16% On Earnings ReportMarvell Technology, Inc. ( NASDAQ:MRVL ) faced a sharp 16% decline in premarket trading on Thursday following the release of its fiscal fourth-quarter earnings report. While the semiconductor giant exceeded Wall Street’s expectations on both revenue and earnings per share (EPS), investor sentiment soured due to an uninspiring outlook.
Strong Growth, Weak Guidance
Despite the stock's decline, Marvell delivered solid earnings results for Q4:
- Revenue: $1.82 billion (+27% YoY), surpassing analyst consensus.
- Adjusted EPS: $0.60 per share, up from $0.46 a year ago.
- Data Center Segment: Revenue surged 78% YoY to $1.37 billion, reflecting strong AI infrastructure demand.
However, the market’s reaction was driven by Marvell’s fiscal Q1 guidance, which projected:
- Revenue of $1.875 billion, within analysts' expectations but lacking significant upside.
- Adjusted EPS forecast of $0.56 - $0.66, failing to excite investors anticipating a stronger AI-driven catalyst.
Technical Analysis
From a technical perspective, NASDAQ:MRVL now trades below key moving averages, reinforcing a bearish short-term trend. The stock’s RSI (Relative Strength Index) currently sits at 38, signaling weakness but not yet oversold territory, suggesting sellers may still have control.
