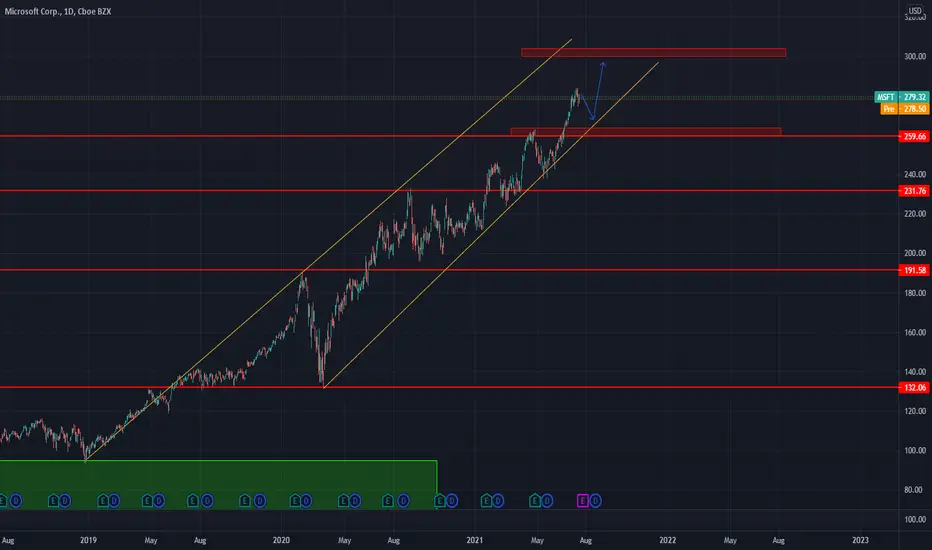
MSFT to Reach 300, maybe 320! Hello!
Why buy if is in thevtop?
The price break, test and confirm the top point and the upper line of the trend line!
Normally the price should move 100% of the movement before the break of the trend -> Explanation: The impulse start from 240 and break at 280 (40$).... TP is 100% of the impulse (40$) from 280 to 320$.
But first let's go to the psychological level (300) and after to 320.
Enjoy!
Msftlong

MICROSOFT BreakoutAn asset I have been watching for over a month now has finally flashed some signals I have been waiting for as it has done something very major that not many will realize until weeks from now and that is that it has broken bullish out of a huge ascending channel pattern. This pattern has kept the price consolidating inside of it since September of last year and appears to be in the process of confirming this on the weekly time frame by bouncing nicely off of $283.43. This is very important because this price corresponds with the .786 fibonacci level, a level regarded as a major pivot spot for swings. Often known to be reversal areas, they can equally be a springboard for higher prices when support is found on this level. And that is exactly what appears to be taking place as we speak.
I have been in a long at $290 with orders waiting around $283 and sub $283 as well.
Potential target area is $295 as a new all time high in the near future, followed by an additional 5% move to $311.

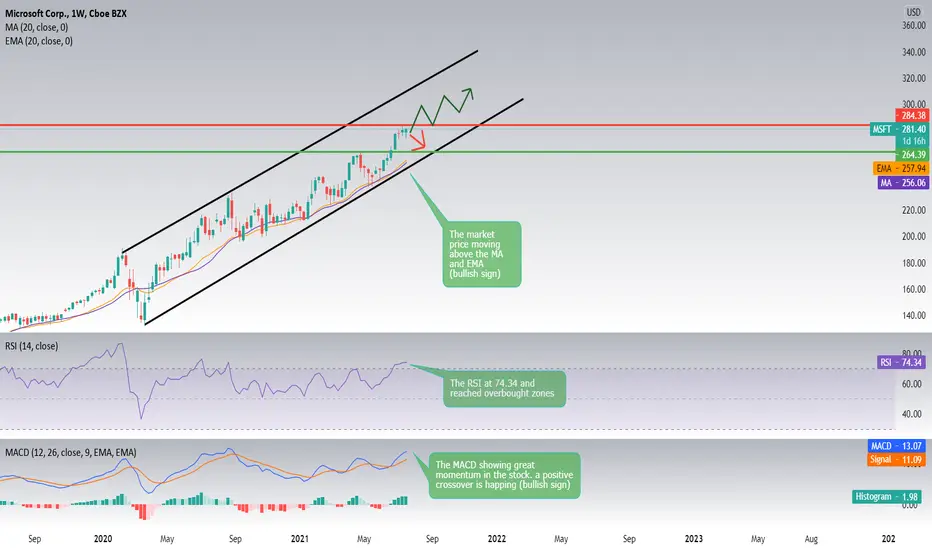
Microsoft weekly analysis (MSFT)Hello everyone , as we all know the market action discounts everything :)
The MSFT seems to continue its bullish movement and the stock price seems to be trading in an upward channel as we are getting higher highs and higher lows, MSFT is currently trading near its 52 week high, which is a good sign. The S&P500 Index is also trading near new highs, which makes the performance in line with the market.
The average volume is 23872600. This is a good sign as it is always nice to have a liquid stock.
The long and short term trends are both positive. This is looking good! We could be seeing the price reaching a new high soon and even maybe hitting the ranges if 290.
using different indicators to understand the trend where :
1_The stock price at 281.40 trending above the MA and the EMA. MA at 256.06 and EMA at 257.94 (bullish sign)
2_The RSI is at 74.34 and reached overbought zones showing great strength in the market with no divergences between the market and the indicator. (bullish sign)
3_The MACD showing great momentum in the stock. a positive crossover is happing (bullish sign)
Support & Resistance points :
support Resistance
1_ 276.86 1_284.38
2_ 272.96 2_288.00
3_ 269.34 3_291.90
Fundamental point of view :
MSFT's return on assets of 18.13% is amongst the best returns of the industry. MSFT outperforms 95% of its industry peers. The industry average return on assets is -4.03%.
The stock has a profit margin of 35.02%. This is amongst the best returns in the industry. The industry average is -8.63%. MSFT outperforms 95% of its industry peers.
Microsoft said Wednesday it’s acquiring CloudKnox, a start-up whose software helps companies reduce the amount of access they provide to their cloud resources. Terms of the deal weren’t disclosed.
The move represents another step Microsoft is taking to expand its security business, in addition to working to keep Windows and its other products secure.
Over the past 5 years, MSFT shows a quite strong growth in Earnings Per Share. The EPS has been growing by 18.13% on average per year. And the stock has a Current Ratio of 2.29. This indicates that MSFT is financially healthy and has no problem in meeting its short term obligations.
_____________________________________________Make sure to Follow and Like for more content_____________________________________________
This is my personal opinion done with technical analysis of the market price and research online from fundamental analysts for The Fundamental point of view , not financial advice.
If you have any questions please ask and have a great day !!
Thank you for reading.
MSFT - MicrosoftBullish Momentum.
Invest in what you like.
I don't see any bearish signs.
- Share your opinion in the comments below and support the idea.
Thank you for the support.
msft update microsoft still broke the highest but it's time to down , because the market it's saturation of buying
sell the market

MSFT: Consolidation.A breakout of the resistance level around 233 may lead to an increase in the price to the 269 area.

MICROSOFT records the highest value since inception New support and resistance , probability to correction but the trend remains up

$MSFT Going for that gapMSFT printed today an inside day and has cooled off after a strong bounce since Friday. I am eyeing the top and bottom gaps as interesting levels, although I believe we will continue swinging towards that 1.618 fib level after the previous flag. Indicators are taking a breather, but if CPI numbers are good and TNX stays low, we could see a stronger tech rally now that many stocks, like MSFT, are decently positioned to continue this trend.


$MSFT Microsoft Weekly Chart. looks good. Price target $275Weekly Chart. looks good.
Price target $275
Stop Channel break.


Microsoft Long PositionThis is NOT financial advice
Merely utilizing Technical analysis for opportunities in the market .
So following the news with Bill and Melinda gates divorcing we see a clear SELL THE NEWS tactic in order to sell at the top and buy the dips approaching a key Point of Support .
The daily Timeframe shows that although price is dropping it is still on an uptrend overall. Which means we are going LONG
Microsoft is on track to reverse off of the 50% retracement off of our Fibonacci extension with 2 confident positions for a LONG TERM HOLD. This is Looking like a steal ,Family.

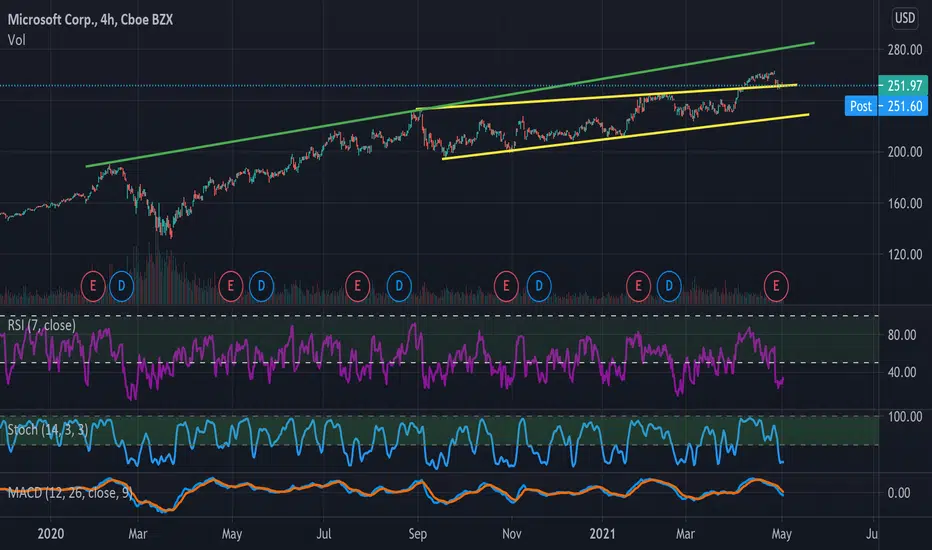
MSFT - 10.43% Profit Potential - Bullish PennantBullish Pennant formed after a modest 9-month rally.
Great risk-reward ratio and target set at a potential formation of a 1-year resistance line.
- Target Entry $252.04
- Target Stop Loss $246.36
- Target Exit 279.40
About me
- Note that I tend to adjust stop losses in order to secure profits early and preserve capital. This means that the target price is going to be achieved as long as there are no strong pullbacks that trigger my new adjusted stop loss
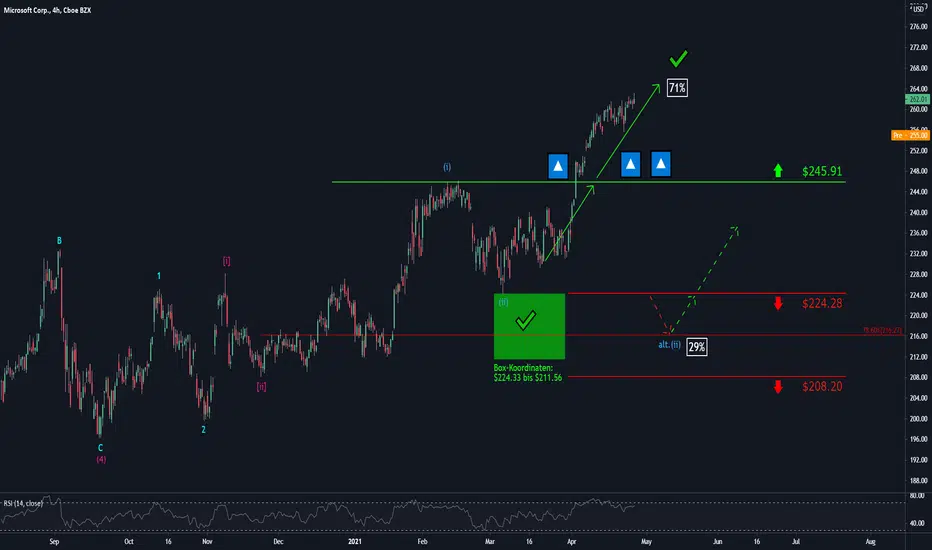
Microsoft: Reliable as it gets! 🙏🙏🙏Is there much to say about Microsoft? Not really, right?! Our technical analysis also reflects this, as we can see that the price is going to strongly increase after already crushing through the resistance at $245.91. From here, there is only one way: up!
Anything you would like us to analyze?
MSFT could continue the uptrendMSFT rise yesterday above the last resistance, so I expect an increase in the following days.

MSFT LongI think MSFT will break out of its bull flag and give us a 250 by June or before. It bounce of its Golden pocket on the fib and should retrace the length of the flag pole

MSFT Reversal Head and Shoulders- BullishAs you can see from the chart, MSFT broke out of a symmetrical triangle formation right around January 20th and enjoyed a very strong uptrend for about a month. We can see a clear break in this uptrend around February 18th just based on price action and we can also see that at this same time our fast EMA's quickly turned silver indicating a weakening of the uptrend. Since February 18th we can see that MSFT has formed a reversal head and shoulders pattern, with the head bouncing perfectly on the previous broken resistance line from the symmetrical triangle formation that it broke out of at the end of January (new support level). In addition to my T.A, I also have a strong price target for MSFT based on my fundamental analysis and believe $275-$300 price target is very possible.

MSFT 🌦Not sure howI feel about Microsoft. It Looks bullish; however, I don't think it will moon like other tech stocks.
***This does not constitute financial advice.***

TECHNICAL - GAP FILL - Microsoft $MSFTQuick Idea:
- Critical level for MSFT.
- Bulls need stopping volume to stop the island reversal drop.
- Gap will probably be filled, even if for dead cat bounce.
- At 234~ another decision point to confirm a downtrend

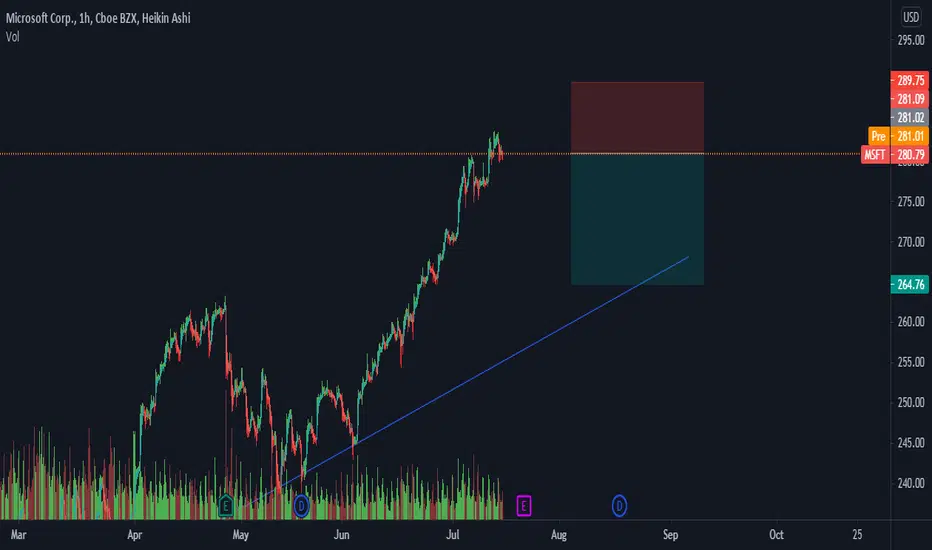
$MSFT TK cross PT $280 Heikin -AshiTK CROSS OVER CLOUD
BULLISH GREEN CLOUD
TRAILING LINE OVER PRICE ACTION
Would like entry here with tight stop or on a touch of base line.

Microsoft Long📈 NASDAQ:MSFT LONG H4
🛒Buy above = 245.52
🎯Target1 = 255.23
🎯Target2 = 261.2
🎯Target2 = 270.95
🛑Stop loss or cancel trade = 229.79

MSFT thoughtsIn a clear uptrend since inception
I wonder how these vital tech stocks will perform in comparison to cryptocurrencies this year
You need computers for cryptocurrency right? MSFT seems like a prime target
I would be long these tech stocks if I could find an easy and appealing investment tool for ones like this one
