MSFT Selling Pressure Activated — Time to Short!🔥 MSFT Bearish Profit Playbook — Thief-Style Layer Attack Activated! 🔥
Asset: MSFT — Microsoft Corporation (NASDAQ)
Style: Swing / Day-Trade Playbook 📉💼
📉 Plan: Bearish Pressure Play — Smart Sell-Side Thief Approach
Microsoft is showing potential exhaustion on the upside, and this setup focuses on a structured bearish move using a layered sell-limit strategy (Thief Layer Method) 😎🕵️♂️.
🎯 Entry Strategy (Thief Layer Method)
Using the thief-style multi-layer approach, we stack multiple sell-limit orders at different levels to catch premium liquidity:
Sell Limit Layers:
$500, $490, $480
(You can increase or adjust layers based on your own risk tolerance.)
This method aims to fade upward pushes, catching price exhaustion during liquidity grabs.
🛑 Stop Loss (Risk Control)
This is the Thief SL @ $510 🛑
Note: Dear Ladies & Gentlemen (Thief OG’s), I’m not recommending that you use only my stop-loss. It’s your money — your rules. Manage your risk like a pro. 💼⚠️
🎯 Target (Exit Zones)
We are aiming toward strong support zones + potential oversold zones where bearish momentum may slow.
Main Target: $450
Trap may form — escape with profits before the market police catch us 🚓💨
Note: Dear Ladies & Gentlemen (Thief OG’s), I’m not recommending using only my target. Exit where you feel safe and profitable. 🏦✨
📊 Market Summary (Clean, TV-Safe Explanation)
Bearish attempt based on overextended zones
Layered entries help clip premium during upside wicks
Targeting liquidity pockets near support
SL above structural invalidation
Setup respects TradingView House Rules: No financial advice, no promises, no signals, educational thief-style humor only ✔️
🔗 Related Pairs to Watch (Correlation Insights)
Because MSFT is a heavyweight in tech + NASDAQ index weighting:
1️⃣ NASDAQ:QQQ (NASDAQ 100 ETF)
Strongly correlated
If QQQ rejects from local resistance → MSFT bearish play strengthened
QQQ weakness = tech sector weakness
2️⃣ AMEX:SPY (S&P500 ETF)
Broader market risk sentiment
SPY pullback often pressures mega-caps like MSFT
3️⃣ NASDAQ:AAPL (Apple Inc.)
Moves similarly during liquidity rotations
Apple weakness = added pressure to mega-cap tech basket
4️⃣ NASDAQ:NVDA (Nvidia Corp.)
High-beta tech name
When NVDA loses momentum, MSFT downside probability increases through sector rotation
5️⃣ NASDAQ:GOOGL (Alphabet Inc.)
If large-cap tech corrects collectively, MSFT rarely moves opposite
Perfect correlation watch ⚡
Watching these pairs helps confirm bearish bias through sector-wide confirmation, not isolated signals.
✨ “If you find value in my analysis, a 👍 and 🚀 boost is much appreciated — it helps me share more setups with the community!”
⚠️ Disclaimer:
This is a thief-style trading strategy just for fun.
Educational only — not financial advice. Trade at your own risk. 😄🕵️♂️
Msftshort

PERFECT MSFT SHORTWe have a really strong timeframe alignment on NASDAQ:MSFT , presenting us with a great shorting opportunity.
Weekly
If we start top down from the weekly, MSFT had a strong and fast rally but has faced strong rejection on the upper side of its long term upward channel. Price may now look to retrace to its previous long-term swing high after this rejection. We also see volatility constriction through Bollinger Bands, indicating potential for large price moves and volume to occur soon.
Daily
On the daily chart we see a strong rejection of the daily 50 ema and resistive levels after a downside breakout.
Hourly
For the entry on the 1hr timeframe we are looking at a large head and shoulder formation, with a trend rejection and a strong rejection of the 1hr 100ema.
I am targeting the previous long-term swing high at 470 as my singular TP.
Goodluck-nfa.

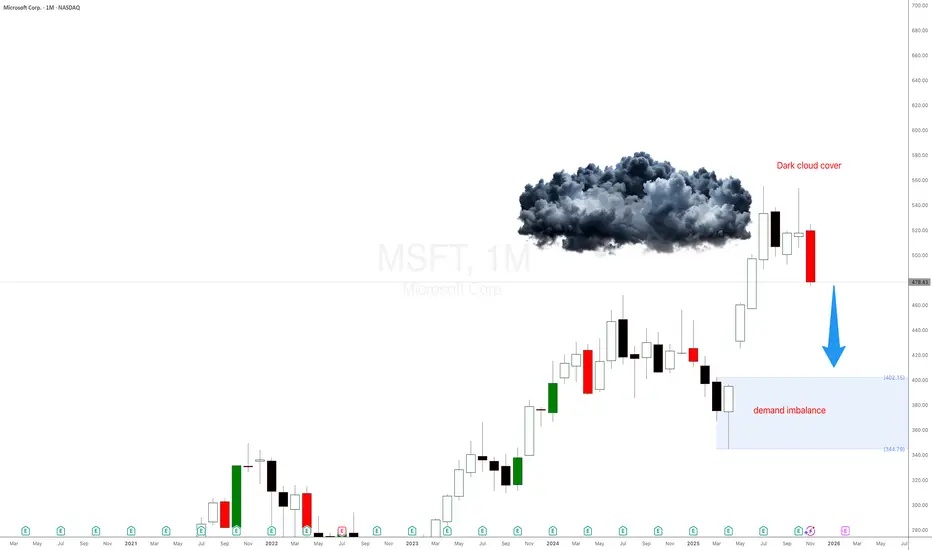
Why is Microsoft Stock $MSFT dropping hard?Microsoft just did what every impatient trader hates… after a massive rally, the candles are shrinking, emotions are rising, and here comes the correction everyone said ‘couldn’t happen.’ Today I’ll show you—using pure supply and demand—why MSFT is being magnetically pulled back into the monthly demand imbalance like a toddler to a candy shop. No fundamentals, no drama… just price action, imbalances, and patience. Let’s dive in.
Microsoft Monthly Supply & Demand Analysis
After Apple’s strong monthly correction setup, Microsoft (MSFT) is showing the exact same pattern — but even cleaner.
This is what I love when I teach traders to learn to trade stocks using pure price action and supply and demand imbalances. You don’t need news, earnings, or any guru opinion — everything is already priced in at the higher timeframes. Just like I explained in the Supply and Demand Free Course , the bigger timeframes tell you what the professionals already did months ago.
Let’s break it down.
Candles Shrinking = Momentum Weakening
Fast-forward to mid/late 2025:
- The wide-bodied candles disappeared
- Small-bodied candles appeared
- Then came the big bearish candle
This is classic momentum decay. This is exactly when most traders start acting emotionally:
- They zoom into 5-minute charts
- Their IQ drops by 50 points
- They forget the trend
- They forget the imbalance
- They become chart zombies
But price action never lies — we’re simply seeing exhaustion after a massive markup.
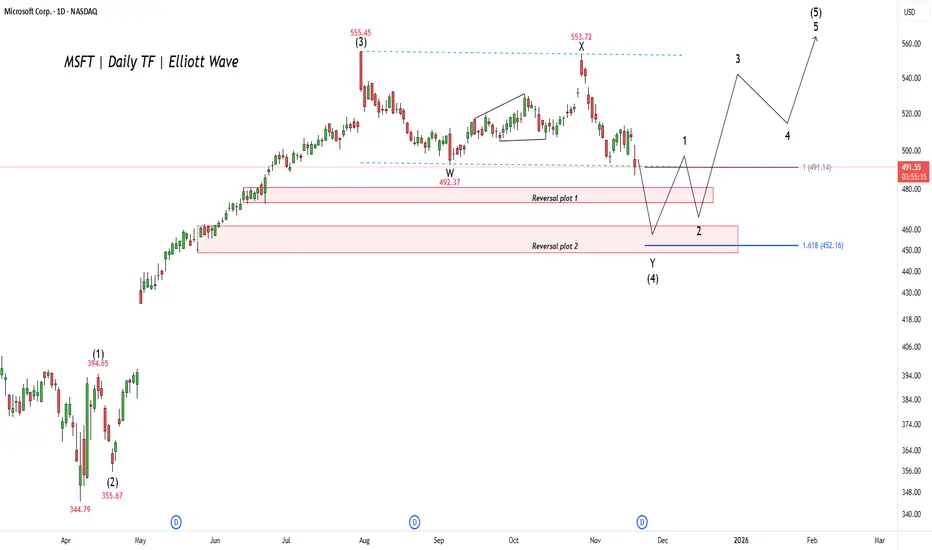
MSFT: Final Dip Before the Next LeapPrevious Idea:
Microsoft (MSFT) shows the stock is enduring a significant correction, which is the final pullback before a massive rally. This phase, labeled wave (4), is expected to find its bottom within a key support area. Traders are looking for this downswing to complete anywhere between the $452 and $492 zones. Hitting this target range would conclude the current multi-month drop and clear the path for the next major advance.
Once the correction successfully bottoms out in that crucial support range, the market expects a powerful final bullish surge, known as wave (5), to begin. This next wave is projected to drive the stock significantly higher, easily surpassing the previous all-time high of $555.45 . This bullish scenario will remain valid as long as the stock respects the identified support zone and begins its ascent from that area.
Microsoft - This bullrun will end soon!💊Microsoft ( NASDAQ:MSFT ) might reverse soon:
🔎Analysis summary:
Microsoft created a textbook bullish break and retest back in the beginning of 2025. After this retest, we then witnessed a major rally of about +50% over the past couple of months. But considering the recent weakneses and resistance, this rally might be over very soon.
📝Levels to watch:
$550
SwingTraderPhil
SwingTrading.Simplified. | Investing.Simplified. | #LONGTERMVISION

Microsoft’s Big Moves This Quarter | From Activision to AI AgentMicrosoft’s Revenue Surge: The Power of AI, Gaming, and Strategic Investments
Microsoft has released its Q1 FY25 earnings for the quarter ending in September
The stock saw a 6% drop, indicating the results fell short of investors' high hopes. Trading at over 30 times projected earnings for next year, expectations for Microsoft were significant.
CEO Satya Nadella stated
“Our AI business is set to exceed an annual revenue run rate of $10 billion next quarter, making it the fastest business in our history to reach this milestone.”
This means that AI will soon account for about 4% of Microsoft's total revenue in under three years a remarkable feat for a global giant.
If you need a quick summary, here are three main points:
1. ☁️ Azure’s growth is slowing. As Microsoft’s key player in the AI competition, Azure grew 34%, down slightly from 35% in the prior quarter (after adjustments). This comes as Google Cloud raised the bar, with its growth accelerating from 29% to 35% during the same period.
2. 🤖 AI growth is limited by hardware supply, as capacity struggles to meet demand. Data center expansion is a long-term process, and Microsoft is investing heavily in infrastructure, aiming for a growth boost by 2025.
3. 👨👩👧👦 Consumer-focused products like Gaming and Devices are underperforming. Although not essential to Microsoft's core business, their poor performance has impacted overall results.
Here’s a breakdown of the insights from the quarter.
Overview of today’s insights:
- New segmentation.
- Microsoft’s Q1 FY25 overview.
- Key earnings call highlights.
- Future areas to monitor.
1. New Segmentation
Revised Business Segments
In August, Microsoft announced a reorganization of its business segments, effective this quarter. The purpose? To better align financial reporting with the current business structure and strategic management.
Summary of the main changes
- Microsoft 365 Commercial revenue consolidation: All M365 commercial revenue, including mobility and security services, now falls under the Productivity and Business Processes segment.
-Copilot Pro revenue shift: Revenue from the Copilot Pro tool was moved from Productivity and Business Processes to the More Personal Computing segment under Search and news advertising.
-Nuance Enterprise reallocation: Revenue from Nuance, previously part of Intelligent Cloud, is now included in Productivity and Business Processes.
-Windows and Devices reporting combination: Microsoft now reports Windows and Devices revenue together.
Impact of These Changes:
Core Segments Overview:
In summary:
- The Productivity and Business Processes segment has grown significantly.
- The Intelligent Cloud segment has decreased due to the reallocation of Nuance and other revenue.
Products and Services Overview:
- M365 Commercial now includes Nuance, shifted from the Server products category, along with integrated mobility and security services.
- Windows & Devices have been merged into a single, slower-growth category.
Additional Insights:
- Azure, Microsoft's cloud platform, is reported within 'Server products and cloud services.' Although its growth rate is shared by management, exact revenue figures remain undisclosed.
Azure’s past growth figures have been adjusted for consistency, with the last quarter’s constant currency growth recast from 30% to 35%, setting a higher benchmark. Tracking these metrics is challenging due to limited revenue disclosure, but this recast indicates Azure's raised growth expectations.
2. Microsoft’s Q1 FY25 Performance
Financial Summary:
-Revenue: Up 16% year-over-year, reaching $65.6 billion (exceeding estimates by $1 billion). Post-Activision Blizzard acquisition in October 2023, the growth was 13% excluding the merger.
New Product and Services Segmentation Results
- Server products & cloud services: $22.2 billion (+23% Y/Y).
- M365 Commercial: $20.4 billion (+13% Y/Y).
- Gaming: $5.6 billion (+43% Y/Y), influenced by Activision.
- Windows & Devices: $4.3 billion (flat Y/Y).
- LinkedIn: $4.3 billion (+10% Y/Y).
- Search & news advertising: $3.2 billion (+7% Y/Y).
- Enterprise & partner services: $1.9 billion (flat Y/Y).
- Dynamics: $1.8 billion (+14% Y/Y).
- M365 Consumer products: $1.7 billion (+5% Y/Y).
Core Business Segments Breakdown:
- Productivity and Business Processes: Increased 12% Y/Y to $28.3 billion, supported by M365 Commercial, especially Copilot adoption.
- Intelligent Cloud: Grew 20% Y/Y to $24.1 billion, with Azure AI driving growth.
- More Personal Computing: Grew 17% Y/Y to $13.2 billion, including a 15-point boost from Activision. Devices fell, but search and ad performance improved under new segmentation.
Key Observations:
- Microsoft Cloud revenue climbed 22% Y/Y to $39 billion, making up 59% of total revenue (+3 percentage points Y/Y).
- Azure continues to drive cloud services and server products' growth.
- Xbox growth has surged due to the Activision acquisition since Q2 FY24, expected to stabilize by Q2 FY25.
- Windows OEM and devices combined, showing a 2% decline in Q1 FY25.
- Office rebranded to Microsoft 365; updated naming will be used starting next quarter.
- Margins: Gross margin at 69% (down 2pp Y/Y, 1pp Q/Q); operating margin at 47% (down 1pp Y/Y, up 4pp Q/Q).
- EPS: Increased 10% to $3.30, beating by $0.19.
Cash Flow and Balance Sheet:
- Operating cash flow: $34 billion (52% margin, down 2pp Y/Y).
- Cash**: $78 billion; Long-term debt**: $43 billion.
Q2 FY25 Outlook:
- Productivity and Business Processes: Anticipated 10%-11% Y/Y growth, steady due to M365, Copilot inclusion, and expected LinkedIn growth of ~10%. Dynamics set to grow mid-to-high teens.
- Intelligent Cloud: Projected 18%-20% Y/Y growth, slightly slowing, with Azure growth expected between 28%-29%.
- More Personal Computing: Forecasted ~$14 billion revenue, declines in Windows, Devices, and Gaming anticipated, with some offset from Copilot Pro.
Main Takeaways:
- Azure's growth slowed to 34% Y/Y in constant currency, with AI services contributing 12pp, up from 11pp last quarter. This marks a dip from the recast 35% prior and included an accounting boost.
- Capacity limitations in AI persist; more infrastructure investments are planned, with reacceleration expected in H2 FY25.
- Commercial performance obligations grew 21% to $259 billion, up from 20% in Q4.
- Margins were pressured by AI infrastructure investments; Activision reduced the operating margin by 2 points.
- Capital expenditures increased by 50% to $15 billion, half dedicated to infrastructure, with further Capex growth expected.
- Shareholder returns included $9.0 billion through buybacks and dividends, matching Q4 repurchases.
Earnings Call Highlights:
Azure AI saw a doubling of usage over six months, positioning it as a foundation for services like Cosmos DB and SQL DB. Microsoft Fabric adoption grew 14% sequentially, signaling rapid uptake.
AI Expansion: GitHub Copilot enterprise use surged 55% Q/Q, with AI-powered capabilities used by nearly 600,000 organizations, a 4x increase Y/Y.
M365 Copilot has achieved a 70% adoption rate among Fortune 500 companies and continues to grow rapidly.
LinkedIn saw accelerated growth in markets like India and Brazil and a 6x quarterly increase in video views, aligning with broader social media trends.
Search and Gaming: Bing’s revenue growth surpassed the market, while Game Pass hit a new revenue record, propelled by Black Ops 6
Capital Expenditures: CFO Amy Hood highlighted that half of cloud and AI investments are for long-term infrastructure, positioning the company for sustained growth.
4. Future Outlook
Energy Needs: Microsoft, facing higher power demands, plans to revive a reactor at Three Mile Island with Constellation Energy by 2028 to power its AI data centers sustainably.
Autonomous AI Agents: Coming in November, these agents will perform tasks with minimal human input, enhancing efficiency. Copilot Studio will allow businesses to customize these agents, with 10 pre-built options to start.
Industry Impact: Salesforce has launched Agentforce, signaling increased competition. CEO Mark Benioff recently compared Microsoft’s Copilot to the nostalgic Clippy, stoking rivalry.
For further analysis stay tuned

MSFT Weekly Options Play – 2025-06-09🧾 MSFT Weekly Options Play – 2025-06-09
Bias: Moderately Bearish
Timeframe: 5–6 days
Catalysts: Overbought RSI, weakening momentum, technical divergences
Trade Type: Single-leg put option
🧠 Model Summary Table
Model Direction Strike Entry Price Target Stop Loss Confidence
Grok Bearish 457.50P $0.76 $1.14 $0.19 65%
Claude Bearish 460.00P $1.03 $1.55 $0.72 70%
Gemini Bearish 457.50P $0.75 $1.20 $0.38 65%
DeepSeek Bearish 470.00P $3.65 $5.48 $2.56 70%
Llama Slightly Bullish 472.50C $3.15 $3.78 $2.83 68%
✅ Consensus: Short-term bearish trade setup
📉 Core Setup: Reversal from overbought with MACD divergence
⚠️ Outlier: Llama prefers bullish call due to longer-term trend strength
🔍 Technical & Sentiment Recap
Trend: Overextended rally, RSI (78.2) = overbought
Momentum: MACD shows bearish divergence on daily; 5-min weak
Sentiment: VIX ~16.7 = stable but cautious; mixed AI news & max pain at $460
Max Pain: $460 implies gravitational pull; current price may pull back
Volatility: Option premiums reflect narrow range, but directional edge favors downside
✅ Final Trade Recommendation
Parameter Value
Instrument MSFT
Strategy Single-leg PUT (weekly)
Strike $457.50
Entry Price $0.76 (ask)
Profit Target $1.22 (~60% gain)
Stop-Loss $0.38 (50% premium loss)
Size 1 contract
Entry Timing At market open
Confidence 65%
🎯 Rationale: Near-term exhaustion of upside, short-term technical reversal, and profit-taking setup with favorable risk/reward.
⚠️ Risk Checklist
Strong trend continuation could invalidate pullback thesis
Low VIX may reduce option gamma/velocity
Sector-wide positive catalyst (AI or rate cuts) can cause rapid rebound
Watch for closes above 10-EMA (~$461) to exit early if invalidated
📊 TRADE DETAILS SNAPSHOT
🎯 Instrument: MSFT
🔀 Direction: PUT (SHORT)
🎯 Strike: 457.50
💵 Entry Price: 0.76
🎯 Profit Target: 1.22
🛑 Stop Loss: 0.38
📅 Expiry: 2025-06-13
📏 Size: 1 contract
📈 Confidence: 65%
⏰ Entry Timing: open
🕒 Signal Time: 2025-06-09 01:44:06 EDT

MSFT Setup After EarningsEarnings season is heating up and Microsoft (MSFT) is once again in the spotlight. With its dominance in cloud and AI, the next move could be explosive.
Here’s how pro Im thinking my setting up:
🔹 $390 – A bold speculative entry for breakout hunters.
🔹 $365 – A defensive entry on post-earnings pullback to support.
🔹 $345 – The opportunity zone if a sharp drop offers value.
🎯 Profit Targets:
TP1: $410 – Psychological and technical resistance.
TP2: $426 – Momentum continuation level.
TP3: $445–$450 – Ambitious upside for long-term riders.
Whether you’re playing momentum or patiently buying dips, MSFT is offering clear levels. Stay sharp.
Disclaimer: This is not financial advice. All trading involves risk. Do your own research or consult a professional advisor before investing.

MSFT Following GOOG's Path? Targeting $350Hello Traders,
I’m sharing my analysis of the MSFT weekly chart. The price has bounced off the upper main channel line around $465.
Looking at the previous wave, it consisted of an uptrend (blue progression channel) lasting 94 weeks and a downtrend (grey channel) lasting 42 weeks, totaling 136 weeks. I’ve highlighted a yellow rectangle showing the price action after exiting the blue channel. Let's apply the same logic to the current wave, which started in January 2023.
The price has now exited the uptrend portion of the current wave (blue channel) and is retesting the broken channel's lower line, similar to what we observed in the yellow rectangle. Therefore, I expect a downtrend channel to form, potentially targeting $350 over the next 45 weeks.
I've aimed to make this analysis straightforward, and you'll notice that MSFT is exhibiting a pattern similar to GOOG, with two waves in a long-period progression channel.
Happy trading!
NASDAQ:MSFT

MSFT GREEN CANDLE EXPECTEDMsft can easily do 460 from here. I notified msft last mont near it's ER. Feel free to leave a comment if you have any doubts

IS THIS MAG7 DARLING ABOUT TO CRASH?!NASDAQ:MSFT
🔥 IS NASDAQ:MSFT ABOUT TO FALL OVER 21%?! 🔥
Let's not panic yet, but Microsoft's weekly charts are flashing some intriguing signals. Here’s the lowdown:
As long as NASDAQ:MSFT stays within its symmetrical pattern, we’re in the clear. But if it breaks downward, we’re looking at a potential 6% drop from the Volume profile shelf and possibly a dangerous 22% plunge, breaking the 2024 Head & Shoulders pattern. Enter the "Low Five Setup"—the bearish counterpart to my "High Five Setup."
Key factors to watch:
- Williams %R: Lower High
- MACD: Dangerously close to crossing below the zero line (BEARISH)
- RSI: Below RSI MA with lower highs, at 46—lots of room before oversold
- Trend: Lower high, red through yellow downward move indicating a downtrend on the weekly chart
Microsoft has been Wall Street’s golden goose, untouched by the FUD that hit the MAG7 stocks. Apple had China FUD, Tesla faced the ELON BAD FUD, Google with AI SEARCH FUD, Amazon with spending and margins FUD, Meta with metaverse spending FUD, and Nvidia with growth concerns FUD.
But as Willy Wonka taught us, every golden goose lays a bad egg sometimes. This is a weekly chart setup, so it will take time to play out. No one's immune to Wall Street’s FUD wrath, not even Microsoft. We shall see what happens...
P.S. I’m not in this name yet—just putting it on your radar. We’re early to the party, just like I always am with my setups. If you’re still here, you value solid, well-thought-out market analysis. Props to you!
Have a great Sunday, friends! 👊
Not Financial Advice #HighFiveSetup #LowFiveSetup

MSFT Setting up for a Long trade**Microsoft Value Correlation to USD and Interest Rates
>We are approaching oversold region for both correlations
**Election Year Seasonality forecast
>Setting up for a Bullish move on October 10
Technical Analysis:
1. Price could reach the highlighted Demand Zone and bounce.
2. Price could also reach the Gap Below the Demand zone. Price Gaps are like magnets because this is a market imbalance.
OTHERS:
>Scalpers can ride the Bearish trend until price reaches Demand Zone
>Long term traders can position for a Long trade at Demand Zone or at the Gap area.
***As always, manage your own trades, trade safe and make sure to do your due diligence when analyzing the charts.***

msft going down in valueas my prediction of spx500 and the major american indexes going down in another 'crisis' gold as a safe haven msft one of the most capitalises if not the most, not sure yet, giving a idead
of reversal trend as havin an double shoulder head and shoulder, daily basis, sgnifying that a reversal in the indexes can be coming in the next weeks or quarters,
trade safe, this is only my pov.

20% to 40% Dip Coming for Microsoft?DISCLAIMER: This is not trade advice. This is for educational & entertainment purposes only to demonstrate how I am looking to be involved with this market. Trading involves significant risk, do your own due diligence.
A concerning sign for Microsoft bulls triggered a few weeks ago. We saw the DPO divergence confirmed. Price targets to the downside of this confirmation imply a 20% to 40% dip is coming for Microsoft.
Do you think Microsoft is heading for a dump?
I do.
See you down there.

MSFT breakdown possible 450.50 below breakdown possible
need to sustain below trendline
expected to test this level
449.50/448/446/443/440/433

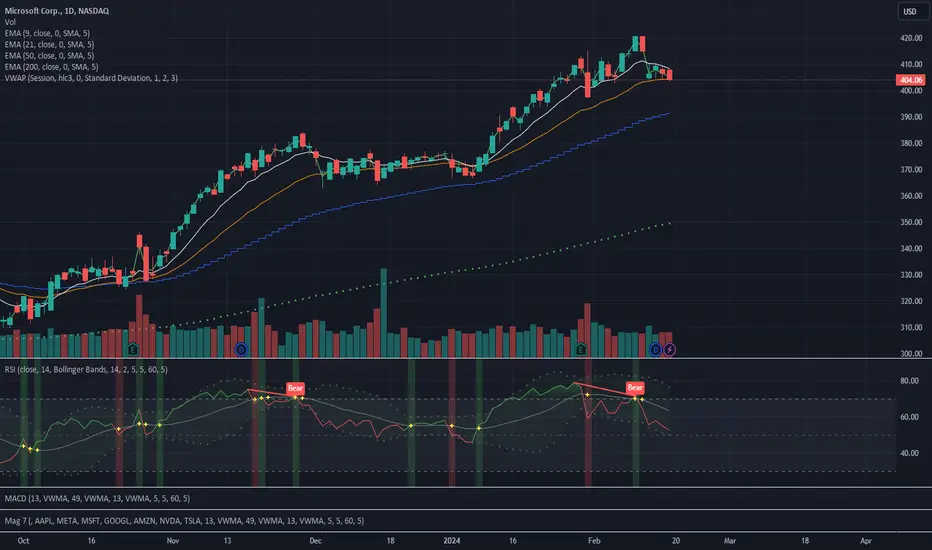
$MSFT earnings? Could we see another drop to $370?NASDAQ:META had a negative reaction to earnings yesterday. I was originally thinking that MSFT's earning reaction would be positive but as I look at the chart and options flows, I'm starting to think we're going to see a negative reaction.
I think most likely outcome is that we drop from here to around the $370 level, if that level can hold there's potential for one more rally into May to the $454 level. Otherwise if it can't, we risk seeing more downside to the lower levels.
Let's see what happens after the market closes.

MSFT likely made a long term top.Chart says it all. Multi decade parallel channel top has been reached. Now markets are sharply pulling back. Watch for break of long term uptrend red line and ideally short on retest of the red line. Possible HS pattern could play out too, back to 300$ in upcoming months

MSFT is bearish!I personally don't trade this stock on the long side due to personal believes.
But I dont mind shorting it with puts.
MSFT is bearish on daily timeframe
Today’s action hit its golden retracement pocket, as I was expecting after seeing yesterday’s AHs action.
The downside action remains the same - 370, and TTR long with Jun expiration 395 puts

MICROSOFT $MSFT - Mar. 11th, 2024MICROSOFT NASDAQ:MSFT - Mar. 11th, 2024
BUY/LONG ZONE (GREEN): $405.00 - $415.00
DO NOT TRADE/DNT ZONE (WHITE): $400.00 - $405.00
SELL/SHORT ZONE (RED): $394.10 - $400.00
Weekly: Bullish
Daily: DNT, Leaning Bearish
4H: DNT, Leaning Bearish
Wanted to draw up NASDAQ:MSFT after seeing the ranging zone on the daily timeframe, figured I might be able to pick a few entries no matter which trend price breaks into. The bullish zone is expanded farther than I typically would have it because of how price is moving in the range and because there have been already been multiple tests to each level. Previous zones are labeled for reference. I would heavily rely on the 1H/15min timeframes for entries, and the Daily/4H timeframes for structure and zones to determine which direction I'm trading in. The weekly timeframe is bullish and the daily obviously has the sideways range as previously stated, but I would lean bearish because of the level breaks and structural breakdowns. The 4H is where I'm mainly looking, there was a strong bearish drop last Tuesday, March 5th. Price dropped from the bullish zone, straight through the DNT zone and right into the bearish zone. Price then tested and rejected the structural zone above (405.00 - 405.50), dropped to the bottom of the bearish zone (target 400.00), then broke back into the DNT area before rejecting the top level (409.30 - 410.10) and dropping back into the previous bearish zone (405.00), which is the current DNT zone (405.00). Although there is a lot of level breaks up and down through each zone, I am leaning bearish on the smaller timeframes due to how price has dropped and then retested as opposed to the bullish counterpart.

Microsoft EW Analysis in 4hr time frameHello friends. We see the chart of Microsoft stock and this analysis by EW so be assumed start the 4th wave by abc moving I hope the price touch the 372 $ zone.

$MSFT Short idea NASDAQ:MSFT is showing bearish divergence on the RSI on the daily timeframe. We also see that price action has started to consolidate and the shorter term moving averages starting to curl. The $400 whole number would be a good entry to take MSFT short.
Short under $400 on MSFT.
💻Microsoft Corp💻 is Ready to Decrease➖15%🏃♂️ Microsoft Corp is moving near the 🟡 Potential Reversal Zone(PRZ)($437-$422) 🟡.
💡Also, we can see Regular Divergence(RD-) between two Consecutive Peaks .
🌊From the theory of Elliott waves , it seems that the macro can complete five main impulse waves in 🟡 Potential Reversal Zone(PRZ)($437-$422) 🟡.
🔔I expect the Microsoft Corp to at least fall to the 🟢 Support zone($368_$342) 🟢 after the completion of wave 5 and the breaking of the Uptrend line .
Microsoft Corp (MSFTUSD) Analyze, Daily time frame⏰.
Do not forget to put Stop loss for your positions (For every position you want to open).
Please follow your strategy; this is just my Idea, and I will be glad to see your ideas in this post.
Please do not forget the ✅' like '✅ button 🙏😊 & Share it with your friends; thanks, and Trade safe.

Microsoft bubble might have popped - Crash coming?This kind a lines up with all my other charts for a massive bubble pop. Unless there is a stick save somehow this is all going to unravel. MSFT had a throw over of the 2000 & 2021 top (red line) and back under which is very bearish.
I posted a zoomed in picture below.
