MSFT Selling Pressure Activated — Time to Short!🔥 MSFT Bearish Profit Playbook — Thief-Style Layer Attack Activated! 🔥
Asset: MSFT — Microsoft Corporation (NASDAQ)
Style: Swing / Day-Trade Playbook 📉💼
📉 Plan: Bearish Pressure Play — Smart Sell-Side Thief Approach
Microsoft is showing potential exhaustion on the upside, and this setup focuses on a structured bearish move using a layered sell-limit strategy (Thief Layer Method) 😎🕵️♂️.
🎯 Entry Strategy (Thief Layer Method)
Using the thief-style multi-layer approach, we stack multiple sell-limit orders at different levels to catch premium liquidity:
Sell Limit Layers:
$500, $490, $480
(You can increase or adjust layers based on your own risk tolerance.)
This method aims to fade upward pushes, catching price exhaustion during liquidity grabs.
🛑 Stop Loss (Risk Control)
This is the Thief SL @ $510 🛑
Note: Dear Ladies & Gentlemen (Thief OG’s), I’m not recommending that you use only my stop-loss. It’s your money — your rules. Manage your risk like a pro. 💼⚠️
🎯 Target (Exit Zones)
We are aiming toward strong support zones + potential oversold zones where bearish momentum may slow.
Main Target: $450
Trap may form — escape with profits before the market police catch us 🚓💨
Note: Dear Ladies & Gentlemen (Thief OG’s), I’m not recommending using only my target. Exit where you feel safe and profitable. 🏦✨
📊 Market Summary (Clean, TV-Safe Explanation)
Bearish attempt based on overextended zones
Layered entries help clip premium during upside wicks
Targeting liquidity pockets near support
SL above structural invalidation
Setup respects TradingView House Rules: No financial advice, no promises, no signals, educational thief-style humor only ✔️
🔗 Related Pairs to Watch (Correlation Insights)
Because MSFT is a heavyweight in tech + NASDAQ index weighting:
1️⃣ NASDAQ:QQQ (NASDAQ 100 ETF)
Strongly correlated
If QQQ rejects from local resistance → MSFT bearish play strengthened
QQQ weakness = tech sector weakness
2️⃣ AMEX:SPY (S&P500 ETF)
Broader market risk sentiment
SPY pullback often pressures mega-caps like MSFT
3️⃣ NASDAQ:AAPL (Apple Inc.)
Moves similarly during liquidity rotations
Apple weakness = added pressure to mega-cap tech basket
4️⃣ NASDAQ:NVDA (Nvidia Corp.)
High-beta tech name
When NVDA loses momentum, MSFT downside probability increases through sector rotation
5️⃣ NASDAQ:GOOGL (Alphabet Inc.)
If large-cap tech corrects collectively, MSFT rarely moves opposite
Perfect correlation watch ⚡
Watching these pairs helps confirm bearish bias through sector-wide confirmation, not isolated signals.
✨ “If you find value in my analysis, a 👍 and 🚀 boost is much appreciated — it helps me share more setups with the community!”
⚠️ Disclaimer:
This is a thief-style trading strategy just for fun.
Educational only — not financial advice. Trade at your own risk. 😄🕵️♂️
Msftsignals

MSFT Market Blueprint: From Pullback to Profit Zone💼 Asset: Microsoft Corporation (MSFT) — NASDAQ
Type: Swing Trade Setup
Bias: Bullish Pullback Play
🔍 Plan Overview
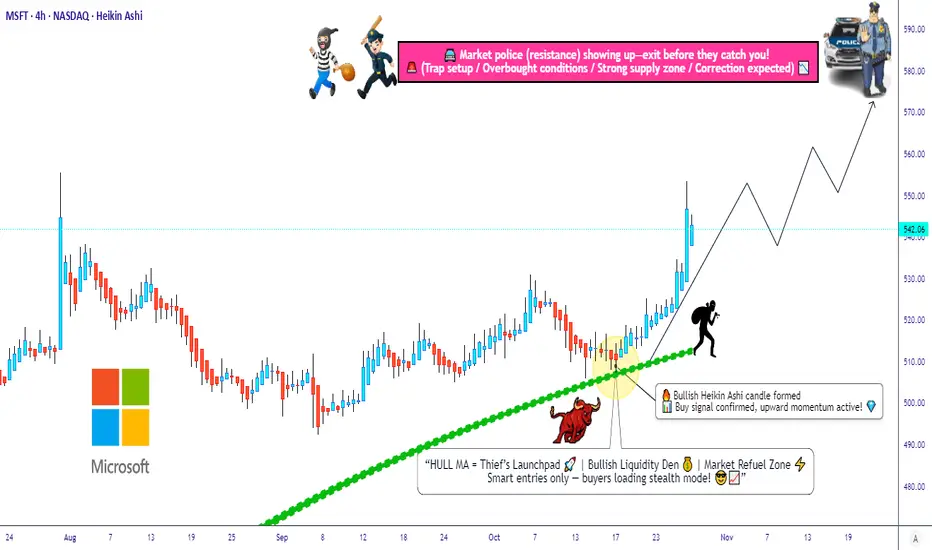
MSFT is showing a clean bullish pullback confirmation with the Hull Moving Average acting as dynamic support. A Heikin Ashi reversal doji candle has appeared — a strong hint that buyers are gaining control again 🟢.
Momentum looks ready to shift back to the upside as the pullback finds its footing. The plan focuses on catching this move with layered entries (a.k.a. “Thief Strategy” style).
⚙️ Entry Plan (Layered “Thief” Style Method)
This approach uses multiple limit orders to build a strong position during pullbacks. You can add or adjust based on your own risk appetite.
📍 Layered Entry Points:
🟩 520.00 — first buy zone (initial position)
🟩 530.00 — second layer (confirmation add-on)
🟩 540.00 — third layer (momentum add)
💡 Tip: You can increase or decrease the number of layers depending on volatility or confidence in trend continuation.
🔒 Stop Loss (SL)
🛑 Thief OG’s SL idea: 510.00
Note: Dear Ladies & Gentlemen (Thief OG’s), I’m not recommending to stick strictly to my SL — trade with your own risk management. Make money and protect it wisely. 💰
🎯 Target Profit (TP)
🎯 Target zone: 580.00
The “Police Force” (strong resistance zone) is waiting up there — where the market could become overbought or trap late buyers. That’s where we take our profit and vanish with gains like pros 😎.
Note: Dear Ladies & Gentlemen (Thief OG’s), again — you can set your own TP. This level is my personal exit zone for safety and profit lock.
🔗 Related Pairs & Market Watchlist
Keep an eye on correlated tech giants and ETFs to confirm momentum:
💻 NASDAQ:AAPL (Apple Inc.) – often leads the NASDAQ tech sentiment.
🌐 NASDAQ:GOOGL (Alphabet Inc.) – confirms sector strength.
📊 NASDAQ:QQQ (NASDAQ 100 ETF) – index pressure or breakout signal for techs.
⚙️ AMEX:XLK (Tech Sector ETF) – broader sector health indicator.
🧠 Correlation Insight:
When Apple ( NASDAQ:AAPL ) or Google ( NASDAQ:GOOGL ) show the same bullish reversal near their moving averages, it reinforces MSFT’s bullish continuation. Strong moves on NASDAQ:QQQ and AMEX:XLK also validate that the entire tech sector is moving in sync.
⚠️ Disclaimer
This is a Thief-style trading strategy, designed for educational and entertainment purposes only — just for fun 🎭.
Trade responsibly and manage your risk accordingly.
✨ “If you find value in my analysis, a 👍 and 🚀 boost is much appreciated — it helps me share more setups with the community!”
#MSFT #SwingTrade #BullishSetup #TechStocks #LayeredEntry #HeikinAshi #HullMA #TradingPlan #StockMarket #ThiefStyle #TradingView #Investing #NASDAQ #PriceAction
PERFECT MSFT SHORTWe have a really strong timeframe alignment on NASDAQ:MSFT , presenting us with a great shorting opportunity.
Weekly
If we start top down from the weekly, MSFT had a strong and fast rally but has faced strong rejection on the upper side of its long term upward channel. Price may now look to retrace to its previous long-term swing high after this rejection. We also see volatility constriction through Bollinger Bands, indicating potential for large price moves and volume to occur soon.
Daily
On the daily chart we see a strong rejection of the daily 50 ema and resistive levels after a downside breakout.
Hourly
For the entry on the 1hr timeframe we are looking at a large head and shoulder formation, with a trend rejection and a strong rejection of the 1hr 100ema.
I am targeting the previous long-term swing high at 470 as my singular TP.
Goodluck-nfa.

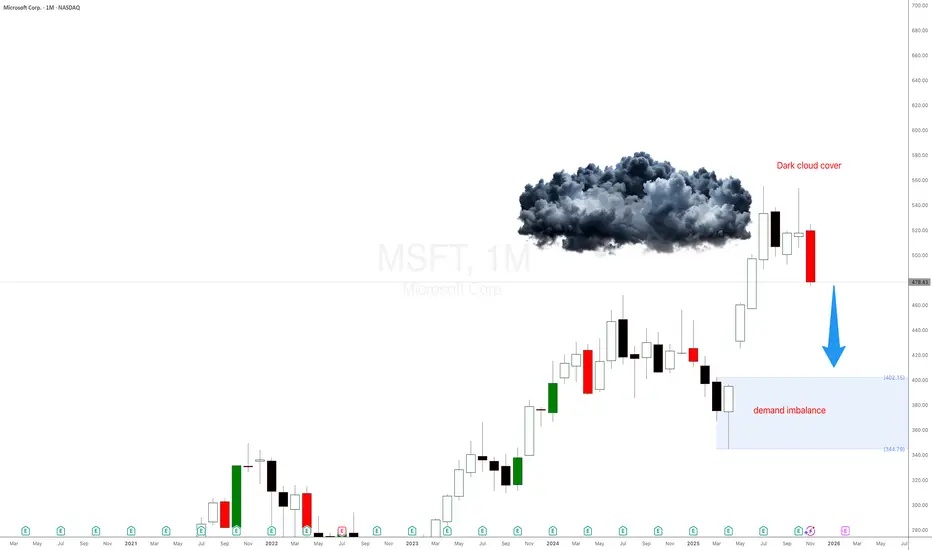
Why is Microsoft Stock $MSFT dropping hard?Microsoft just did what every impatient trader hates… after a massive rally, the candles are shrinking, emotions are rising, and here comes the correction everyone said ‘couldn’t happen.’ Today I’ll show you—using pure supply and demand—why MSFT is being magnetically pulled back into the monthly demand imbalance like a toddler to a candy shop. No fundamentals, no drama… just price action, imbalances, and patience. Let’s dive in.
Microsoft Monthly Supply & Demand Analysis
After Apple’s strong monthly correction setup, Microsoft (MSFT) is showing the exact same pattern — but even cleaner.
This is what I love when I teach traders to learn to trade stocks using pure price action and supply and demand imbalances. You don’t need news, earnings, or any guru opinion — everything is already priced in at the higher timeframes. Just like I explained in the Supply and Demand Free Course , the bigger timeframes tell you what the professionals already did months ago.
Let’s break it down.
Candles Shrinking = Momentum Weakening
Fast-forward to mid/late 2025:
- The wide-bodied candles disappeared
- Small-bodied candles appeared
- Then came the big bearish candle
This is classic momentum decay. This is exactly when most traders start acting emotionally:
- They zoom into 5-minute charts
- Their IQ drops by 50 points
- They forget the trend
- They forget the imbalance
- They become chart zombies
But price action never lies — we’re simply seeing exhaustion after a massive markup.
MICROSOFT may fall to $450 if this Support breaks.Microsoft (MSFT) has been trading within a 4-year Channel Up since the November 22 2021 High. Last week it got rejected exactly on its July 28 2025 Resistance (which was a Higher High for the Channel Up) and formed a Double Top, which continues to decline this week as well.
With its 1W RSI also displaying a Bearish Divergence (since the July High) similar to past sell alerts within this Channel Up, it is possible for the stock to correct to at least $450, which represents the 0.5 Fibonacci level where the previous July 2024 - March 2025 correction found Support. That was just above the 1W MA200 (orange trend-line), which also priced the bottom of the October 31 2022 Low but that correction was -38.69%, considerably stronger that -26.54%, which is also plausible if 2026 is a Bear Cycle.
The level that has confirmed those two correction Sell Signals within this Channel Up has been the 1D MA150 (red trend-line). On both occasions, Microsoft closed a 1W candle below the 1D MA150 and confirmed the correction, something that hasn't happened at any other time during these 4 years.
-------------------------------------------------------------------------------
** Please LIKE 👍, FOLLOW ✅, SHARE 🙌 and COMMENT ✍ if you enjoy this idea! Also share your ideas and charts in the comments section below! This is best way to keep it relevant, support us, keep the content here free and allow the idea to reach as many people as possible. **
-------------------------------------------------------------------------------
💸💸💸💸💸💸
👇 👇 👇 👇 👇 👇

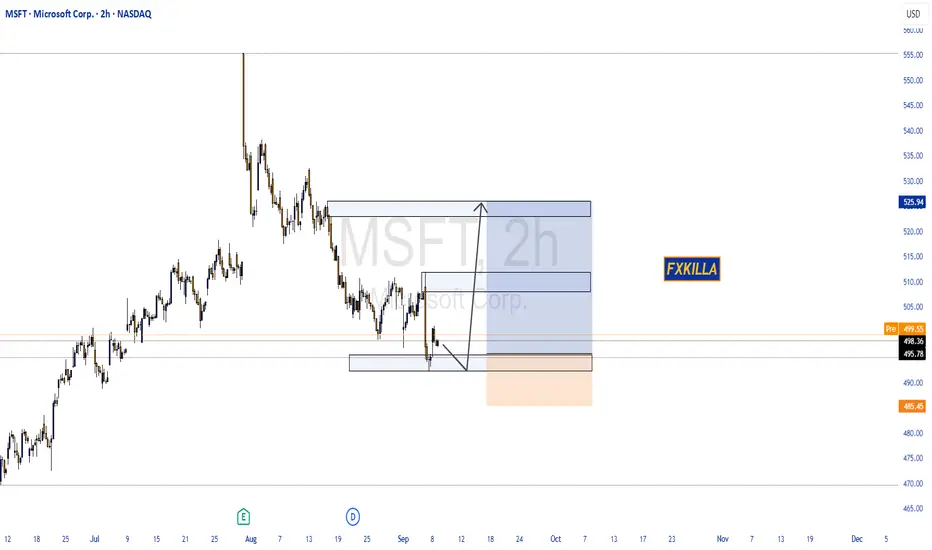
MICROSOFT CORP. HIGH PROBABILITY SETUP SOON!!🚨 MSFT HIGH PROBABILITY BUY SETUP 🚨
* Here We Can See Clearly The Next Potential Move For MSFT Coming Hours/Days.
* Keep Your Eyes Close On Your Trading Positions.
* Happy PIP Hunting Traders.
FXKILLA.
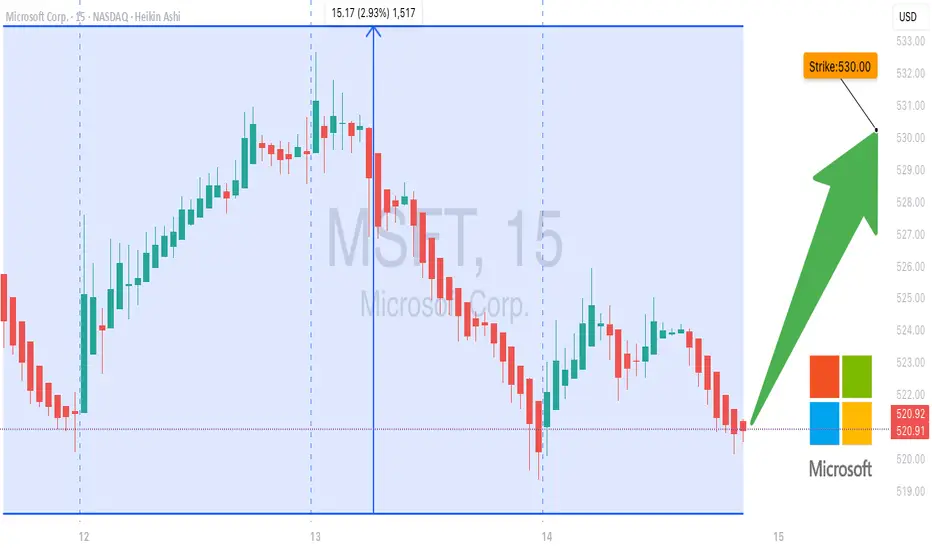
MSFT Weekly Calls on Fire – Can Bulls Beat the Clock?🚀 MSFT Bulls Charge at \$530 – Can They Double Before Expiry?
**Sentiment:** 🟢 *Strong Bullish*
* **Daily RSI:** 61.3 📈
* **Weekly RSI:** 81.4 🔥
* **Trend:** Bullish above key MAs & resistance
* **Volume:** Weak (0.5× last week) → watch for consolidation
* **C/P Ratio:** 2.34 (Institutional bullish flow)
* **VIX:** 15.0 → favorable for calls
---
### 📊 **Consensus Snapshot**
✅ Strong RSI + bullish options flow across all models
✅ Low volatility supports directional trades
⚠️ Volume weakness = possible pause before push
---
### 🎯 **Trade Setup**
* **Type:** CALL (Naked)
* **Strike:** \$530.00
* **Expiry:** 2025-08-15
* **Entry:** \$0.69
* **Profit Target:** \$1.38 (+100%)
* **Stop Loss:** \$0.34 (–50%)
* **Confidence:** 75%
* **Entry Timing:** Market open
---
💬 *One-day gamma sprint — manage risk, exit quick.*
📌 *Not financial advice. DYOR.*
---
**#MSFT #OptionsTrading #WeeklySetup #TradingSignals #StocksToWatch #DayTrading #OptionsFlow #GammaSqueeze**
MSFT Earnings Play (2025-07-31) — STRONG BULLISH SETUP
**🚨 MSFT Earnings Play (2025-07-31) — STRONG BULLISH SETUP 🚨**
**Microsoft \ NASDAQ:MSFT Pre-Earnings Trade Idea — 545C (Aug 1)**
---
### 🧠 **Earnings Thesis (🔥 80% Conviction)**
MSFT is set to report **BMO July 31**, and all signs point *bullish*:
📈 **Revenue Growth**: +13.3% YoY, driven by **AI + Cloud** momentum
💰 **Margins**: Profit 35.8%, Op 45.7%, Gross 69.1% — textbook pricing power
📊 **Guidance**: 100% beat history, avg. +5.8% surprise
📌 **Analyst Consensus**: 💪 Strong Buy | Target: \$549.90
📊 **Sector Tailwinds**: Tech favored in current macro with Fed on hold
➡️ **Score: 9/10 Fundamentals | Bullish Momentum Across the Board**
---
### 🔍 **Options Flow & Technicals**
🔥 **Implied Move**: \~6.3% by Aug 1
📉 **IV Rank**: 0.75 (Room to expand post-earnings)
💸 **Call Flow**: Strong OI in 540–550 zone, gamma buildup may fuel squeeze
📊 **RSI**: 70.14 → Bullish, close to overbought
📈 **Support**: \$505 | **Resistance**: \$518.29
➡️ **Score: 8/10 Options | 8/10 Technicals**
---
### 🧨 Trade Setup: 545 CALL (Aug 1 Exp)
🎯 **Entry Price**: \$0.90
📅 **Expiry**: 2025-08-01
📈 **Profit Target**: \$1.80 (⚡️+100%)
🛑 **Stop Loss**: \$0.45
📐 **Size**: 2 contracts (2% portfolio risk)
💡 **Timing**: Enter **EOD July 30 (Pre-earnings)**
⚠️ **IV Crush Alert** → Exit within 2 hours *post-earnings*
---
### ✅ RISK PLAN
* Position: Max 2–3% of portfolio
* IV crush & gap protection: Tight stop and quick post-earnings exit
* Exit Plan: \$1.80 or Stop \$0.45, OR close manually after earnings move
---
📊 **Trade JSON Snapshot**
```json
{
"ticker": "MSFT",
"direction": "CALL",
"strike": 545,
"entry": 0.90,
"target": 1.80,
"stop": 0.45,
"expiry": "2025-08-01",
"entry_time": "EOD Jul 30",
"earnings_date": "2025-07-31 BMO",
"confidence": "80%",
"expected_move": "6.3%",
"iv_rank": "0.75"
}
```
---
🧠 **Summary**
MSFT is poised for a **clean earnings beat** with bullish fundamentals, strong options flow, and upside momentum. This is a **high-conviction, short-dated trade** with defined risk.
🎯 **Watchlist it. Size smart. Exit fast.**

MSFT Setup After EarningsEarnings season is heating up and Microsoft (MSFT) is once again in the spotlight. With its dominance in cloud and AI, the next move could be explosive.
Here’s how pro Im thinking my setting up:
🔹 $390 – A bold speculative entry for breakout hunters.
🔹 $365 – A defensive entry on post-earnings pullback to support.
🔹 $345 – The opportunity zone if a sharp drop offers value.
🎯 Profit Targets:
TP1: $410 – Psychological and technical resistance.
TP2: $426 – Momentum continuation level.
TP3: $445–$450 – Ambitious upside for long-term riders.
Whether you’re playing momentum or patiently buying dips, MSFT is offering clear levels. Stay sharp.
Disclaimer: This is not financial advice. All trading involves risk. Do your own research or consult a professional advisor before investing.

MICROSOFT Channel Down bottom formation targets $440.Microsoft (MSFT) has been trading within a Channel Down since the July 05 2024 High. The stock is on its latest Bearish Leg in the past 3 months and almost completed a -17.62% decline, similar with the Bearish Leg that led to the August 05 2024 Low.
As the 1D RSI has Double Bottomed, which is what it did on the April 30 2024 Low that kick started a rally of +20.63%, we expect the stock to initiate its new Bullish Leg of the Channel. The previous one was +18.16%, so we expect a similar range and target $440.
-------------------------------------------------------------------------------
** Please LIKE 👍, FOLLOW ✅, SHARE 🙌 and COMMENT ✍ if you enjoy this idea! Also share your ideas and charts in the comments section below! This is best way to keep it relevant, support us, keep the content here free and allow the idea to reach as many people as possible. **
-------------------------------------------------------------------------------
💸💸💸💸💸💸
👇 👇 👇 👇 👇 👇

Microsoft Update: Key Levels to WatchMicrosoft ( NASDAQ:MSFT ) is at an important point right now, and here’s what to look out for:
If we close above $442: There’s a good chance we’ll see targets at $453 or even $478 as buyers take control.
If the price breaks down out of the current range: A correction to $422 or $415 becomes a strong possibility.
Stay focused on these levels and let the market show you the way forward. No need to force it—patience pays.
Kris/Mindbloome Exchange
Trade What You See

MICROSOFT Targeting $500 before the end of the year.Microsoft (MSFT) has made a new long-term bottom and recovered almost all of August's losses. That bottom is technically the Higher Low of the 20-month Channel Up that started in January 2023.
The price is currently consolidating below the 1D MA100 (green trend-line) and if broken, it will confirm the new Bullish Leg. In the previous (2) Bullish Legs of this Channel Up, the price tends to re-test the 1D MA50/100 cluster to confirm it as the new long-term Support after the break-out, so expect that to take place at some point.
Having though formed a new 1D MACD Bullish Cross, we can assume that this is already a safe level to buy for the long-term, as every Bullish Cross below 0.0 has technically been a confirmed buy level. Our Target for the end of the year is $500, which is still technically a 'modest' one as it is considerably below the 2.0 Fibonacci extension, which priced the March Higher High.
-------------------------------------------------------------------------------
** Please LIKE 👍, FOLLOW ✅, SHARE 🙌 and COMMENT ✍ if you enjoy this idea! Also share your ideas and charts in the comments section below! This is best way to keep it relevant, support us, keep the content here free and allow the idea to reach as many people as possible. **
-------------------------------------------------------------------------------
💸💸💸💸💸💸
👇 👇 👇 👇 👇 👇

MSFT is bearish!I personally don't trade this stock on the long side due to personal believes.
But I dont mind shorting it with puts.
MSFT is bearish on daily timeframe
Today’s action hit its golden retracement pocket, as I was expecting after seeing yesterday’s AHs action.
The downside action remains the same - 370, and TTR long with Jun expiration 395 puts

MICROSOFT How to trade as the Earnings approach?Microsoft (MSFT) is set to report the Earnings on Tuesday and last time we gave gave a pull-back buy signal (December 01 2023, see chart below) we caught the exact bottom:
Our original long-term Target was $460.00 but we have to downgrade it to $440.00. On the short-term it may be wise to take most or at least some of the profit if the 1D MA20 (red trend-line) as this has been a medium-term sell signal on July 26 2023. It's not just potentially lower than expected Earnings that may turn the trend bearish on the medium-term but also the Fed, which announce the Rate Decision on Wednesday.
As a result, if the price breaks below the 1D MA20, we will short and target the 1D MA100 (green trend-line) at $370.00 where we will add another long-term buy position. Notice that the 1D CCI indicator and the correlation with the 2023 price action, shows that both scenarios are equally likely at the moment.
-------------------------------------------------------------------------------
** Please LIKE 👍, FOLLOW ✅, SHARE 🙌 and COMMENT ✍ if you enjoy this idea! Also share your ideas and charts in the comments section below! This is best way to keep it relevant, support us, keep the content here free and allow the idea to reach as many people as possible. **
-------------------------------------------------------------------------------
💸💸💸💸💸💸
👇 👇 👇 👇 👇 👇

MICROSOFT The 1D MA50 will be the buy opportunity for Xmas.Microsoft (MSFT) is trading inside a Double Channel Up pattern, with the longer term one (blue) starting on the January 06 bottom while the shorter term one (dotted) starting on the September 14 High. The latter Channel Up can be seen with the same structure earlier within the long-term Channel Up as well. It started after the stock pulled back and hit the 1D MA50 (blue trend-line), which provided a strong rebound.
The same kind of 1D MA50 test took place on October 26, which initiated the current bullish leg (November). As the 1D RSI is posting a Bearish Divergence (Channel Down) simiarl to March 17 - April 12 and the 1D MACD completing a Bearish Cross, we expect one final pull-back towards the 1D MA50. That can be the ideal buy entry for the end-of-the-year rally. Our long-term target is always $460, representing a +43.50% rise from the 1D MA50 bounce (similar to March 13).
-------------------------------------------------------------------------------
** Please LIKE 👍, FOLLOW ✅, SHARE 🙌 and COMMENT ✍ if you enjoy this idea! Also share your ideas and charts in the comments section below! This is best way to keep it relevant, support us, keep the content here free and allow the idea to reach as many people as possible. **
-------------------------------------------------------------------------------
💸💸💸💸💸💸
👇 👇 👇 👇 👇 👇

MSFT Soars with the Arrival of Sam Altman from OpenAII wanted to share the latest development that has the potential to spark a remarkable surge in Microsoft's stock value.
Imagine the possibilities that await as MSFT makes a strategic move by hiring none other than Sam Altman, the renowned technology visionary behind OpenAI. Altman's groundbreaking expertise in artificial intelligence (AI) and his impressive track record in shaping the future of technology make this an exhilarating moment for all MSFT investors.
With Altman on board, MSFT is set to revolutionize the tech industry and solidify its position as a leading force in innovation. The integration of his visionary mindset, coupled with Microsoft's already sterling reputation and enduring commitment to evolving technology, heralds a significant opportunity for continued growth and groundbreaking achievements.
In light of this momentous news, I invite you to join me in seizing the potential for substantial gains as MSFT aims to hit unprecedented highs. Now is the time to act and position ourselves for a profitable long-term investment opportunity. I strongly encourage you to consider taking a long position in MSFT, as this could be a game-changing move for your portfolio.
Let's ride the wave of this incredible development and harness the power of Altman's expertise and Microsoft's unwavering dedication to reshaping the tech landscape. By investing in MSFT today, we have the chance to participate in a remarkable journey towards new horizons of success.
Don't miss out on this investment opportunity; the potential for incredible returns is within our grasp. Position yourself for success by joining me in going long on MSFT and embarking on this exciting venture together.

[EN] MSFT will close the gap of April 2023 // GaliortiTradingNASDAQ:MSFT had a bullish gap in April 2023 from which the last bullish leg originated . It is currently developing a countertrend bearish leg within a descending channel. There is a clear bearish divergence with the oscillator .
We think there is a high probability that it will try to close this bullish gap . To do so, it will have to look for the floor of the current bearish channel (July 2023), which will be pierced. The declines will be stopped by the liquidity zone of $275-280 and the medium-term bullish guideline (December 2018).
From there , the probability of an upward restructuring should be contemplated since a pull-back to the $310 support would be essential to continue rising or to perform a second downward leg (ABC).
Pablo G.

Microsoft 23/10 MovePair : Microsoft Corp
Description :
Symmetrical Triangle as an Corrective Pattern in Short Time Frame , Rejecting from the Upper Trend Line and Demand Zone. Completed Impulsive Waves and Corrective Waves " abc " , If it Breaks the Lower Trend Line and Retest then it will Short
Entry Precaution :
Wait for the Proper Rejection with Strong Price Action

Microsoft accidentally revealed that Xbox Series X|S Microsoft accidentally revealed that Xbox Series X|S sales exceeded 21 million units worldwide
As posted by Twitter user 'John Welfare' after being spotted by @Lukastaves Microsoft held a presentation during this year's BIG Festival in Brazil which is taking place from June 28th through July 2nd. Interestingly, during this presentation, Microsoft showed a sheet revealing Xbox console sales numbers, including sales numbers for the Series X|S.
I don't think this is news at all.
Graphically, the price is testing its monthly high.
In two years, a test of the level.
I think it's a great zone to sell the stock and buy it back cheaper.
marked the green zone.
Waiting for the decline.
if you like the idea, please "Like" it. This is the best "Thanks!" for the author 😊 P.S. Always do your own analysis before a trade. Put a stop loss. Fix profits in installments. Withdraw profits in fiat and please yourself and your friends.

Microsoft Challenges Fib 3.618 levelMicrosoft - NASDAQ:MSFT
Expectations were beat across the board today but what does the long term monthly chart tell us? All is revealed in the chart. This is a key moment for NASDAQ:MSFT and a pull back or break through to established new highs wouldn't surprise. I'm happy to wait for the confirmations outlined in the chart. That MACD cross though looks appealing.
Earnings Summary
- Profits jumped 20% to 20.1 b
- EPS: $2.69 / Exp $2.56
- Revenue: $56.19B / Exp $55.49B
- Azure (cloud) revenue up 26% / Exp 27%

MICROSOFT Huge MACD Bearish Cross ahead of earnings. Still buy?Microsoft (MSFT) has been trading within a Channel Up pattern since the March 13 Low, with the 1D MA50 (blue trend-line) supporting all the way, having made no contact with the price at all. You can see that on the chart on the right (1D time-frame).
On the bigger picture, the 1W time-frame (chart on the left), the stock closed last week's 1W candle on a very discouraging Bearish Pin Bar, which is a candle formed on technical trend reversals from bullish to bearish. In addition the 1W RSI remains overbought above 70.00, despite dropping from the even higher levels of May 30.
Perhaps the strongest alarming indicator at the moment showing that the market may have hit a temporary top is the emerging Bearish Cross on the 1W MACD. Since 2020, we have seen that formation another 7 times, with 6 of them delivering a Lower Low. As a result when the 1W MACD Bearish Cross is completed, it will be more probable to see a correction, not necessarily an earth shuttering one.
But back to the 1D time-frame (chart on the right) if that happens, we will wait for a candle close below the 1D MA50 and sell, targeting the 1D MA200 (orange trend-line) on a projected contact at $300. Until this happens though, the Channel Up is on full effect and we are targeting the Internal Higher Highs trend-line at $380.
In the meantime, observe the 1D RSI, which is trading inside a Rectangle for the past 6 months and has offered accurate buy signals at its bottom and sell signals at its top.
-------------------------------------------------------------------------------
** Please LIKE 👍, FOLLOW ✅, SHARE 🙌 and COMMENT ✍ if you enjoy this idea! Also share your ideas and charts in the comments section below! **
-------------------------------------------------------------------------------
💸💸💸💸💸💸
👇 👇 👇 👇 👇 👇

MSFT suppressed by the 3.000 level of the golden sectionMSFT suppressed by the 3.000 level of the golden section
This chart shows the weekly candle chart of Microsoft stock in the past two years. The graph overlays the low point at the end of October 2022 against the golden section. As shown in the figure, Microsoft's stock has reached another new high this week, breaking through the highest point at the end of 2021! But the weekly pattern of Microsoft stock this week is a long shadow line, with the highest point precisely suppressed by the 3.000 level of the golden section in the figure! Based on last week's weekly pattern, Microsoft's stock market is likely to enter a contraction triangle consolidation state in the future!

FTC Appeals to Block Microsoft Activision MergerI am providing a crucial update regarding the recent news of the Federal Trade Commission's (FTC) decision to appeal against the proposed merger between Microsoft and Activision. This development has significant implications for the tech industry, particularly for those who have invested or are considering investing in Microsoft stock.
The FTC's decision to appeal the merger indicates that regulatory authorities are scrutinizing the potential consequences of this consolidation. While mergers and acquisitions can often lead to positive outcomes, such as improved products and services, it is essential to approach this situation cautiously, considering the potential risks and uncertainties ahead.
As tech traders, it is crucial to carefully evaluate the potential impact of this appeal on Microsoft's stock performance. The uncertainty surrounding the outcome of the appeal, coupled with potential delays or even the possibility of the merger being blocked, could significantly influence the company's stock value in the short to medium term.
Therefore, I strongly advise you to exercise prudence and consider holding off on buying Microsoft stock until further clarity emerges regarding the outcome of the FTC's appeal. By doing so, you can better protect your investment and mitigate potential risks associated with this merger.
It is important to understand this is not financial advice but rather an alert to the potential implications of the FTC's appeal on Microsoft's stock performance. As always, I encourage you to consult your financial advisor or conduct thorough research before making investment decisions.
In conclusion, the FTC's decision to appeal the Microsoft-Activision merger has introduced an element of uncertainty into the market. By adopting a cautious approach and refraining from immediate stock purchases, you can better position yourself to make informed investment choices once more clarity on the situation emerges.
