MUBARAK/USDT at a Critical Trendline – Breakout or Rejection?On the 2D timeframe, MUBARAK/USDT remains in a medium to long-term downtrend. Since its previous peak, price action has consistently formed lower highs and lower lows, confirming sustained selling pressure.
Currently, price is attempting a recovery and is now approaching the main descending trendline, making this area a critical decision zone for the next major move.
---
Pattern & Structure Explanation
1. Descending Trendline (Major Dynamic Resistance)
The yellow trendline represents a key dynamic resistance that has rejected price multiple times in the past.
As long as price stays below this trendline, the overall structure remains bearish.
2. Bearish Continuation Structure
After the strong breakdown in October, price entered a weak recovery and consolidation phase.
The current upward move is still considered a pullback unless a confirmed breakout occurs.
3. Horizontal Key Levels
0.02660 USDT: Important horizontal resistance and previous reaction zone.
0.02320 USDT: Short-term equilibrium / minor resistance currently being tested.
0.02100 – 0.02000 USDT: Nearest support zone.
0.03800 USDT: Next major resistance if a bullish breakout happens.
---
Key Levels
Dynamic Resistance: Descending trendline
Horizontal Resistance:
0.02660 USDT
0.03800 USDT
Main Support:
0.02100 – 0.02000 USDT
0.01700 USDT (next downside support)
---
Bullish Scenario
The bullish scenario is only valid if price breaks and closes clearly above the descending trendline.
Bullish confirmation:
Strong 2D candle close above the trendline
Price holds above 0.02660 USDT
Potential upside targets:
TP 1: 0.02660 USDT
TP 2: 0.03200 USDT
TP 3: 0.03800 USDT
A breakout supported by increasing volume would signal a trend reversal from bearish to bullish.
---
Bearish Scenario
The bearish scenario remains dominant if price gets rejected at the descending trendline.
Bearish confirmation:
Clear rejection or long upper wicks near the trendline
Failure to close above 0.02660 USDT
Downside targets:
Support 1: 0.02100 – 0.02000 USDT
Support 2: 0.01700 USDT
Rejection at this level would confirm that the current rise is only a dead cat bounce or pullback within a broader downtrend.
---
Conclusion
MUBARAK/USDT is currently trading at a critical decision zone.
Trendline breakout → potential bullish reversal
Trendline rejection → continuation of the downtrend
Traders should wait for clear confirmation before entering large positions, as this area carries a high risk of false breakouts.
---
#mubarak #mubarakusdt #cryptotrading #technicalanalysis #downtrend #trendline #altcoinanalysis #binance #priceaction #supportresistance
Mubarakusd

MUBARAKUSDT | Potential ReversalHello traders,
I'm seeing early bullish signs on MUBARAK's chart. Internal downtrend break + hidden bullish divergence on OBV
Entry, SL, TP marked on chart.
Good Luck

MUBARAK - Bearish Descending TriangleTechnical Analysis
A bearish triangle (descending triangle) has formed after a strong impulsive sell-off, indicating a continuation pattern within a prevailing downtrend.
Price is making lower highs, while demand is weakening around a horizontal support zone. This compression of price action reflects seller dominance and declining buying pressure. The structure suggests that the market is building liquidity before the next leg down.
A bearish breakdown below the support zone would confirm the pattern and open the way for further downside continuation.
Key levels & targets:
Breakdown confirmation: below current support
Primary target: 0.012
Extended target: 0.010
As long as price remains below the descending trendline, the bearish bias remains valid. Any short-term pullbacks toward resistance are considered corrective unless structure is invalidated.

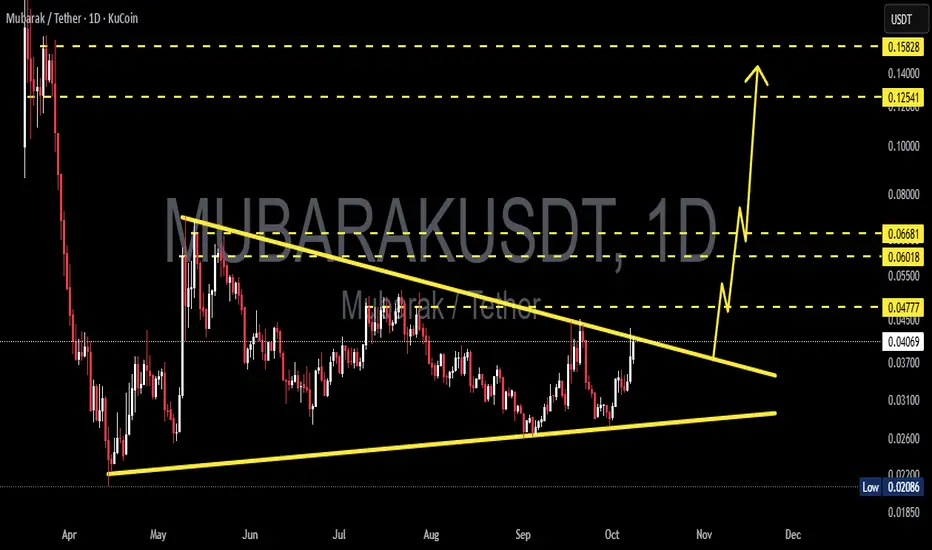
MUBARAKUSDT — On the Edge of an Explosive Move: Bullish BreakoutThe MUBARAK/USDT pair is approaching a crucial moment as price action compresses inside a Symmetrical Triangle, signaling the market’s tension before a major breakout.
Whenever price reaches the apex of a pattern like this, it often precedes a sharp expansion in volatility — a make-or-break moment for traders.
---
🔶 Pattern Overview & Technical Structure
The Symmetrical Triangle represents a battle of equilibrium between buyers and sellers:
The descending upper trendline keeps pushing lower highs.
The ascending lower trendline protects higher lows.
As both lines converge, energy builds up within the pattern — usually leading to an explosive breakout once one side wins.
Declining volume supports this setup, hinting that a big move is imminent.
---
💹 Key Technical Levels
Current Price: around 0.04050 USDT
Main Resistance: 0.04777 → 0.06018 → 0.06681
Dynamic Support: 0.03100 → 0.02600
Major Support: 0.02086 (historical low)
If a confirmed breakout occurs, the measured move projection from this triangle points toward a potential upside target near 0.086, depending on follow-through and volume confirmation.
---
🚀 Bullish Scenario (Upside Breakout)
Confirmation: A daily candle close above the descending trendline with strong volume.
Continuation: Retest of the breakout zone that turns former resistance into new support.
Upside Targets:
TP1 → 0.04777 (initial resistance)
TP2 → 0.060–0.0668 (supply zone)
TP3 → around 0.086 (measured move projection)
Momentum catalysts — such as surging volume or renewed altcoin rotation — could accelerate this breakout move.
---
⚠️ Bearish Scenario (Rejection / Breakdown)
Confirmation: Strong rejection at upper trendline with long wick and close back below resistance.
Breakdown Trigger: Daily close below the ascending trendline with increasing sell volume.
Downside Targets:
0.026–0.031 (dynamic support zone)
Below that → retest of 0.02086 (historical demand level)
Failure to hold support could spark panic selling, especially given MUBARAK’s relatively low liquidity profile.
---
📊 Momentum Checklist
Watch closely for:
Volume spikes → true breakout confirmation.
Daily close above 0.04777 → bullish validation.
Daily close below 0.03100 → bearish confirmation.
Avoid reacting to intraday wicks — focus on daily candle closes for real signals.
---
🧭 Conclusion & Technical Bias
MUBARAK is standing at a critical compression point — the calm before the storm.
A confirmed breakout could open the path toward 0.06–0.086, while rejection at the trendline risks sending price back below 0.03.
Volume and daily close confirmation will determine whether bulls or bears take control next.
---
#MUBARAK #MUBARAKUSDT #CryptoBreakout #TrianglePattern #TechnicalAnalysis #Altcoin #KuCoin #CryptoTrading #SymmetricalTriangle #ChartAnalysis
MUBARAK/USDT — Confluence Accumulation Zone?🔎 Overview
MUBARAK/USDT is currently testing the critical support zone (0.022 – 0.028 USDT), which aligns with a medium-term ascending trendline. This confluence makes the area a decisive “do or die” zone: either a strong rebound that may trigger a reversal, or a confirmed breakdown that could push prices much lower.
---
📍 Key Technical Levels
Current Price: ≈ 0.0298
Main Support Zone (yellow box): 0.022 – 0.028
Critical invalidation support: 0.0208
Resistances:
R1 = 0.03862
R2 = 0.04299
R3 = 0.04999
R4 = 0.06630
---
🧩 Structure & Patterns
1. Accumulation zone: price repeatedly bounced within 0.022–0.028, suggesting active buyers.
2. Ascending trendline: supports higher lows on the mid-term structure.
3. Lower highs still dominate → bulls need a breakout above 0.0386 to flip the structure.
4. Potential double bottom: a strong rejection here could mark a classic bullish reversal.
5. Breakdown scenario: a daily close below 0.022 with volume = bearish continuation toward 0.0208 → 0.0164.
---
🚀 Bullish Scenario
Confirmation signals:
Strong rejection candle (long lower wick + close above zone).
Volume expansion.
Daily close above 0.0386.
Upside targets:
TP1 = 0.03862
TP2 = 0.04299
TP3 = 0.04999
TP4 = 0.06630
Strategy:
Conservative entry on retest after rejection.
SL below 0.0208.
Scale out profits gradually.
---
⚠️ Bearish Scenario
Confirmation signals:
Daily close below 0.022 with strong volume.
Failed retest (support turns resistance).
Downside targets:
S1 = 0.02080
S2 = 0.01640
Strategy:
Cut longs if breakdown is confirmed.
Aggressive traders may short toward 0.0208 → 0.0164.
---
📑 Entry Checklist
1. Wait for daily close confirmation (not intraday wick).
2. Volume above average.
3. Successful retest (support ↔ resistance flip).
4. RSI divergence or recovery.
5. MACD bullish cross / rising histogram.
6. BTC & overall altcoin sentiment aligned.
---
🛡️ Risk Management
Risk per trade: 1–2% of total capital.
Use SL strictly below 0.0208 for longs.
Move SL to breakeven after TP1.
Accumulation zones often produce false breaks → do not enter without confirmation.
---
🌍 Market Context
Altcoins remain correlated with BTC: a BTC rebound could boost upside potential.
On-chain events (token unlocks, listings, or major news) may drive volatility.
Liquidity is thin → expect high volatility and manage position sizes accordingly.
---
📌 Conclusion
MUBARAK is at a golden zone of decision: a confirmed rejection could spark a +100% rally toward 0.066, while a breakdown would likely drag it back to 0.0208 or even 0.0164.
This is where market makers and big players decide the next major move — patience and risk control are key.
---
#MUBARAK #MUBARAKUSDT #CryptoAnalysis #Altcoins #SupportResistance #BreakoutWatch #RiskManagement

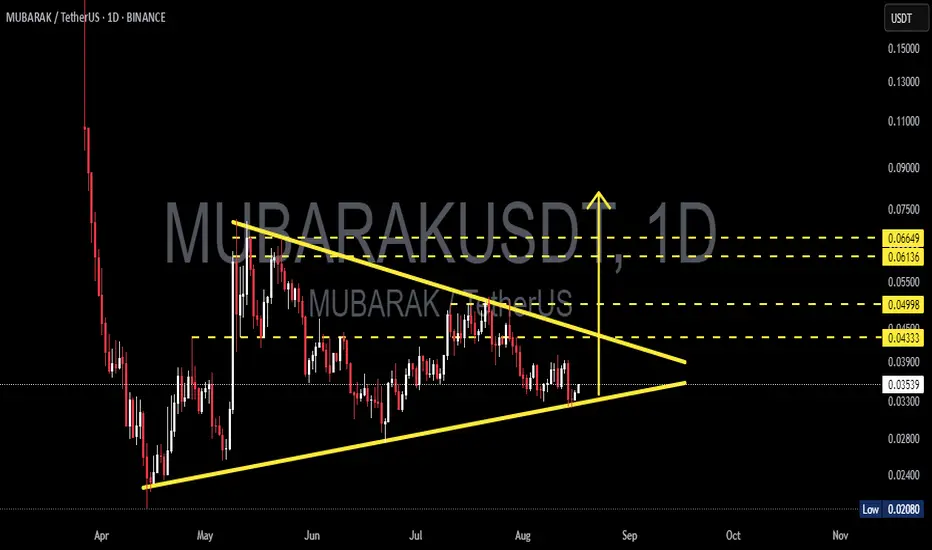
MUBARAKUSDT — Symmetrical Triangle Apex: A Major Move is Coming?🔎 Pattern Analysis
MUBARAKUSDT is currently consolidating inside a Symmetrical Triangle. This structure is formed by a series of lower highs (decreasing selling pressure) and higher lows (increasing buying pressure), showing that the market is coiling up energy for the next decisive move.
👉 As price approaches the apex, volatility tends to shrink, but the probability of a strong breakout increases significantly.
📌 Key Levels
Major support: 0.03531 – 0.03330
Apex zone (neutral area): 0.03900
Resistance levels to watch: 0.04333 – 0.04998 – 0.06136 – 0.06649
Downside supports if breakdown occurs: 0.02800 – 0.02400 – 0.02080 (historical low)
---
🚀 Bullish Scenario
1. Trigger: A daily close above the upper trendline and breakout confirmation above 0.0390.
2. Momentum: If accompanied by strong volume, the breakout could lead to an explosive rally as traders and algorithms enter positions.
3. Upside targets:
🎯 T1: 0.0433 (immediate supply area)
🎯 T2: 0.0500 (psychological & horizontal resistance)
🎯 T3: 0.0613 – 0.0665 (major supply zone & potential FOMO region)
4. Psychological note: A breakout from a symmetrical triangle often triggers short squeezes, accelerating upward momentum.
---
🐻 Bearish Scenario
1. Trigger: A daily close below 0.0333 and breakdown of the rising trendline.
2. Momentum: High selling volume would signal bearish dominance, especially if the broader crypto market sentiment is weak.
3. Downside targets:
🎯 S1: 0.0280
🎯 S2: 0.0240
🎯 S3: 0.0208 (major historical low and last line of buyer defense)
4. Psychological note: Losing 0.0333 could trigger mass stop-loss cascades, adding selling pressure.
---
📖 Pattern Notes
Symmetrical triangles are neutral continuation/consolidation patterns — direction is determined only after a valid breakout.
The longer the consolidation, the stronger the energy stored inside the pattern → usually leading to a powerful breakout.
Until confirmation, traders often use range-trading strategies (buy near lower TL, sell near upper TL) but with increasing whipsaw risks closer to the apex.
---
📌 Conclusion
MUBARAKUSDT is entering a make-or-break zone.
A confirmed breakout above 0.0390 could open the path toward 0.0433 – 0.0665.
A confirmed breakdown below 0.0333 could push price all the way to 0.0208.
⚠️ Always monitor volume and daily close for confirmation — fake breakouts remain a key risk in this type of setup.
#MUBARAKUSDT #MUBARAK #CryptoAnalysis #PriceAction #SymmetricalTriangle #ChartPattern #BreakoutTrading #TechnicalAnalysis #CryptoSetup #RiskManagement
MUBARAKUSDT: Mid-Term Analysis🕌 MUBARAKUSDT Analysis
I think you can find a buyer from the blue box I’ve marked.
📍 Plan
If price comes into the blue box:
✅ Watch for footprint absorption (buyers holding the level)
✅ Look for CDV support or bullish divergence
✅ Wait for structure reclaim to confirm entry
⚡ Reminder
No chasing, no guessing.
If the setup aligns, take the trade with clear risk.
If not, let it go.
Stay patient. The right price, or no trade.
📌I keep my charts clean and simple because I believe clarity leads to better decisions.
📌My approach is built on years of experience and a solid track record. I don’t claim to know it all but I’m confident in my ability to spot high-probability setups.
📌If you would like to learn how to use the heatmap, cumulative volume delta and volume footprint techniques that I use below to determine very accurate demand regions, you can send me a private message. I help anyone who wants it completely free of charge.
🔑I have a long list of my proven technique below:
🎯 ZENUSDT.P: Patience & Profitability | %230 Reaction from the Sniper Entry
🐶 DOGEUSDT.P: Next Move
🎨 RENDERUSDT.P: Opportunity of the Month
💎 ETHUSDT.P: Where to Retrace
🟢 BNBUSDT.P: Potential Surge
📊 BTC Dominance: Reaction Zone
🌊 WAVESUSDT.P: Demand Zone Potential
🟣 UNIUSDT.P: Long-Term Trade
🔵 XRPUSDT.P: Entry Zones
🔗 LINKUSDT.P: Follow The River
📈 BTCUSDT.P: Two Key Demand Zones
🟩 POLUSDT: Bullish Momentum
🌟 PENDLEUSDT.P: Where Opportunity Meets Precision
🔥 BTCUSDT.P: Liquidation of Highly Leveraged Longs
🌊 SOLUSDT.P: SOL's Dip - Your Opportunity
🐸 1000PEPEUSDT.P: Prime Bounce Zone Unlocked
🚀 ETHUSDT.P: Set to Explode - Don't Miss This Game Changer
🤖 IQUSDT: Smart Plan
⚡️ PONDUSDT: A Trade Not Taken Is Better Than a Losing One
💼 STMXUSDT: 2 Buying Areas
🐢 TURBOUSDT: Buy Zones and Buyer Presence
🌍 ICPUSDT.P: Massive Upside Potential | Check the Trade Update For Seeing Results
🟠 IDEXUSDT: Spot Buy Area | %26 Profit if You Trade with MSB
📌 USUALUSDT: Buyers Are Active + %70 Profit in Total
🌟 FORTHUSDT: Sniper Entry +%26 Reaction
🐳 QKCUSDT: Sniper Entry +%57 Reaction
📊 BTC.D: Retest of Key Area Highly Likely
📊 XNOUSDT %80 Reaction with a Simple Blue Box!
📊 BELUSDT Amazing %120 Reaction!
📊 Simple Red Box, Extraordinary Results
📊 TIAUSDT | Still No Buyers—Maintaining a Bearish Outlook
📊 OGNUSDT | One of Today’s Highest Volume Gainers – +32.44%
📊 TRXUSDT - I Do My Thing Again
📊 FLOKIUSDT - +%100 From Blue Box!
📊 SFP/USDT - Perfect Entry %80 Profit!
📊 AAVEUSDT - WE DID IT AGAIN!
I stopped adding to the list because it's kinda tiring to add 5-10 charts in every move but you can check my profile and see that it goes on..

MUBARAK/USDT Ready to Explode? Final Compression Phase?
📊 Complete Technical Analysis – 12H Timeframe (BINANCE)
The MUBARAK/USDT pair is currently in a tight consolidation phase, forming a classic Symmetrical Triangle pattern. This structure indicates mounting pressure from both buyers and sellers, typically leading to a high-volatility breakout once the price escapes the triangle boundaries.
🔺 Pattern: Symmetrical Triangle – Sign of Impending Volatility
Rising Support Trendline (Higher Lows): Shows that buyers are gradually pushing price higher from each dip.
Descending Resistance Trendline (Lower Highs): Sellers are still active, but their strength is weakening over time.
Declining Volume: A healthy consolidation — decreasing volume is a hallmark of triangles before big moves.
Although neutral by nature, in this context, the bullish momentum seems stronger as price holds above key support.
🎯 Key Price Levels:
Price Level Description
0.04811 Breakout zone & first resistance
0.05381 Short-term target post-breakout
0.06000 Psychological resistance and reaction zone
0.06612 Maximum target based on triangle height projection
🟢 Bullish Scenario:
If price successfully breaks above the triangle’s resistance line and closes above 0.0481 USDT with strong volume:
Potential rally toward the 0.053 – 0.066 USDT range.
Triangle projection suggests a move of +50% or more from current levels.
Breakout confirmation: 12H candle close above 0.050 with above-average volume.
📌 Note: A post-breakout retest of the breakout line can offer a second entry opportunity if it holds as new support.
🔴 Bearish Scenario:
If the price breaks below the ascending support line:
Price may drop toward the demand zone between 0.034 – 0.030 USDT.
A deeper correction may target the previous low at 0.0208 USDT.
Watch for fakeouts — low-volume breakdowns may not hold.
🧠 Risk-Reward Strategy:
Aggressive Entry: On strong breakout above 0.048 with rising volume.
Conservative Entry: Wait for breakout confirmation + successful retest.
Stop Loss: Below 0.041 or just under the triangle's lower boundary.
Targets: TP1 at 0.053, TP2 at 0.060, TP3 at 0.066 (max range).
✅ Conclusion:
MUBARAK/USDT is at a critical juncture—a likely breakout from this symmetrical triangle could trigger a significant directional move. Traders should closely monitor volume spikes and candle closures for confirmation. This could be the beginning of a new trend phase for this asset.
#MUBARAKUSDT #CryptoBreakout #SymmetricalTriangle #AltcoinAnalysis #TechnicalSetup #TradingSignals #BullishSetup #BearishRisk #PriceAction

MUBARAK Analysis (12H)Note: This is a risky and highly volatile meme coin.
It appears that the bullish X wave has ended at the point where we placed the red arrow on the chart, and the price has now entered a corrective phase once again. This correction seems to be forming a diagonal pattern, and we are currently in wave F of this structure.
If the price reaches the green zone, we can look for potential buy/long positions.
Targets are marked on the chart, with the main target being the flip zone.
A daily candle closing below the invalidation level would invalidate this view.
For risk management, please don't forget stop loss and capital management
Comment if you have any questions
Thank You

MUBARAK Roadmap (4H)The MUBARAK correction seems to have started from the point where I placed the red arrow on the chart.
The pattern could be a symmetrical, diametric, or expanding triangle. A strong demand zone lies ahead of the price, where we can look for buy/long positions.
Targets are marked on the chart.
A daily candle closing below the invalidation level will invalidate this analysis.
For risk management, please don't forget stop loss and capital management
When we reach the first target, save some profit and then change the stop to entry
Comment if you have any questions
Thank You

MUBARAKUSDT 4H AnalysisMUBARAK ~ 4H Analysis
#MUBARAK High Alert This trade carries a very high risk. Our analysis indicates this is a whale accumulation zone. Buy from here with a short-term target of at least 10%+.

MUBARAK sell/short setup (2H)Given the bearish CH in lower timeframes and the formation of a supply zone, a downward move is expected.
There is a liquidity pool and an order block at the bottom of the chart, and candles are expected to move downward toward this area soon.
The closure of a 4-hour candle above the invalidation level will invalidate this setup.
Do not enter the position without capital management and stop setting
Comment if you have any questions
thank you

Breaking: $MUBARAK Set for Trend Reversal Amidst 20% DipCreated on the Binance Smart chain network (BSC) $MUBARAK a coin that recently underwent a "Community Take Over (CTO)"is set for a trend reversal amidst the recent 20% dip that led the token to a falling wedge pattern.
With the RSI at 47 and momentum brewing, $MUBARAK is set for a massive surge if it should break pass the 38.2% Fibonacci retracement point as momentum kicks in.
Similarly, the 78.6% Fibonnaci price point is holding grounds as the support point should $MUBARAK face a moment of reprieve in the long run.
About Mubarak
CZ just subtly acknowledged that he’s Mubarak – a typical cryptic move from the Binance boss! Those who’ve followed CZ long enough know that when he shills like this, the chances of a Binance listing are sky-high. The Arab world, with their deep pockets, is ready to pump Mubarak to a $1 billion MC. This meme coin has now been taken over by the community, with the CTO pushing it hard – get ready for a big boom!
Mubarak Price Live Data
The live Mubarak price today is $0.128175 USD with a 24-hour trading volume of $316,755,028 USD. Mubarak is down 20.97% in the last 24 hours. The current CoinMarketCap ranking is #284, with a live market cap of $128,174,827 USD. It has a circulating supply of 1,000,000,000 MUBARAK coins and a max. supply of 1,000,000,000 MUBARAK coins.

Is MUBARAK still bullish? (15M)It is one of the meme coins that came to life with CZ's backing.
It has been listed in Binance Futures, and significant trading volume is building up on this meme coin.
After analyzing the chart, we have identified two low-risk rebuy levels, which are marked on the chart.
After entering, due to the high risk of this meme coin, make sure to secure profits (risk-free) at the first target.
A 15-minute candle closing below the invalidation level will invalidate this setup.
For risk management, please don't forget stop loss and capital management
When we reach the first target, save some profit and then change the stop to entry
Comment if you have any questions
Thank You
