Bullish Trend Resumption,Breakout Above Key Resistance in focusM/USDT is continuing its newly formed bullish trend and has already shown strength by pushing above local horizontal resistance.
However, we are looking for a clean and confirmed breakout above $1.5652 to secure a safer entry.
If price breaks and holds above this level with strong confirmation, the next upside target is $1.8149.
For now, patience is key — wait for confirmation and manage risk wisely.
MUSDT

M Sell/Short Setup (4H)Considering the filling of the MUSDT price gap and the reaction to the originating order block, along with the formation of an FVG at the lower part of the chart, we can look for sell/short opportunities.
Targets and stop loss are marked on the chart.
At the first target, secure partial profits and move the stop loss to breakeven.
Do not enter the position without capital management and stop setting
Comment if you have any questions
thank you

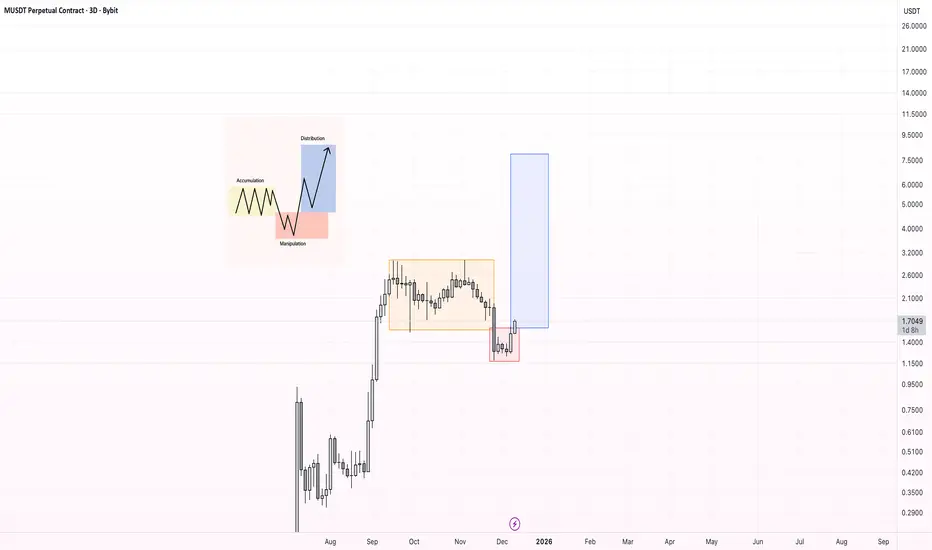
Memecore - AMD Structure | Manipulation, Distribution📊 Market Structure Overview
Memecore is currently respecting a classic AMD (Accumulation → Manipulation → Distribution) structure on the higher timeframe.
🔹 Accumulation
After the impulsive move up, price entered a prolonged range. During this phase, smart money was accumulating positions while retail participation faded and volatility compressed.
🔹 Manipulation (Liquidity Sweep)
Price then performed a clean downside sweep, breaking below the range and triggering:
Stop-losses of late longs
Panic selling
Aggressive short entries on the breakdown
This move effectively reset market positioning, allowing large players to accumulate at discount prices.
🔹 Distribution / Markup
Price quickly reclaimed the range and is now holding above the manipulation low — a strong sign that the breakdown was false.
With ~90% of MEME supply concentrated in a few wallets, upside moves can be fast and violent due to thin liquidity above.
This sets the stage for a strong distribution phase to the upside.
🎯 Price Targets
$2.50 — First expansion target
$5.00 — Mid-term distribution level
$7.00 — Full distribution / macro target
⚠️ Invalidation
A sustained breakdown and close below the manipulation low would invalidate the bullish scenario.
📌 Conclusion
This setup reflects classic Smart Money behavior:
Accumulation → Liquidity grab → Expansion into low-liquidity zones.
As long as price holds structure, higher prices remain the primary scenario.
M - USDT #Update 2Hello everyone ❤️
I hope you are well 😍
💁♂️ The last update we made for the M- USDT cryptocurrency had reached the third target and had fallen close to the fourth target.
After reaching the third target, the price moved up and started falling again. This time, the fourth target was touched and we have experienced a 54% fall so far 🔥🔥🔥🔥
It was not very accurate and did not go as I expected, but the downward trend was well recognized.
💁♂️ It seems that lower targets will also be available
⚠️The analysis may not reach the final target, so at each target, if you make a good profit and see signs of a trend change, you can exit the trade or manage your capital.
⚠️ None of the analysis is a recommendation to buy or sell, but simply my personal opinions on the charts. You can use the charts and choose any that interest you and take a position if you wish.
To support me, I would appreciate it if you boost the analysis and share it with your friends so that I can analyze it with more energy for you, my dears. Thank you all. 💖

MEMECORE/USDT — Range Recovery Forming, Watching Higher levelsMEMECORE has shown a steady rebound from the lower range near $2.00, regaining short-term momentum as it attempts to reclaim the $2.34 zone, which has acted as a strong resistance multiple times.
A confirmed breakout above $2.34 would signal a shift in momentum and open the path toward the range high at $2.53, where the next major liquidity zone sits.
📊 Technical Overview:
Range Support: $2.00
Range Resistance: $2.34
Breakout Target: $2.53
Bias: Neutral → Bullish above $2.34
If MEMECORE continues to hold above the $2.00 base with rising volume, the structure suggests potential for a range breakout and short-term trend reversal.
📈 Outlook: Building strength inside range
🎯 Targets: $2.34 → $2.53

MUSDT long/short IdeaJournal Entry #17
When the markets breaks golden 0.618, i would look for short.
Disclaimer: These charts are for educational purposes only and not financial advice. Trade at your own risk.

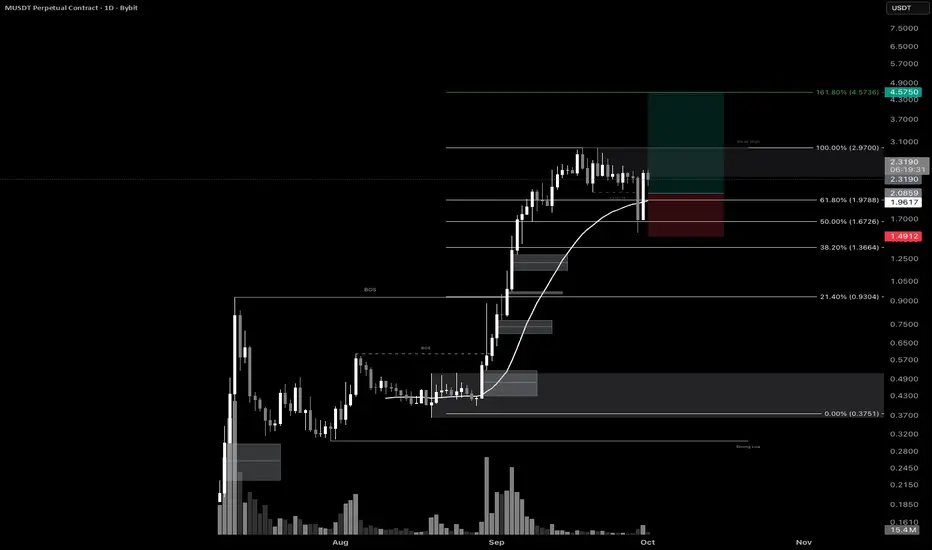
MUSDT – Strong Volume Break & Bullish SetupMUSDT recently experienced a decisive break accompanied by major volume strength, followed by a well-defined 50% retracement. The market showed an excellent reaction from this level, confirming healthy demand and participation.
For optimal entry, waiting for a pullback to the 50% retracement of the engulfing candle could offer an ideal risk-reward setup. The primary target for this trade is the 161.8% Fibonacci extension, aligning with common extension targets.
Watch for sustained volume and confirmation signals—this setup has the potential for a powerful continuation if price respects the calculated retracement zone.
Trade smart and manage risk. Good luck! 🚀
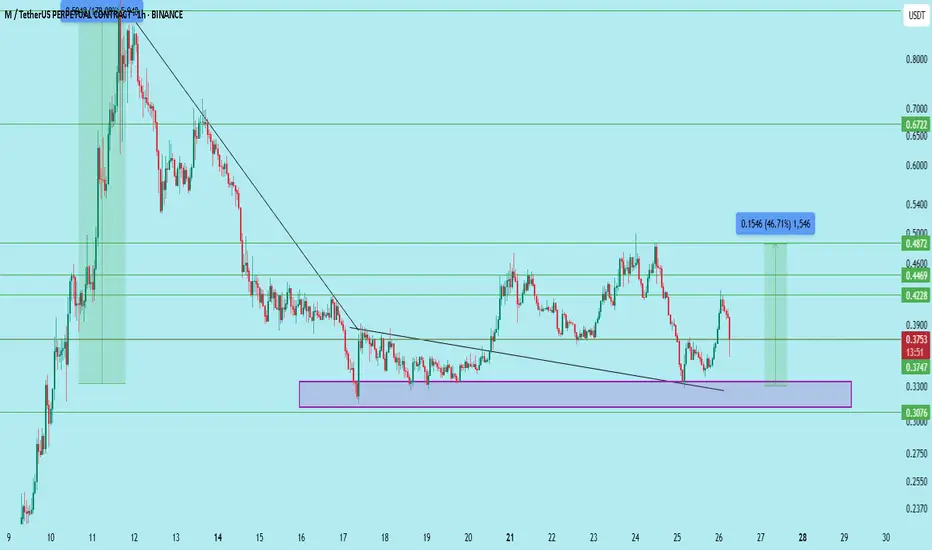
M/USDT — Demand Zone Retest with Strong Risk-Reward$M/USDT is retesting a significant demand zone (0.3210–0.3352) after a breakout and prior rally. This level previously sparked a major impulse move, and price has respected it again on the recent pullback.
Trade Setup
Entry: 0.330–0.345 (highlighted rectangle)
Stop Loss: Below 0.3076
Targets: 0.3747, 0.4228, 0.4469, 0.4872
Long-term Target: 0.6772
Structure
The setup offers nearly 46% upside to the first target and 100%+ to the long-term level. Retest and hold of the demand zone confirms bullish strength with a clean invalidation below 0.3076.
DYOR | Not Financial Advice
MEMECORE Could Break Back Above Support? – Eyes on 0.56 Target📊🔥 MEMECORE Could Break Back Above Support? – Eyes on 0.56 Target 💥🟢
I’ve been trading (went short nicely, thank you) in on $MEMCOR lately — and it’s been paying off. After charting these Fibonacci levels few days ago, we’ve seen price action respect them beautifully. Today’s move back above the key support zone around 0.455 signals strength, especially after a clean bounce and a shift in momentum on the 15-minute chart. 🧠📈
I’m currently in a long position with my stop loss tight at 0.44 — not risking the house here. The chart is offering a possible relief move into the 0.56 zone, which aligns perfectly with one of the higher fib retracement levels and prior structural resistance.
🟢 Trade Plan:
Entry: Long now, shorts closed
Stop Loss: 0.44
Target: 0.56
Risk-Reward: Smart & balanced — letting the fibs guide the way.
The sharp selloff seems to be losing steam, and if bulls can hold above this golden zone, the bounce could be solid. Watching for follow-through volume to confirm the setup. Let’s see how this plays out. 🔍🚀
One Love,
The FXPROFESSOR 💙
Disclosure: I am happy to be part of the Trade Nation's Influencer program and receive a monthly fee for using their TradingView charts in my analysis. Awesome broker, where the trader really comes first! 🌟🤝📈
