TSLA Catalysts Ranking | Q1 2026 Update | by ProjectSyndicateTSLA: Updated Outlook Jan 2026 — Catalyst Memo
Updated Catalyst Scorecard Ranked by Impact
1 🤖 Autonomous and Robotaxi Execution — 9.4
2 🧱 Energy AI and Optimus Optionality — 9.0
3 🏭 EV Demand and Geographic Mix — 7.8
4 🧮 Battery Cost and Margin Levers — 7.6
5 🗃️ Affordable Model and Next Gen Platform — 7.4
6 ⛓️ Competition and Global Share — 6.7
7 🧭 Macro Trade and Policy — 6.6
8 📉 Rates and Credit Conditions — 6.1
9 🧾 US EV Incentives and Pull Forward — 5.2
10 🧪 Commodities and Inputs — 5.1
11 🛡️ Safety Regulatory and Governance Risk — 8.2 risk flag
________________________________________
Primary Catalyst Stack Updated Scores
🤖 1 Autonomous and Robotaxi Execution — 9.4 out of 10 up
• What changed: Market reporting indicates robotaxi operations in Austin have progressed toward a less supervised operating format, strengthening the commercialization timeline signal.
• Key upside path: Expansion to additional geographies, measurable safety performance, and a clearer unit economics narrative.
• Primary risk: Regulatory intervention, operating restrictions, or a high profile incident that forces program throttling.
• Why higher: This is the clearest pathway to a structural multiple reset and remains the dominant driver of incremental investor positioning.
________________________________________
🧱 2 Energy AI and Optimus Optionality — 9.0 out of 10 up
• What changed: Energy storage deployments remain the most consistently constructive datapoint with rising investor focus on backlog visibility and margin trajectory.
• Key upside path: Sustained deployments growth plus improving profitability, positioning Energy as a second earnings engine rather than a cyclical adjunct.
• Primary risk: Supply chain constraints, project timing volatility, margin normalization if pricing tightens.
• Why higher: Energy plus AI infrastructure adjacency continues to expand the non auto terminal value narrative.
________________________________________
🏭 3 EV Demand and Geographic Mix — 7.8 out of 10 down
• What changed: Deliveries momentum has moderated versus prior year comps, with mix and regional pricing pressure remaining central to earnings power.
• Key upside path: Stabilization in core regions through product refresh cadence, financing support, and disciplined pricing.
• Primary risk: Extended price competition in China and Europe, weaker affordability, inventory driven discounting.
________________________________________
🧮 4 Battery Cost and Margin Levers — 7.6 out of 10 down
• What changed: Margin sensitivity remains elevated given pricing actions, mix shift, and fixed cost absorption.
• Key upside path: Lower bill of materials, manufacturing efficiencies, software attach, and Energy margin expansion.
• Primary risk: Further auto gross margin compression or inability to offset pricing with cost improvements.
________________________________________
🗃️ 5 Affordable Model and Next Gen Platform — 7.4 out of 10 flat
• What changed: The market continues to discount timing uncertainty. Without a defined ramp window, this remains a medium term catalyst rather than a near term driver.
• Key upside path: Clear launch timeline plus credible capacity plan that expands the addressable market.
• Primary risk: Execution delay, demand cannibalization, margin tradeoffs.
________________________________________
🧾 6 US EV Incentives and Pull Forward Dynamics — 5.2 out of 10 down
• What changed: Incentive support is structurally less constructive into 2026, increasing reliance on pricing, financing, and product cadence to drive volume.
• Key upside path: Stronger than expected natural demand, creative financing solutions, improved affordability.
• Primary risk: Air pocket in demand as incentive effects roll off.
________________________________________
📉 7 Rates and Credit Conditions — 6.1 out of 10 flat
• What changed: Financing conditions remain a meaningful second order driver for payment sensitive buyers.
• Key upside path: Easier financing plus improved consumer confidence.
• Primary risk: Sticky rates or tighter underwriting standards.
________________________________________
🧭 8 Macro Trade and Policy — 6.6 out of 10 up
• What changed: Policy remains a swing factor affecting both demand and cost corridors, with tariff and regulatory narratives capable of repricing risk quickly.
• Key upside path: Stable policy environment with limited new frictions.
• Primary risk: Adverse trade moves, tightening regulatory posture, or geopolitical disruptions.
________________________________________
⛓️ 9 Competition and Global Share — 6.7 out of 10 flat
• What changed: Competitive intensity remains high, particularly where local OEMs can compress price points.
• Key upside path: Product refresh leadership plus software differentiation.
• Primary risk: Sustained price war and commoditization pressure.
________________________________________
🛡️ 10 Safety Regulatory and Governance Risk — 8.2 out of 10 risk flag up
• What changed: Autonomy scrutiny remains an active overhang that can change the timeline overnight.
• Key downside path: Restrictions, remedies, reporting burdens, or reputational hits that slow adoption.
• Why elevated: This is the primary left tail against the autonomy bull case.
________________________________________
🧪 11 Commodities and Inputs — 5.1 out of 10 flat
• What changed: Input costs matter, but are not the gating item relative to demand, pricing, and autonomy timelines.
• Key upside path: Lower raw materials supporting margin.
• Primary risk: Sudden spikes that compress profitability.
________________________________________
________________________________________
Analyst positioning and targets
Street posture remains broadly balanced with dispersion widening between autonomy bulls and auto fundamental bears. Into the next earnings cycle, revisions risk is skewed toward fundamentals while multiple sensitivity remains skewed toward autonomy milestones and regulatory developments.
________________________________________
Headlines and tape drivers
• 🤖 Robotaxi commercialization signaling has strengthened
• 🧱 Energy deployments remain a key positive differentiator
• 🛡️ Regulatory scrutiny remains the principal headline risk
• 🧾 Incentive fade increases reliance on pricing and financing levers
________________________________________
Levels and structure
• 🧊 Support zones 405 to 415 then 380 to 395 then 330 to 350
• 🪨 Resistance zones 450 then 475 to 510 then 600
________________________________________
Next 60 to 90 days watch list
1 🤖 Robotaxi expansion pace, operating design, and safety metrics
2 🛡️ Regulatory milestones and any mandated remedies
3 🧱 Energy profitability commentary and backlog visibility
4 🏭 Pricing actions and demand elasticity post incentive fade
Musk

My upside targets for TESLAWe are finishing the 'handle' phase of a year-long setup of the Cup and handle.
All this taking place above the Brimline of the large cup and handle pattern.
We already identified The head and shoulders drop from 2021
The #HVF that took us to Target at $490 in December 2024.
We advised not to be sucked in to the doom and gloom.
during peak #Swastikar outrage and dealership vandalism.
If #TSLA clears $500 with volume, we aren't just looking at a new high—we are looking at a structural re-rating of this company.
🚀 Target 1: $503 (Short-Term Breakout)
The Logic: A high-volume break above the $490 resistance (post-robotaxi pop zone) would confirm the "handle" breakout.
Why it hits: Bullish momentum from year-end delivery updates and the Dovish Fed tone are currently providing the necessary liquidity.
🎯 Target 2: $600 (The "Ives" Consensus)
Widely considered the "mid-term" bull target for 2026, popularized by Wedbush analyst Dan Ives.
The Logic: This targets a roughly 100% gain from the projected 2026 lows.
The Catalyst: This hinges on the successful production start of the Cybercab in April 2026 and the initial commercialisation of the Optimus robot.
🏆 Target 3: $800 - $1,200 (The "AI Chapter" Re-Rating)
This target assumes Tesla is valued as an AI/Robotics powerhouse rather than a car company.
The Logic: Bullish algorithmic projections from sources like StockScan place #TSLA at $1,213 by the end of 2026 if Full Self-Driving (FSD) reaches mass adoption.
The Catalyst: Reaching a $2 Trillion to $3 Trillion market cap as the "AI Chapter" finally takes hold in the company's revenue mix.
🌌 Target 4: $2,000+ (The "ARK" Moonshot)
This is the long-term "blue-sky" target for 2027–2030, most famously championed by Cathie Wood's ARK Invest.
The Logic: Based on a $2,600 per share model, this target assumes the Robotaxi network reaches total global dominance.
The Catalyst: Tesla’s energy storage and software services segments must grow to become the dominant share of revenue, requiring net income to jump from ~$5 billion to $50 billion by 2030.
All these stages are backed by the projected moves of the #HVF @TheCryptoSniper and the two Cup and handle patterns.

Kekius Maximus: Bullish Falling Wedge + Squeezed VolatilityKekius Maximus has been consolidating inside a falling wedge, which is typically a bullish reversal pattern. Volatility has been tightening heavily, and price is now approaching the apex — meaning a breakout is becoming increasingly likely.
At this point, all we need is a tweet from Elon Musk to ignite another meme-driven bullish wave. The setup looks primed for a strong impulsive move once buyers step in.
My upside targets:
➡️ $0.02
➡️ $0.05
As long as the wedge structure holds and price continues to build pressure, the probability of an upward breakout remains high.

DOGEUSDT /// 30NOVThe sharp market decline on Friday, October 10th led to a significant drop of approximately 63% in Dogecoin. Currently, the market is retracing part of that daily candle. Price is trading around $0.15, and selling pressure has notably decreased; however, there is still no clear presence of strong buyers to support a sustained upward move.
For Dogecoin to potentially enter a strong bullish phase, price would need to show a sharp reaction and visible inflow of capital around the $0.11 area. A plausible scenario is that the market may reach this level either through another downward leg or after a short-term move toward the $0.18 zone, where it could face renewed selling pressure and move back down toward $0.11.
Overall, price may continue to range between $0.11 and $0.24 for several months. At the moment, there is no technical evidence on this chart suggesting a sharp rally toward the $1 level.

TSLA Catalysts Ranking: Q1 2026 Outlook PT 600 USD________________________________________
TSLA: Updated Outlook (Nov-2025)
Here's an updated/revised outlook for TSLA including all the primary
catalyst ranking and analyst ratings and overview of latest developments
this was updated for Q1 2026 with all the viable market data.
________________________________________
🤖 1) Autonomous & Robotaxi Execution — 9.2/10 (↑)
• What changed: Tesla’s invite-only Austin robotaxi pilot kept running through the summer; Tesla also says it launched a Bay Area ride-hailing service using Robotaxi tech (Q3 deck). FSD v14 (Supervised) began rolling out in Oct with broader model upgrades; Tesla claims billions of supervised miles and AI training capacity lifted to ~81k H100-equivalents.
• Offsetting risk: NHTSA opened a fresh probe (Oct-2025) into ~2.9M Teslas over traffic-safety violations when using FSD; investigation cites 58 reports incl. crashes/injuries.
• Why the bump: Real pilots in two metros + visible AI scale-up keep autonomy the center of the bull case—even with elevated regulatory risk.
________________________________________
🌍 2) EV Demand & Geographic Mix — 8.6/10 (↘ )
• What changed: Q3-25 delivered record vehicles and record energy storage deployments, with record revenue and near-record free cash flow. Still, we’re past the U.S. tax-credit pull-forward and China/Europe pricing remains competitive.
• Read-through: Momentum into Q4 looks better than 1H-25, but regional price discipline and mix will matter.
________________________________________
💸 3) U.S. EV Tax Credits & Incentives — 6.0/10 (↘)
• What changed: Federal new/used EV credits ended for vehicles acquired after Sept 30, 2025 under OBBB. Buyers can still qualify if a binding contract + payment was made by 9/30 and the car is placed in service later (“time-of-sale” reporting). This creates a limited after-deadline tail into late ’25/early ’26 but the program has sunset for new acquisitions.
• Implication: Pull-forward demand helped Q3; near-term becomes tougher without the credit.
________________________________________
📉 4) Rates & Credit Conditions — 6.5/10 (↔)
• Rate-cut expectations have eased financing costs M/M, but absolute affordability still binds EV uptake. (Macro-sensitive; no single decisive print.)
________________________________________
🎯 5) Affordable Model / Next-Gen Platform — 8.0/10 (↔)
• Q3 deck emphasized Model 3/Y “Standard” variants to expand entry price points; true next-gen remains staged, with execution risk.
________________________________________
🔋 6) Battery Cost & Margin Levers — 8.3/10 (↑)
• What changed: Q3 total GAAP GM improved vs 1H; energy revenue +44% YoY; free cash flow ~$4.0B. Scale/learning and supply-chain localization called out.
________________________________________
⚡ 7) Energy, AI & Optimus Optionality — 8.7/10 (↑)
• Record storage deployments, Megapack 3 / Megablock unveiled; expanding AI inference/training and a U.S. semi-conductor deal noted. This is the clearest re-rating vector beyond autos.
________________________________________
🛡️ 8) Safety, Regulatory & Governance Risk — 7.5/10 (risk) (↑ risk)
• New NHTSA probe into FSD reporting/behavior escalates headline risk; audit scrutiny persists. Interpret higher score here as more material risk to multiple.
________________________________________
🚩 9) Competition & Global Share — 6.2/10 (↔)
• Competitive intensity in China/EU remains high; Q3 execution improved but pricing power still contested.
________________________________________
🌐 10) Macro & Trade/Policy — 6.5/10 (↑)
• Policy shifts (e.g., OBBB tax-credit sunset; tariff/trade uncertainty) remain a swing factor for cost & demand corridors.
________________________________________
✅ 11) Commodities/Inputs — 5.5/10 (↔)
• Mixed moves across lithium/nickel; no single driver eclipses execution/AI narrative near term.
________________________________________
Updated Catalyst Scorecard (ranked by impact)
1. Autonomous & Robotaxi Execution — 9.2
2. Energy, AI & Optimus Optionality — 8.7
3. EV Demand & Geographic Mix — 8.6
4. Battery Cost & Margin Levers — 8.3
5. Affordable Model / Next-Gen — 8.0
6. U.S. EV Incentives — 6.0
7. Rates & Credit — 6.5
8. Macro/Trade — 6.5
9. Competition/Share — 6.2
10. Safety/Reg/Gov Risk — 7.5 (risk flag)
11. Commodities — 5.5
(Key Q3 facts from Tesla’s deck; probe/tax-credit items from NHTSA/IRS reporting.)
________________________________________
📊 Analyst Rankings & Price Targets
• Street consensus (near-term 12-mo): ~$391 average target; consensus rating: Hold across ~46 firms.
• Bull camp: Wedbush (Dan Ives) $600 PT (reiterated Nov-5; Street-high; thesis = embodied-AI/robotics optionality + robotaxi). Benchmark $475 Buy (post-Q3).
• Cautious/negative: UBS $247 Sell (raised from $215 but still bearish on deliveries/margins).
• Tape-check from Tesla: Q3-25 revenue $28.1B, non-GAAP EPS $0.50, record FCF, record deliveries & storage. (EPS miss vs some expectations; revenue beat.)
________________________________________
🔍 Headlines that moved the needle
• NHTSA opens new FSD probe (scope ~2.9M vehicles).
• FSD v14 (Supervised) broad rollout; AI capacity to ~81k H100-eq; Bay Area robotaxi ride-hailing noted (Q3 deck).
• OBBB EV tax credits sunset 9/30/25; binding-contract/time-of-sale guidance enables limited post-deadline claims.
• Q3 print: record deliveries, record energy storage, record FCF; EPS light vs some models but narrative shifts to AI/energy.
________________________________________
🧭 Technicals: Levels & Structure (weekly focus)
Primary structure: since late-2022, TSLA’s traded inside a contracting wedge, with noteworthy compression into 2H-2025—typical of late-stage accumulation before a decisive break. Momentum divergences are improving on weekly frames even as price consolidates.
________________________________________
Key levels (spot-agnostic):
• Support: $360–$370 (prior breakdown area/weekly shelf); $330–$345 (multi-touch base/pivot); $310–$320 (cycle risk zone).
• Resistance: $405–$420 (range top & supply), $450–$475 (post-robotaxi pop zone / analyst PT cluster), $500 (psych), then $600–$650 (LT measured target band).
• Roadmap Expect one more downside probe into $310–$320 in Q1-2026 to complete the wedge, then trend break and resume bull leg toward $600/$650 over the subsequent cycle (≈ ~100% off the projected low).
• Risk markers: sustained weekly closes < $305 would postpone the “final low” timing and force a re-mark to the 200-week MA cluster; weekly closes > $475 accelerate the upside timing toward the $500/$600 handles.
________________________________________
Cases unchanged framework
• Bull: Robotaxi expands to more metros, regulators settle into a supervised-AV regime, energy/AI scale continues; market re-rates to $475–$600 (Benchmark/Wedbush anchors).
• Base: Solid execution across autos + energy, FCF stays healthy, autonomy rolls out cautiously under oversight; stock tracks Street $350–$400 band.
• Bear: Delivery softness post-credit-sunset, tougher pricing in China/EU, or adverse NHTSA actions; retest of $300–$330 zone before trend resolution.
________________________________________
What to watch next (60–90 days)
1. NHTSA probe path and any software/recall remedies.
2. Robotaxi geographic expansion cadence and any shift from safety-monitor to remote-assist ops.
3. Energy bookings & Megapack 3/Megablock ramp against utility RFP calendars.
4. Delivery run-rate post-credit sunset and mix of Standard trims.
________________________________________

$TSLA - Reaching $1050 in 2026 is NOT a Dream!I can't ignore how bullish Tesla stocks chart looks right now. A massive ascending triangle with horizontal resistance ($430) was broken upwards and currently the price is consolidating above it, the resistance also perfectly correlates with the 0.786 lvl by Fibo.
Taking into account the overall company's plan regarding its growth (talking about recent news that 75% of shareholders voted in favour of a compensation plan that could award Musk up to $1T in stock if Tesla could achieve $8.5T market capitalization) , we can easily expect NASDAQ:TSLA to reach point 1 by Fibo ($1050 mark) .
By the way, by pointing out to the news about providing $1T, I don't mean that Tesla could really achieve $8.5T market capitalization any time soon, if only in 10 years as the overall money supply is drastically increasing. This news highlights the plan, in other words - creative way of sharing what is their "plan maximum" in terms of 10 years.
I believe Tesla will cost $2T in 2026.

Tesla Stock Wobbles as Profit Dives 37%, Revenue Pops. Now What?Tesla NASDAQ:TSLA posted a 12% jump in revenue on Wednesday, reaching $28.1 billion, well above Wall Street’s $26.37 billion estimate. And yet, the stock slipped nearly 1% on the day before paring back that loss with a 2.3% Thursday gain.
Why? Because profits fell faster than Cybertruck’s reputation — a 37% plunge year over year, with adjusted earnings per share at 50 cents versus the expected 54 cents.
It’s a classic Tesla paradox: sales are booming, but margins are thinning, and Wall Street can’t decide whether to cheer the top line or cry over the bottom one.
🏎️ The Cost of Staying in the Fast Lane
Tesla’s secret sauce has always been scale — crank out more cars, dominate market share, and let profits follow. But this quarter, the recipe’s a bit off. Automotive revenue rose 6% to $21.2 billion, yet net income plunged to $1.37 billion from $2.17 billion a year earlier .
What happened? Price cuts. Lots of them. Musk has been slashing sticker prices across markets to stay ahead in the EV race — great for consumers, painful for margins. Add a 50% spike in operating expenses (thanks, humanoid robots and AI labs), and suddenly that sleek electric machine looks a lot less money-making.
Still, Tesla’s revenue growth means one thing: demand isn’t dead. The EV slowdown hasn’t reached Palo Alto yet.
💰 Bitcoin Bounces
In a crypto-centric subplot, the company made $62 million from its Bitcoin BITSTAMP:BTCUSD stash last quarter.
The crypto’s 5% rise — ending the quarter around $114,000 — gave Tesla’s treasury a nice digital cushion. The company held roughly 11,000 Bitcoins during the three months through September.
🧠 The $1 Trillion Question
And then there’s the other storyline — the Elon Musk Show. Musk wrapped up the earnings call by pivoting from profits to power. Specifically, his proposed $1 trillion pay package , which he insists isn’t “compensation” at all but a question of “control.”
“I just don’t feel comfortable building a robot army here and then being ousted because of some asinine recommendations from ISS and Glass Lewis,” Musk quipped, slamming the proxy firms as “corporate terrorists.”
His plan is to secure roughly mid-20s voting power to keep Tesla’s destiny firmly in his hands while still, as he puts it, being “fireable if I go insane.”
If approved, Musk’s stake could surge from 13% to nearly 29%, giving him the leverage he says he needs to push Tesla toward an $8.5 trillion valuation — complete with robotaxis, humanoid bots, and up to 12 million cars sold annually.
🧾 The Takeaway
The stock is up roughly 16% in 2025, clawing back some early-year losses, but it still lags the Nasdaq Composite NASDAQ:IXIC and other mega-cap peers like Nvidia NASDAQ:NVDA and Meta $META.
The near-term question is simple: can Tesla tighten costs without killing growth? The long-term one is bigger: can Elon Musk lead the company into its next chapter without turning every quarter into a cliffhanger?
That said, the earnings season continues and the next batch of big tech heavyweights is right around the corner.
Off to you : What’s your take on Tesla and Musk’s lofty vision north of $1 trillion? Share your thoughts in the comments!

VINE COMING BACK WITH NEW ROUND.. ----> $0,15 +Vine appears to be making a comeback, with $0.15 as a potential target if the trend confirms support in this zone. We will provide further updates as new time frames develop
We follow to see if it's able to get confirmed.

Tesla High Risk of $255Tesla is Stuck under $430 ATH resistance and at high risk of falling back to $255 support.
Tesla is no longer growing and Musk is polarizing and alienating their mostly progressive leaning customer base. This stock simply makes zero sense for a 200 pe ratio.

Cup & HANDLE + Mini Double Bottom: $TSLA to $610 ScenarioI maintain a bullish stance on Tesla ( NASDAQ:TSLA ), supported by a compelling combination of technical patterns and strong fundamental drivers. The current chart setup reveals a Cup and Handle formation complemented by a Mini Double Bottom, both of which are classic bullish continuation patterns. These suggest a potential breakout scenario that could drive NASDAQ:TSLA to $610 by year-end.
Technical Roadmap:
Gap Fill to $408: Anticipated earnings momentum, particularly from the Robotaxi segment, is likely to propel the stock to fill the previous gap at $408.
Consolidation at $450: Following the gap fill, I expect a consolidation phase forming a “box” around the $450 level.
Breakout to $610: A decisive breakout above $450 could trigger a strong rally toward the $610 target.
***Current Key Catalysts Supporting the Bullish Thesis:
Robotaxi Expansion: Tesla’s autonomous driving initiative is gaining traction, with Robotaxi developments expected to significantly boost revenue and margins.
India Market Entry: Tesla’s upcoming launch in India opens access to one of the world’s largest and fastest-growing EV markets.
In-House Chip Development & Dojo 2 Expansion: Continued investment in AI infrastructure and custom silicon enhances Tesla’s competitive edge in autonomy and robotics.
Tesla Diner Launch: The near-completion of Tesla’s themed diner adds to brand visibility and customer engagement.
Global EV Adoption: Tesla continues to benefit from rising EV demand across multiple international markets.
Optimus Robot Hype: Growing interest in Tesla’s humanoid robot project could unlock new revenue streams and investor enthusiasm.
Favorable Macro Trends: A declining interest rate environment supports higher valuations for growth stocks like Tesla.
Institutional Accumulation: Recent trading activity suggests that institutional investors are accumulating shares within the current range.
Grok AI Integration: The integration of Grok AI into Tesla vehicles could enhance user experience and differentiate Tesla’s infotainment ecosystem.
Investment Strategy:
I recommend initiating or increasing exposure to NASDAQ:TSLL (leveraged Tesla ETF) ahead of the upcoming earnings report. This could offer amplified returns if the bullish scenario plays out. Consider accumulating further on any dips, particularly during the consolidation phase around $450.
BUY NOW NASDAQ:TSLA NASDAQ:TSLL

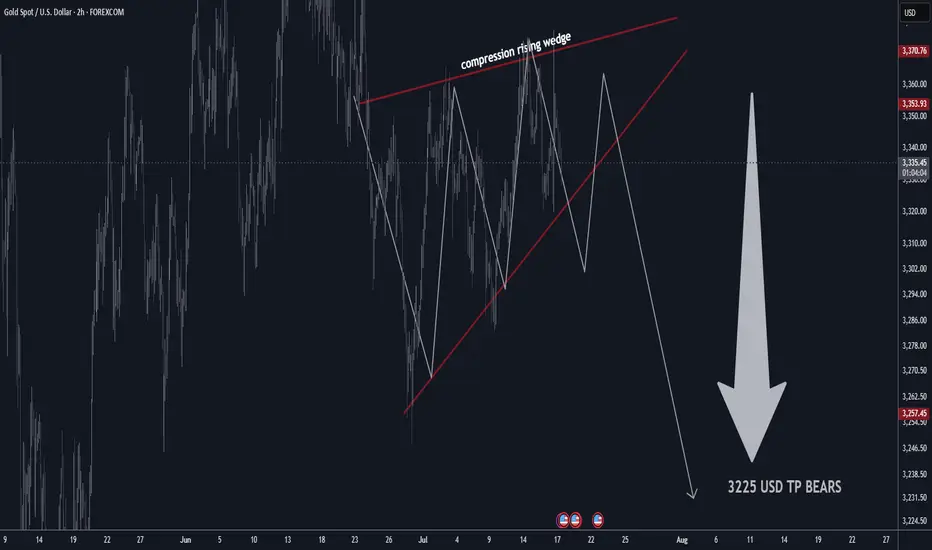
GOLD H2 Rising Wedge Expecting SellOFF TP BEARS 3225 USD📊 Gold Technical Outlook Update – H4 & 2H Chart
📰 Latest Summary Headlines
• Gold stalls near highs as technical compression signals possible breakdown
• Bearish rising wedge on 2-hour chart hints at sharp move lower
• Market volatility stays elevated amid global economic risks
• Short-term sellers targeting $3,225 if wedge pattern breaks
________________________________________
🏆 Market Overview
• Gold remains in a choppy range, struggling to clear key resistance.
• 2H Chart: Bearish rising wedge pattern identified, showing compression—expecting a potential breakdown soon.
• Overhead resistances: $3,410 / $3,460 USD will likely cap further upside.
• Major supports: $3,160 / $3,240 USD.
• If support fails, next key bear target is $3,225 USD.
• Range trading remains favored for now.
• Volatility likely to persist with no major bullish headlines on the horizon.
________________________________________
⭐️ Recommended Trade Strategy
• Bearish Setup (2H): Short sell gold at market on wedge breakdown.
o Stop loss: Above recent highs (set according to your risk tolerance and latest 2H swing high).
o Take profit: Target $3,225 USD.
• Continue to focus on selling near resistance, buying near support.
• Momentum: Watch for sharp moves as wedge resolves—be nimble!
• Always manage risk and adjust stop as price develops.
________________________________________
💡 Gold Market Highlights
• Safe-haven demand still strong due to tariffs, geopolitical tension, and U.S. fiscal concerns.
• Central banks & investors remain net buyers, but jewelry demand slides at high prices.
• Price action is dominated by institutional flows, with banks forecasting potential for gold above $4,000 next year—but short-term correction likely if wedge breaks.
• Current price: ~$3,358 per ounce. Compression suggests a larger move coming soon.
________________________________________
Summary:
Gold is at a crossroads, with a bearish wedge pattern building on the 2-hour chart. A breakdown could see a quick move to $3,225. Short sellers should act on confirmation, while bulls will look to reload at key support. Stay tactical!
TSLA bearish: Musk vs Trump! Subsidy Spotlight & Sentiment RisksIf you haven`t bought TSLA before the recent breakout:
Now you need to know that Tesla (TSLA) is sitting around $315, but the vibe is getting shakier. Elon Musk’s feud with Donald Trump — complete with jokes about “putting the DOGE on him” if deported — might feel like another meme moment, but it spotlights Tesla’s huge dependency on federal and state support.
Estimates show Tesla could face up to $48 billion in lost government contracts and incentives over the next decade if the political tide turns. With Trump’s base calling out “green subsidies” as wasteful, Tesla’s funding pipeline could get squeezed — just as competition ramps up and margins get tighter.
Key Bearish Points
1) Political Risk Is Real
Musk’s public fight with Trump is a double-edged sword: he risks losing goodwill on both sides of the aisle. If the next administration decides to gut EV credits, Tesla could take a huge hit — far more than its rivals who rely less on U.S. incentives.
2) Subsidy Dependence
Tesla’s success is partly built on a foundation of tax credits, carbon credits, and favorable policies. $48B in potential lost value is nothing to shrug off — especially when competitors like BYD are gaining ground.
3) Bearish Technical Setup
TSLA’s chart is rolling over inside a bearish channel. It recently failed to hold the $330 level and now sits around $315. A clean breakdown below $300 could open the door to your target zone at $262 — a major support area from earlier this year.
Catalysts:
Any new comments from Trump’s camp about EV subsidies
Weak delivery/margin numbers from Tesla
Broader tech/equity pullback
Musk’s crypto distractions no longer propping up sentiment
Disclosure: I am part of Trade Nation's Influencer program and receive a monthly fee for using their TradingView charts in my analysis.

The Trump & Musk Friends Again - Tesla RippingAnalysts attribute the recovery to cooling tensions between Elon Musk and President Donald Trump, which had previously weighed on investor sentiment.
Additionally, Tesla's upcoming robo-taxi launch on June 12 is generating excitement, with some analysts predicting it could be a major revenue driver. However, concerns remain about Tesla's valuation, as it trades at a price-to-earnings ratio of 192, significantly higher than traditional automakers.

$TSLA - Time to BUY (F to sellers)When weak hands sell in fear, we proudly buy.
Tesla is at the perfect spot for buying right now, both from fundamental and technical sides. The recent fight between Elon & Trump granted so much needed correction to the chart. The price is resting on the $260 - $280 support now - ideal spot for buying before the massive blast off will happen.
A few technical factors: there is a HUGE ascending triangle with horizontal resistance ($415), the 3rd approach of this resistance should be final before the breakout happens! Moreover, the price is steadily forming a bullish pennant that will help in breaking the resistance up.
The overall trend is strictly bullish according to Fibo. The target of this upward movement is located in the $900 - $1000 zone which is x4 from current points. Not very often in our century you get such an opportunity.
You may have different opinions about Elon Musk, but you can't deny the fact he is brilliant businessman and entrepreneur. You can already see that "Tesla owners are scrambling to remove their anti Elon stickers from their car now that he is feuding with Trump" . Elon is a good-guy for liberals again, while republicans didn't change their positive attire regarding his company as well.
I tend to believe that all those news we witnessed yesterday (mean Elon&Trump fight) was just a part of a bigger plan , the outcome of which we will see later this year or even next year.

TSLA SellOff ! Elon Musk vs Donald Trump ! Beginning of the End?If you haven`t bought the dip on TSLA:
Now you need to know that TSLA Tesla experienced a significant drop of 14% today, marking its worst single-day performance in over four years. This decline erased approximately $150 billion in market capitalization, bringing the stock down to $284.70.
The immediate cause of this downturn is the escalating feud between CEO Elon Musk and President Donald Trump. Musk's public criticism of Trump's tax legislation, labeling it a "repugnant abomination," prompted Trump to threaten the revocation of government contracts with Musk's companies. This political clash has introduced significant uncertainty regarding Tesla's future government support.
Beyond the political arena, Tesla's core business metrics are showing signs of strain. The company reported a 9% decline in quarterly revenues and a staggering 71% drop in profits. Additionally, Tesla has lost its leadership position in the electric vehicle market to China's BYD, indicating increased competitive pressure.
cincodias.elpais.com
Investor sentiment is also waning. A Morgan Stanley survey revealed that 85% of investors believe Musk's political activities are negatively impacting Tesla's business fundamentals. This perception is further exacerbated by declining sales in key markets, such as a 17% drop in Model Y registrations in California.
thestreet.com
Elon Musk and Donald Trump have publicly clashed, escalating a feud that has unraveled their once-close relationship. The dispute centers on several issues:
Republican Tax and Immigration Bill: Musk criticized a sweeping Republican domestic policy bill backed by Trump, calling it a "disgusting abomination" on X. Trump claimed Musk initially had no issue with the bill, accusing him of being upset over the removal of an electric vehicle tax credit.
Epstein Files Allegation: Musk alleged Trump's name appears in classified Jeffrey Epstein files, escalating tensions. Trump has not directly addressed this claim but responded by threatening to cut government contracts with Musk's companies.
Personal and Financial Accusations: Musk argued Trump would have lost the 2024 election without his financial support, accusing him of ingratitude. Trump countered, saying he was "disappointed" in Musk, claiming he asked Musk to leave the administration and accused him of "Trump Derangement Syndrome."
Government Contracts and Tariffs: Trump threatened to cancel "billions and billions" in government contracts with Musk's companies, like SpaceX, amid the feud. Separately, Musk reportedly made personal appeals to Trump on auto tariffs, which Trump noted might involve a conflict of interest.
Cabinet Clash: Reports indicate Musk clashed with Trump’s cabinet, including Marco Rubio, over spending cuts related to the Department of Government Efficiency (DOGE), with some describing Musk's behavior as disruptive.
Given these challenges, a price target of $215 for TSLA appears justified. The combination of political entanglements, deteriorating financial performance, and eroding investor confidence suggests that Tesla's stock may face continued downward pressure in the near term.
Disclosure: I am part of Trade Nation's Influencer program and receive a monthly fee for using their TradingView charts in my analysis.

Elon Musk vs Trump: Who you betting on?Elon Musk and Donald Trump have recently had a public falling-out, with their feud playing out on social media and in political circles.
The dispute seems to have started over Trump's new budget bill, which Musk has criticized for increasing the national debt. Trump, in turn, accused Musk of being upset because the bill removes electric vehicle subsidies that benefit Tesla.
The tension escalated when Trump suggested that Musk had known about the bill beforehand and had no issue with it until after leaving his government role. Musk denied this, claiming he was never shown the bill and that it was passed too quickly for proper review. Trump then took things further by threatening to cut Musk’s government contracts and subsidies, which amount to billions of dollars. Musk responded defiantly on social media, calling Trump "ungrateful" and claiming that without his financial support, Trump would have lost the election.
TSLA violated key levels and will be looking for a sharp technical bounce off the $260-$257 zone

Everything we know about the Trump - Musk divorce (so far)
Elon Musk publicly criticised Trump’s “One Big Beautiful Bill” as a “disgusting abomination” that would explode the U.S. deficit and “bankrupt America.” The bill is projected to add $2.5 trillion to the U.S. deficit over 10 years.
Musk claimed Trump wouldn’t have won the 2024 election without his support, calling the backlash “such ingratitude.”
Musk then alleged on X that Trump appears in the Epstein files. This marks a serious escalation (but we all thought this before Musk confirmed it right?)
Trump followed up on Truth Social by calling Musk “crazy” and hinting at cancelling federal contracts with his companies. Trump wrote that cancelling subsidies for Musk’s companies “could save billions,”.
Tesla has wiped out ~$100 billion in market value. Tesla now politically exposed?
Musk floated the idea of creating a new centrist political party, criticising both Democrats and MAGA Republicans. “We need a party that actually represents the interests of the people. Not lobbyists. Not legacy donors. Not extremists.”

Gold H4 Technical update and key levels bulls/bears📊 Technical Outlook Update H4
🏆 Bull Market Overview
▪️stuck in range for now
▪️overhead resistances will limit upside
▪️Bears key S/R: 3410/3460 USD
▪️Bulls key S/R: 3160/3240 USD
▪️Expect range price action
▪️Focus on selling high / buying low
▪️volatility likely to remain low
▪️next few weeks as no major headlines
⭐️Recommended strategy
▪️short high and buy low
▪️detailed price levels above
▪️right now no trade recommended
Latest gold market updates:
📈 Gold surges as renewed tariff threats and geopolitical tensions drive safe-haven demand.
💳 Fiscal concerns escalate after the U.S. credit rating is downgraded, increasing investor interest in gold.
📊 Analysts identify $3,300 as a crucial support level, with strong buying interest keeping prices elevated.
🔮 Major banks project gold to surpass $4,000 per ounce within the next year, citing robust demand from both investors and central banks.
💍 Record gold prices prompt jewelry designers to shift toward 14-karat gold and alternative materials to control costs.
📉 Gold jewelry demand in India continues to decline due to high prices, while investment gold purchases rise.
🌍 Central banks, especially in emerging markets, sustain gold purchases to hedge against currency volatility and inflation.
🛡 Gold maintains key support above $3,200 despite market volatility and profit-taking pressures.
📈 Leading investment banks remain bullish, forecasting significant upside for gold through year-end.
💰 Gold is currently trading near $3,358 per ounce, reflecting ongoing volatility and global economic uncertainty.

TESLA | Monthly Analysis After NASDAQ:TSLA hitting its ATH target, 87% - 90% retracement is next target
start of 2027 = will be a buying signal for tesla unless there's some issues involving with Elon Musk, then tesla could experience under performance
Long term investors - prepare for down side inside buying channel

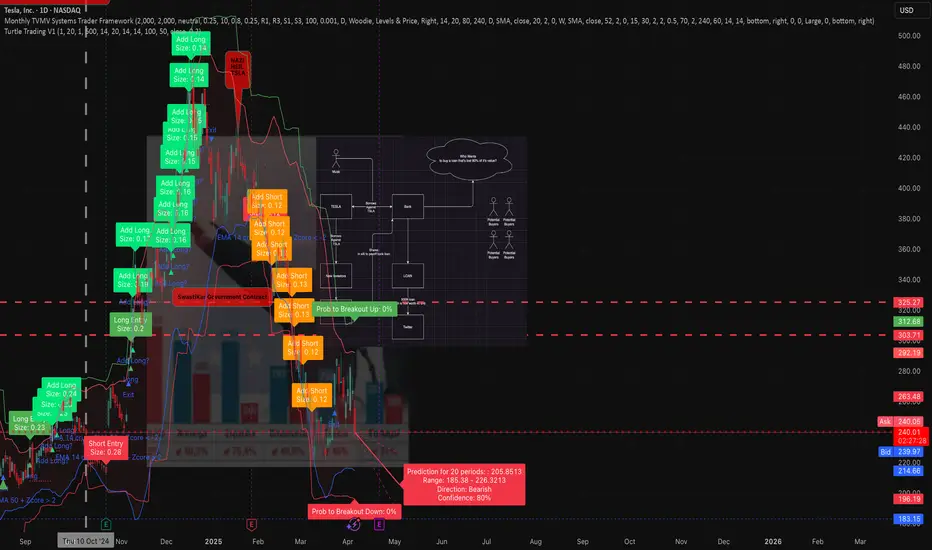
TSLA still bearish like I said. Why you should sue the board.This chart uses an unpublished modified turtle trader indicator / strategy combined with the unpublished TVMV framework using MFT candle sticks (published as separate indicator) and Bollinger bands. The max monthly position size is determined by seasonal probabilities, while the individual trade position sizes are determined by the turtle style volatility sizing based off the former's capital.
Nothing has changed about TSLA.
It has a work from home CEO who is who disconnected from reality and accountability that the stock will not recover. No amount of government contracts can over come the damage this man has done to the brand.
Sales and deliveries are down in every market and the car owners are afraid to drive their cars.
This recent pump had no basis. It lacked both fundamental value and technical value.
TSLA will break below 222 and may go as far as 109 by EOY if the board of directors does not fulfill their fiduciary obligations to share holder to remove Musk permanently .
Shareholders should seriously consider filing a class action law suit against the board of directors in collaboration with NY .
HOLY MOLY! ARE WE IN A RECESSION? $TSLA $120 BEAR FLAG PATTERNA bear flag trading pattern is a technical analysis formation that features a downward-sloping flagpole, followed by a consolidation phase forming a parallel channel. This pattern suggests a potential sharp decline or continuation of the downward trend
I also notice a head and shoulders pattern, as well as an inverse cup and handle.
Everything points to $120.
Sell/Short NASDAQ:TSLA right now with fact check:
+brand reputation risk, high competition, loss of EV market leadership, cyber truck/ product recalls, declining sales with lower margin, stock volatility concern, insider selling, investors buy it based on expected future earnings rather than its current profitability.
+ potential stagflation, tariff war, slow economic growth, inflation, rising public debt, geopolitical tensions, ai bubble, and more

My Technical Analysis for $TSLA (Tesla)📊 Technical Analysis: NASDAQ:TSLA (Tesla)
🗓️ Updated: March 24, 2025
🚨 Critical Zone Being Tested
After breaking out of a multi-year symmetrical triangle, NASDAQ:TSLA is now retesting the upper boundary of the pattern — perfectly aligned with the key ACTION ZONE (liquidity zone + long-term MAs).
🔵 ACTION ZONE ($245–265):
High-probability decision area. Holding this level could trigger a fresh bullish leg.
🟣 SWING BOX ($180–210):
If support fails, this is the next logical area for a potential bullish reaction.
🟡 FVG Daily ($75–115):
Unmitigated Fair Value Gap. Only relevant in case of a major breakdown.
📉 SMI (Stochastic Momentum Index):
Currently in negative territory, but nearing oversold — watch for a potential reversal.
🎯 Scenarios:
Bullish: Strong rejection from the Action Zone → potential move to $350–400 ✅
Bearish: Breakdown below the blue zone → eyes on Swing Box or FVG for reentry ⚠️
📌 Reminder: This is not financial advice. Always manage risk and wait for confirmation before entering a trade.
💬 What do you think? Is Tesla preparing for a bounce or heading lower?
👇 Share your thoughts in the comments!

TSLA has bottomed. Great Rebound spot!!!TSLA ran up from 200 to 475/shr. On its way up it left to gaps in its price action, one gap up to 245 and another one right after to 275. Gaps in price action are eventually filled 90% of the time. During TSLA's recent decline, it pushed all the way down to close the gaps it had in its chart, with the bottom being 220, where the inital gap started.
Now that it has had its rundown and closed its gaps in price action, its likely this is the bottom for TSLA and it'll rebound from here.
