BITCOIN SIGNAL: LEVERAGE DRIVEN PUMP! (where it ends??!)Yello Paradisers! Enjoy the video!
And Paradisers! Keep in mind to trade only with a proper professional trading strategy. Wait for confirmations. Play with tactics. This is the only way you can be long-term profitable.
Remember, don’t trade without confirmations. Wait for them before creating a trade. Be disciplined, patient, and emotionally controlled. Only trade the highest probability setups with the greatest risk to reward ratio. This will ensure that you become a long-term profitable professional trader.
Don't be a gambler. Don't try to get rich quick. Make sure that your trading is professionally based on proper strategies and trade tactics.
Mycryptoparadise

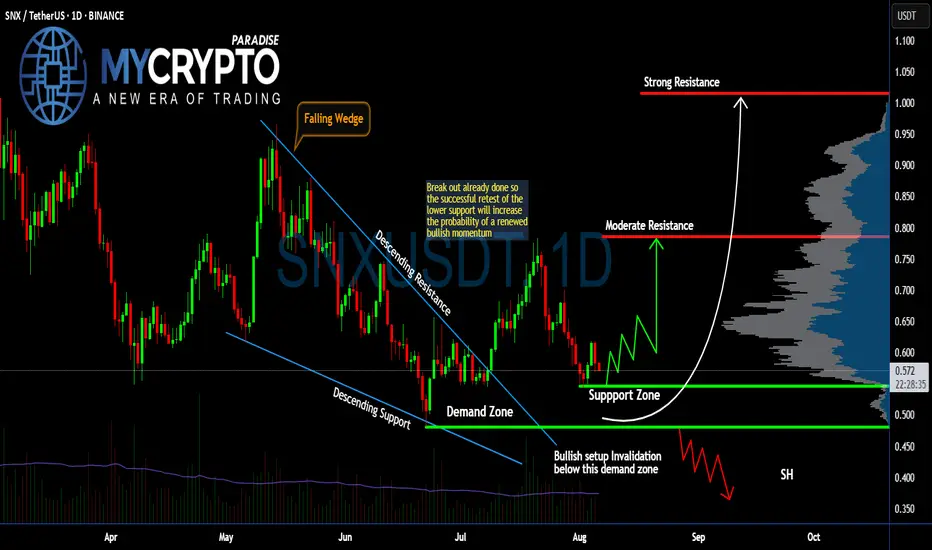
Can #SNX Bulls Sustain the Current Momentum? Watch it CloselyYello, Paradisers! Is this #SNX setup just another fakeout in disguise, or is the market quietly setting up for a major bullish momentum shift? Let’s dissect what’s really happening on #SNXUSDT:
💎After moving through a falling wedge pattern for months, #Synthetix has already broken out above the descending resistance, signaling an early shift in trend. However, the real move hasn’t yet begun—a proper retest of the support zone between $0.50–$0.54 is what we’re watching for now.
💎This support zone aligns with the prior wedge breakout and also overlaps with a visible demand area, making it a key region where buyers could step in again. If bulls defend this area successfully, we expect a renewed rally toward the moderate resistance level at $0.78.
💎From there, the next upside target lies at the strong resistance around $1.01—a level with heavy volume profile resistance and previous seller activity. But that level will only come into play if the bulls reclaim momentum with conviction.
💎On the flip side, if #SNXUSD breaks below $0.48, which is our bullish invalidation level, the setup collapses and opens the door for a deeper drop toward the $0.40–$0.35 zone, where short-sellers are likely to pile in.
Stay patient, Paradisers. Let the breakout confirm, and only then do we strike with conviction.
MyCryptoParadise
iFeel the success🌴
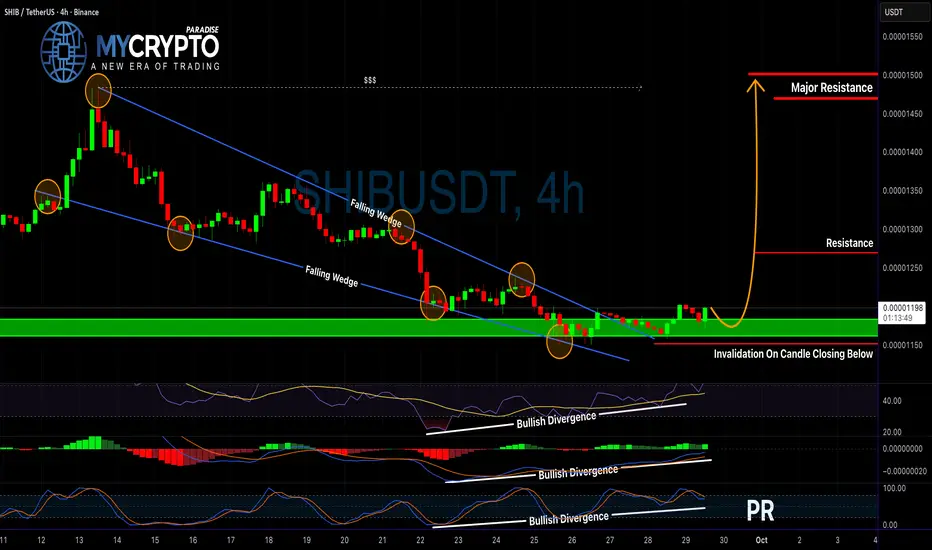
Is SHIB About to Explode or Collapse? Read Before It’s Too LateYello Paradisers! Are you paying attention to SHIB right now? Because this could either be the start of a massive bullish breakout — or the trap that wipes out impatient traders.
💎SHIBUSDT is showing strong potential after breaking out of a falling wedge pattern, which is a classic bullish reversal setup. What makes this move even more convincing is the presence of bullish divergence on the RSI, MACD, and Stochastic RSI — all of which are aligning to support a potential move to the upside.
💎From the current price level, after a proper retest of the support, the setup is still offering a favorable 1:2 risk-to-reward ratio, which is solid for short-term traders.
💎If you’re aiming for even larger risk-to-reward opportunities, you could wait for a more defined retest to enter with tighter risk parameters. However, this comes with the risk of missing the move entirely if the market doesn’t offer that second chance.
💎But here's the key — if the price breaks down and closes below the invalidation level, this entire bullish idea becomes invalid. In that case, it’s much smarter to step back and wait for cleaner price action and a higher-probability setup to form.
💎Discipline always beats impatience.
🎖Strive for consistency, not quick profits. Treat the market as a businessman, not as a gambler. That’s the only way to make it far in your crypto trading journey. Be a PRO.
MyCryptoParadise
iFeel the success🌴
BITCOIN SIGNAL: HUGE MOVE IN DIRECTION NOBODY EXPECTED INCOMING!Yello Paradisers! Let me know your thoughts in the comment section below!
And Paradisers! Keep in mind to trade only with a proper professional trading strategy. Wait for confirmations. Play with tactics. This is the only way you can be long-term profitable.
Remember, don’t trade without confirmations. Wait for them before creating a trade. Be disciplined, patient, and emotionally controlled. Only trade the highest probability setups with the greatest risk to reward ratio. This will ensure that you become a long-term profitable professional trader.
Don't be a gambler. Don't try to get rich quick. Make sure that your trading is professionally based on proper strategies and trade tactics.

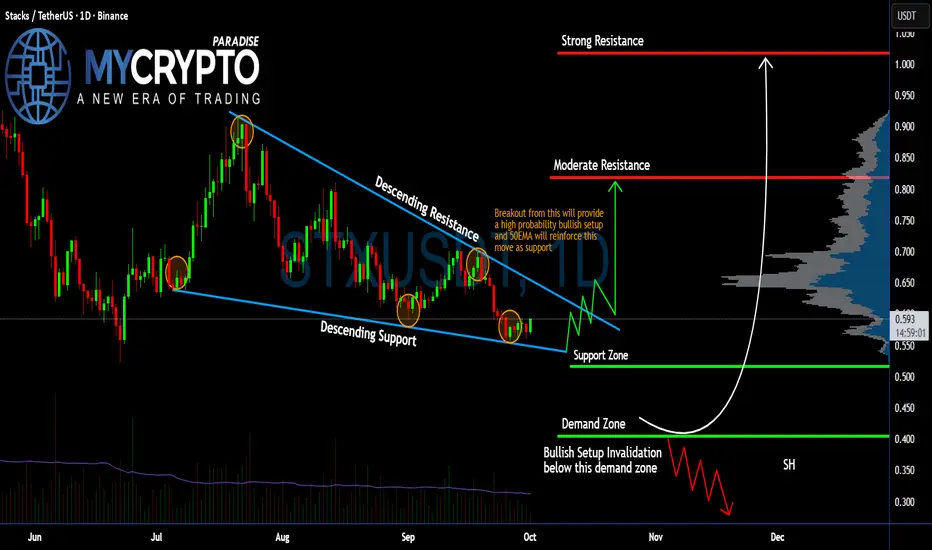
Is #STX Ready to Make an Explosive Bullish Move? Must Watch Yello Paradisers! Are we about to witness a powerful breakout of #STX, or is a trap lurking right under our feet? Let's decode this #STXUSDT setup before it’s too late:
💎#Stacks has been stuck in a clear falling wedge on the daily timeframe by consistently respecting both the descending resistance and descending support lines since late July. Price action is now compressing near the lower end of this structure, showing signs of potential accumulation.
💎Right now, #STXUSD is trading around $0.59, sitting just above the support zone at $0.51, and not far above the final demand zone at $0.40. This area is crucial. As long as bulls defend this zone, the structure remains intact and the bullish scenario is valid.
💎A confirmed breakout above the descending resistance, ideally with a retest of that line alongside support from the 50EMA, would flip this into a high-probability bullish setup. If that happens, we’ll first be targeting the moderate resistance at $0.818. A sustained move above $0.818 opens the door toward the strong resistance at $1.018. That’s your upside target, but only if we break the descending channel cleanly.
💎However, a break below $0.40 would invalidate this entire bullish structure. If this demand zone fails, the setup is broken, and the market could go on to sweep the lower liquidity zones, likely toward $0.30 and below. That’s where over-leveraged bulls will get wiped out.
Strive for consistency, wait for clear confirmations, and remember that discipline always beats chasing quick profits.
MyCryptoParadise
iFeel the success🌴
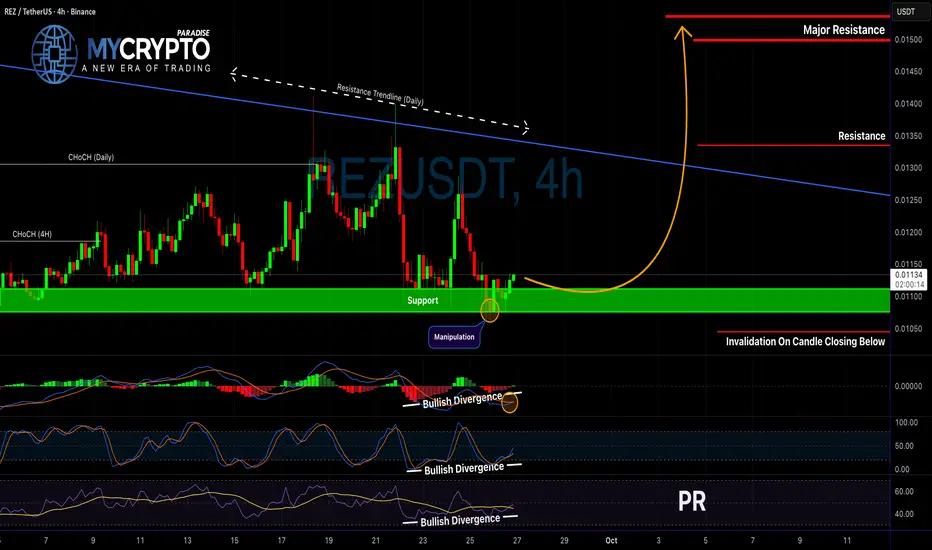
Is REZUSDT About to Explode or Collapse?Yello Paradisers! Have you been paying attention to REZUSDT lately? If not, you could be missing out on a major move that may catch many traders off guard. The pair has recently shown signs of manipulation following a clear accumulation phase, which significantly increases the probability that a distribution phase is now underway.
💎Price is currently sitting at a crucial support level, and before the manipulation occurred, we observed a clear Change of Character (CHoCH) on both the Daily and lower timeframes. This is a strong signal that most early buyers have been taken out, which often sets the stage for the real move to begin.
💎We’re also seeing strong bullish confluence across multiple indicators. The MACD, RSI, and Stochastic RSI are all showing divergence, which further supports the bullish thesis. On top of that, a key daily resistance trendline lies just above the current price and could act as a magnet, drawing the price higher in the short term. This setup is being supported by a double bottom structure forming on the higher timeframe, which we are actively trading from the lower timeframes in order to capture a higher risk-to-reward ratio. The alignment across multiple timeframes increases the probability of a sustained bullish move.
💎If you're looking for an entry, the current price zone offers a solid setup with a risk-to-reward of more than 1:2. A smart approach here would be to secure partial profits early and leave a small position running in case the price accelerates toward higher targets. However, if the price breaksdown & closes candle below our key invalidation level, the bullish scenario will be invalidated. In such a case, it’s better to step aside and wait for stronger confirmation rather than forcing a low-probability trade.
🎖Make sure you play it smart, Paradisers; the next 6–9 months will be juicy for some and painful for others. Discipline, patience, robust strategies, and trading tactics are the only ways you can make it long-term in this market.
MyCryptoParadise
iFeel the success🌴
BITCOIN SIGNAL: MOST PEOPLE ARE DOING THIS NOW (wrong)Yello Paradisers! In this video, we are going through multi-timeframe analysis on Bitcoin as professional traders. We are using advanced technical indicators, and we are properly analyzing with an Elliot Wave perspective. We are digging deep into the sub-waves and structure. Enjoy.
And Paradisers! Keep in mind to trade only with a proper professional trading strategy. Wait for confirmations. Play with tactics. This is the only way you can be long-term profitable.
Remember, don’t trade without confirmations. Wait for them before creating a trade. Be disciplined, patient, and emotionally controlled. Only trade the highest probability setups with the greatest risk to reward ratio. This will ensure that you become a long-term profitable professional trader.
Don't be a gambler. Don't try to get rich quick. Make sure that your trading is professionally based on proper strategies and trade tactics.

Is STX About to Explode or Collapse From This Demand Zone?Yello Paradisers, what if I told you that the next big move on STX could decide whether traders print money or get wiped out in days? The chart is painting a dangerous setup, and ignoring it could be costly.
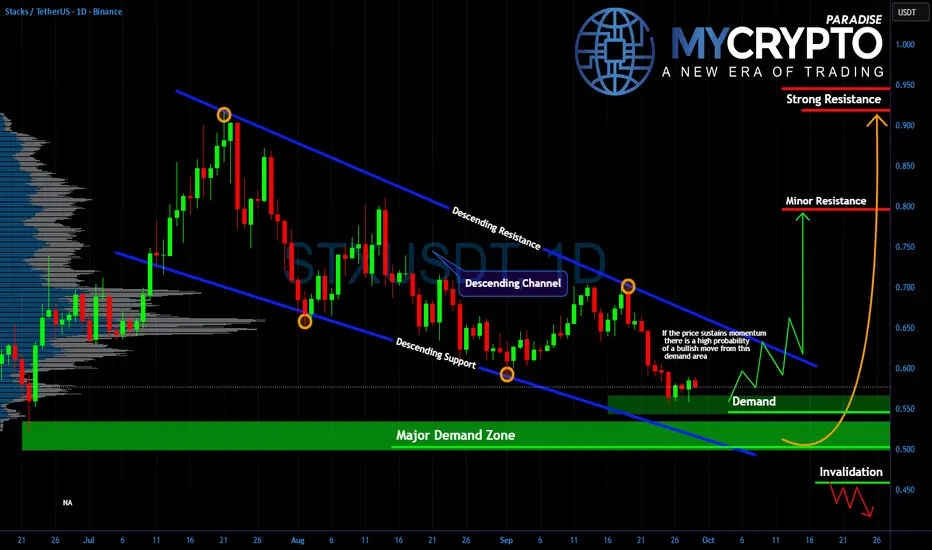
💎#STXUSDT has been stuck in a clear descending channel, repeatedly rejecting from its resistance line and finding temporary relief at its support. Now, price is testing a major demand zone between $0.55–$0.58, a level that could either spark a strong reversal or lead to brutal breakdowns if demand fails.
💎If buyers defend this level with momentum, the probability of a bullish rebound increases significantly. A breakout above the descending resistance could fuel a rally toward the minor resistance at $0.80 and potentially extend all the way to the strong resistance near $0.95. This move would not just trap shorts but also create panic FOMO buying from latecomers.
💎But beware if demand collapses and the zone fails to hold, invalidation comes quickly. A break below $0.50 opens the door for another leg down, flushing weak hands out of the market and creating pain for anyone holding without a plan.
Consistency, risk management, and patience are the real weapons in this market.
MyCryptoParadise
iFeel the success🌴
BITCOIN SIGNAL: PROBABILITIES SHOWING THIS NOW!! (careful) Yello Paradisers! Enjoy the video!
And Paradisers! Keep in mind to trade only with a proper professional trading strategy. Wait for confirmations. Play with tactics. This is the only way you can be long-term profitable.
Remember, don’t trade without confirmations. Wait for them before creating a trade. Be disciplined, patient, and emotionally controlled. Only trade the highest probability setups with the greatest risk to reward ratio. This will ensure that you become a long-term profitable professional trader.
Don't be a gambler. Don't try to get rich quick. Make sure that your trading is professionally based on proper strategies and trade tactics.

Will INJ Hold the Line or Face a Brutal Breakdown?Yello, are you ready for the next major move on #INJ, or will you be one of those caught unprepared when volatility strikes?
💎#INJUSDT has already broken down from its rising channel, and price is now pressing into the key demand zone around $10–9. This level has repeatedly attracted strong buying interest in the past, making it the critical line where bulls must show strength once again.
💎If a rebound takes hold here, INJ could quickly reclaim ground toward the $15 resistance. With strong momentum, an extension toward the $22 level remains entirely possible.
💎But the danger cannot be ignored. If the $10–9 area fails to hold, the structure will shift, and price could collapse into the deeper major demand zone near $7. A breakdown there would confirm bearish control and open the door to a test of $5, fully invalidating the bullish outlook.
This is a decisive moment for #Injective. Stay disciplined, stay patient, and remember that only those who trade strategically and without emotion will come out ahead in this market.
MyCryptoParadise
iFeel the success🌴

BITCOIN SIGNAL: IS IT ABOUT TO GET WORSE??!! (scary) Yello Paradisers!
Together, we go through multiple timeframes. We are going through an ultra-long timeframe, breaking of the channel. How proper reclaims look, what the preceded price action is that is going to happen next and what preceded before that, and what the cycles are. We are taking a look at the bearish divergence, a shooting star which increased the truncation probability on lower timeframes.And that we are in the first motive mode wave of a higher-degree impulse.
On a high time frame chart, we are going through the secondary wave, the bearish divergence, resistances, and with the highest probability, the secondary wave is not yet finished. We are looking for confirmations from a high time frame perspective.
On a medium timeframe, we are deeply calculating the sub-waves. I'm sharing with you the fourth wave that, with the highest probability, is finishing, and we are about to have a fifth corrective mode wave because we are in an ending diagonal.
On a low timeframe chart, I'm sharing with you the expanding triangle and the upcoming price action with the highest probability.
Paradisers! Keep in mind to trade only with a proper professional trading strategy. Wait for confirmations. Play with tactics. This is the only way you can be long-term profitable.
Remember, don’t trade without confirmations. Wait for them before creating a trade. Be disciplined, patient, and emotionally controlled. Only trade the highest probability setups with the greatest risk to reward ratio. This will ensure that you become a long-term profitable professional trader.
Don't be a gambler. Don't try to get rich quick. Make sure that your trading is professionally based on proper strategies and trade tactics.

BITCOIN SIGNAL: ANOTHER PERFECT PREDICTION (warning) Yello Paradisers! As always, as professional traders in this video, once again, we will go through multi-timeframe analysis. We are using Elliot Wave, indicators, advanced technical tools, and price action reading. Enjoy it. I love you.
Paradisers! Keep in mind to trade only with a proper professional trading strategy. Wait for confirmations. Play with tactics. This is the only way you can be long-term profitable.
Remember, don’t trade without confirmations. Wait for them before creating a trade. Be disciplined, patient, and emotionally controlled. Only trade the highest probability setups with the greatest risk to reward ratio. This will ensure that you become a long-term profitable professional trader.
Don't be a gambler. Don't try to get rich quick. Make sure that your trading is professionally based on proper strategies and trade tactics.

ZEUSUSDT Just Flipped Bullish — Are You In?Yello Paradisers , did you catch the bullish CHoCH that formed right after the falling wedge breakout on ZEUSUSDT? If not, you might be overlooking a setup that could lead to a significant move—and fast.
💎Currently, ZEUSDT is flashing multiple bullish confirmations that shouldn’t be ignored. We’ve seen a clean breakout from the falling wedge structure, immediately followed by a bullish Change of Character (CHoCH). More importantly, momentum indicators are aligning perfectly: the MACD, and Stochastic RSI are all showing bullish divergence. This confluence increases the probability of a sustained upward move from current levels.
💎In terms of entry strategy, we’re monitoring two scenarios. For conservative traders, the ideal setup would be a pullback into the I-FVG zone. From there, the trade offers a clear 1:2 risk-reward opportunity, which aligns well with smart, sustainable trading practices. For more aggressive traders, a position at the current price level provides approximately a 1:1 risk-reward, though this is less favorable and carries higher risk.
💎However, it’s crucial to emphasize that our entire bullish thesis becomes invalid if the price breaks down and closes a candle below our defined invalidation level. That would completely negate the bullish setup and shift the bias back to the downside.
🎖Strive for consistency, not quick profits. Treat the market as a businessman, not as a gambler.
MyCryptoParadise
iFeel the success🌴

Are #MBOX Bulls Ready For a Pullback or Bears Will Win? Yello, Paradisers! Is #MBOX set for a bullish move from its demand zone, or will this ascending channel finally collapse? Let’s break the #Mobox setup:
💎#MBOXUSDT has been respecting an ascending channel, bouncing between clear support and resistance levels. Right now, the price is trading around $0.059, sitting just above the ascending support trendline and near the demand zone. If this structure holds and the 50EMA flips into support, the probability of a bullish continuation increases significantly.
💎If buyers defend this zone, the first upside target for #MBOXUSD is the moderate resistance at $0.0866. A confirmed breakout above that opens the door for a move toward the strong resistance at $0.108, which would mark the top of this ascending channel and align with heavy supply levels.
💎On the downside, the key support sits between $0.047 and $0.036. These levels have already provided support and a necessary push to the price. The reaction of the traders at these two levels will determine a lot.
💎A retracement into this area could still provide a bounce, but any breakdown and daily close below $0.036 would invalidate the bullish setup completely. In that case, sellers could drag #MBOX much lower, breaking the bullish structure and trapping late buyers.
If you want to succeed in trading, then treat the market as a businessman, not as a gambler.
MyCryptoParadise
iFeel the success🌴

Is RENDER About to Explode?Yello Paradisers, are you watching closely? RENDERUSDT just completed a textbook breakout—and it might be your best shot at catching a high-probability move before the crowd even notices.
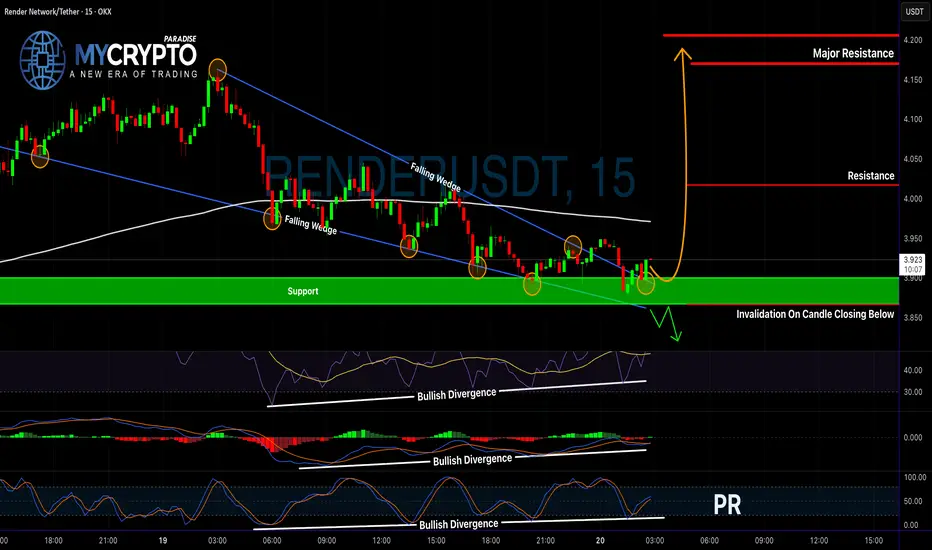
💎RENDERUSDT has officially broken out of a falling wedge—a powerful bullish pattern—confirmed by bullish divergence on the RSI, MACD, and Stochastic RSI. When all three indicators align like this, the probability of a strong upside move significantly increases.
💎Even better, price action has already retested the wedge breakout, and from the current levels, the market is offering a favorable risk-to-reward (RR) setup.
💎Now, if you’re looking for additional confirmation, a more cautious play would be to wait for a pullback into the nearest support zone, and then enter on a bullish candlestick formation. This approach could not only boost your confidence but also improve your overall RR.
💎However, stay sharp—if price breaks and closes below the support and our invalidation level, the entire setup gets invalidated. In that case, patience is key. Wait for stronger price action before considering re-entry.
🎖Strive for consistency, not quick profits. Treat the market as a businessman, not as a gambler. Be patient, stay focused, and let the market come to you, Paradisers. That’s how the winners play this game long-term.
MyCryptoParadise
iFeel the success🌴
IMXUSDT – Major Breakout or Another Painful Trap Ahead?Yello Paradisers, is this the real start of a powerful bullish reversal on #IMX, or just another classic setup to liquidate impatient traders before the true move begins? The next few days will decide everything.
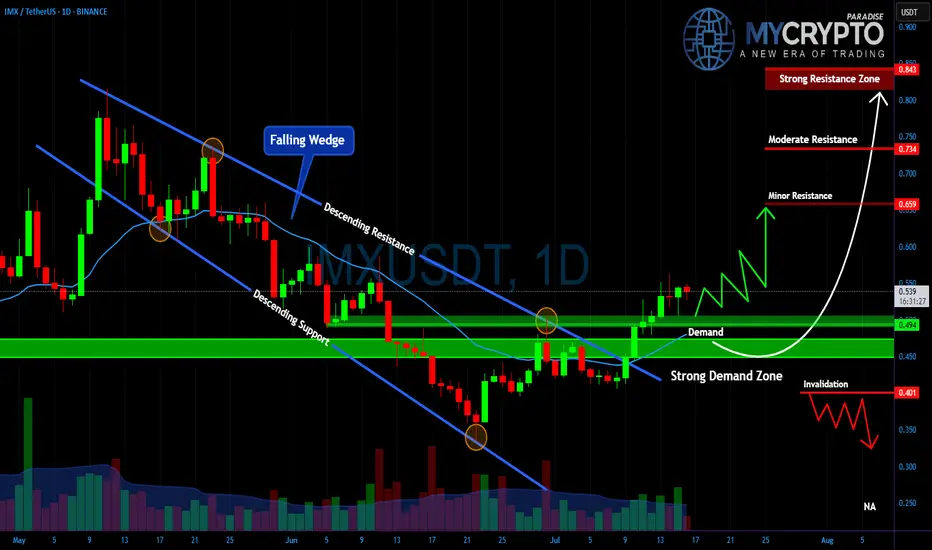
💎#IMXUSDT has broken out of a falling wedge, which is a typical bullish reversal structure, and is now retesting the strong demand zone between $0.45 and $0.49. As long as the price holds above this level, the bullish scenario remains intact, with $0.659 as the first key resistance to watch.
💎A clean break above $0.659 could open the way toward $0.734, while the critical resistance zone at $0.843 will be the ultimate test of whether IMX can shift into a sustained uptrend.
💎However, the invalidation level sits at $0.401. If this level fails, expect a fast move back toward $0.30, which will likely wipe out many traders who jumped in too early.
This is exactly where most retail traders get trapped. They either chase the move too late or panic-sell too early.
MyCryptoParadise
iFeel the success🌴
BITCOIN PREDICTION: THIS IS THE NEXT TARGET (scary) Yello Paradisers! Enjoy the video!
And Paradisers! Keep in mind to trade only with a proper professional trading strategy. Wait for confirmations. Play with tactics. This is the only way you can be long-term profitable.
Remember, don’t trade without confirmations. Wait for them before creating a trade. Be disciplined, patient, and emotionally controlled. Only trade the highest probability setups with the greatest risk to reward ratio. This will ensure that you become a long-term profitable professional trader.
Don't be a gambler. Don't try to get rich quick. Make sure that your trading is professionally based on proper strategies and trade tactics.

UNIUSDT About to Explode or Break Traders’ Dreams?Yello Paradisers, is #UNIUSDT quietly preparing for its next major rally, or are we sitting right on the edge of a painful trap for impatient traders? Let’s break it down.
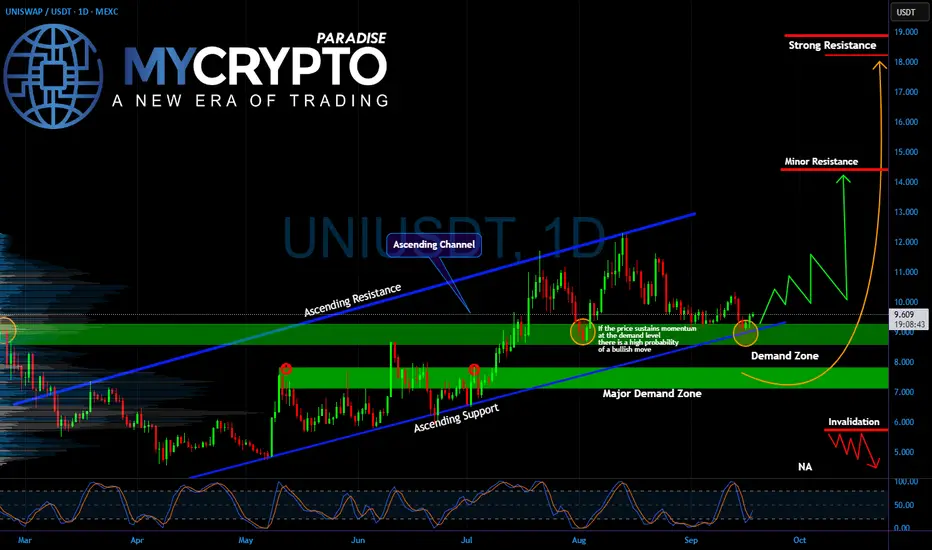
💎#UNI has been holding within its ascending channel, bouncing consistently from its demand zone around $9–$9.50. Every retest of this area has brought buyers back into the game, showing strong defense by bulls. Right below, the major demand zone at $7–$8 remains the key level where long-term buyers are waiting, meaning this area acts as a foundation for continuation.
💎On the upside, if #UNI holds current structure and builds momentum, the first challenge is the minor resistance near $14. Breaking through this opens the door toward the strong resistance zone at $18–$19, where profit-taking will likely be aggressive.
💎However, there’s no free ride. A failure to hold the current demand zone could trigger a drop into the $7–$8 major demand area. If that level also gives up, the structure is invalidated, and UNI could revisit much deeper lows around $5–$6, wiping out weak hands before any real recovery.
💎Right now, #UNI is at a pivotal point: defend support and aim for $14–$18, or lose footing and fall into heavy liquidation territory.
Strive for consistency, wait for clear confirmations, and remember that discipline always beats chasing quick profits.
MyCryptoParadise
iFeel the success🌴
DOGE Breakout or Bull Trap? Read Before You Enter!Yello Paradisers! Could this be the breakout that finally sends DOGE flying, or is it just another trap designed to lure in early bulls before dumping hard? If you’re thinking about entering here, you’ll want to read this entire breakdown — because the price action is sending mixed signals, and it’s critical to stay sharp right now.
💎DOGEUSDT has just broken out of a classic falling wedge pattern — a historically bullish setup that often marks the end of a corrective phase. What strengthens this move even more is the presence of a hidden bullish divergence on the RSI and a bullish divergence on the MACD, both suggesting that momentum is building to the upside. In addition, we’ve now seen a bullish CHoCH (Change of Character) right after a liquidity grab, which further increases the probability that this could be the start of a new impulsive move upward.
💎That said, the current risk-reward ratio from this level is sitting at around 1:1, which is not ideal for a high-conviction trade — especially if you're managing capital with a long-term mindset. For that reason, the more strategic move here would be to wait for a pullback and watch for a strong bullish candlestick confirmation on the lower timeframes. This would offer a better entry with improved risk-reward, giving you more confidence and cleaner structure to trade off.
💎Still, if you're an aggressive trader, taking a small position now with that same 1:1 RR could make sense — but only if your risk is clearly defined and well managed. Chasing a breakout without a confirmed entry trigger or without patience could cost you, especially in a choppy market like this one.
💎However, if DOGE breaks back down and closes below the invalidation level, then the entire bullish setup is invalidated. In that case, it’s best to step aside, wait for cleaner structure, and only re-enter once we see stronger bullish confirmation or a new range develop.
🎖We are playing it safe right now. If you want to be consistently profitable, you need to be extremely patient and always wait only for the best, highest probability trading opportunities.
MyCryptoParadise
iFeel the success🌴

BITCOIN NEXT MOVE REVEALED!!!!! (this will make you scream) Yello Paradisers! In this video, we went through multiple timeframes as professional traders. We assumed things to analyze in Elliott Wave and other important indicators and advanced technical analysis tools. What's the next movement going to be with the highest probability!
Paradisers! Keep in mind to trade only with a proper professional trading strategy. Wait for confirmations. Play with tactics. This is the only way you can be long-term profitable.
Remember, don’t trade without confirmations. Wait for them before creating a trade. Be disciplined, patient, and emotionally controlled. Only trade the highest probability setups with the greatest risk to reward ratio. This will ensure that you become a long-term profitable professional trader.
Don't be a gambler. Don't try to get rich quick. Make sure that your trading is professionally based on proper strategies and trade tactics.

#XRP is Approaching a Breakout | Will It Hold or Collapse? Yello, Paradisers! Is #XRP about to confirm a real breakout from months of sideways pain, or is this just another trap? Let’s dissect what’s happening with precision so you’re prepared either way:
💎After weeks of compression beneath a well-defined descending resistance, #XRPUSDT is about to break out. The breakout above this key trendline is now increasing the probability of a bullish continuation, especially with the 50EMA acting as dynamic support and reinforcing the bullish pressure.
💎Currently, the price is trading around $3.00, right above the breakout zone. If the market successfully retests this descending resistance as new support and holds, this would signal strong momentum building up for the next impulsive leg.
💎If that happens, the first upside target is the moderate resistance level at $3.66. A confirmed break above that could send #XRPUSD toward the strong resistance near $4.17, which aligns with the upper boundary of the visible volume profile.
💎On the flip side, the support zone between $2.69 and $2.48 now becomes critical. A retracement into this area could provide a high-probability bounce, but any breakdown and daily close below $2.4849 would invalidate the current bullish setup. In that case, price could unwind sharply, as the bullish structure would be broken, and sellers could regain control.
Stay patient, Paradisers. Let the breakout confirm, and only then do we strike with conviction.
MyCryptoParadise
iFeel the success🌴

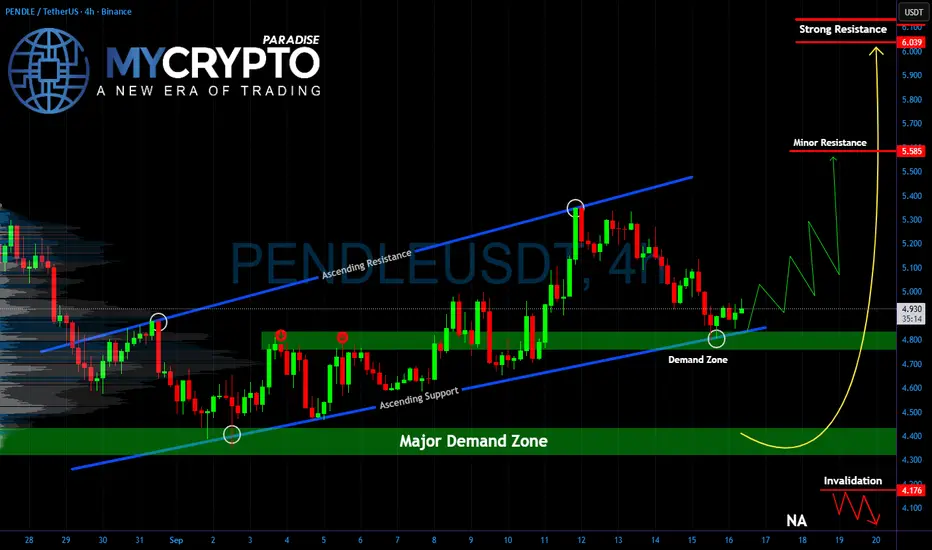
PENDLE At Critical Turning Point Before Explosive MoveYello Paradisers, can #PENDLEUSDT hold the line here, or is a painful flush waiting around the corner? After the recent selloff, the price has landed right inside a demand zone that previously triggered strong recoveries. This is the level where buyers need to step up, or the structure risks collapsing toward the deeper major demand area below.
💎Currently, #PENDLE is bouncing from the ascending support trendline after retesting it, showing early signs of strength. If momentum continues, the first big obstacle lies at the 5.58 minor resistance. A clean breakout above that level could open the way toward the strong resistance zone around 6.03–6.13, which has historically been a heavy supply area. That’s where aggressive profit-taking is likely to appear again.
💎On the downside, the invalidation level remains clear at 4.17. A close below this mark would signal that demand has completely failed, and it could invite deeper liquidation, dragging the price back into the major demand zone around 4.20–4.40. Until then, the bullish structure remains intact, but the next moves will be decisive.
🎖Strive for consistency, not quick profits. Treat the market as a businessman, not as a gambler. The next breakout or breakdown will shake out weak hands, but only disciplined traders will stay on the right side of the move.
MyCryptoParadise
iFeel the success🌴
SHIB Breakout Incoming or Another Trap?Yello Paradisers, have you noticed how #SHIBUSDT has been quietly coiling at its demand zone while retail traders are completely distracted elsewhere? What looks like silence right now could easily turn into a violent move, and the next few candles will decide everything.
💎Price has been stuck inside a descending channel, repeatedly testing both support and resistance levels. Most recently, we’ve seen a classic double bottom formation at the demand zone, a structure that often signals the beginning of a larger bullish reversal if momentum follows through. As long as SHIB holds above this critical green zone, bulls have the upper hand.
💎The first confirmation would come with a clean breakout above the descending resistance, opening the road toward the minor resistance around $0.00001345. But the real target that could bring back FOMO is the resistance zone between $0.00001428 – $0.00001445. This area is packed with liquidity, and if taken out with strength, SHIB could trigger a sharp rally that leaves latecomers chasing.
💎On the flip side, the risk remains clear: if a daily close slips below the major demand zone, the bullish scenario gets invalidated, and SHIB could tumble toward fresh lows inside the channel. This is where inexperienced traders usually get trapped, overleveraged, and liquidated, while disciplined players quietly wait for the highest probability setups.
Stick to your plan, manage your risk, and don’t let emotions guide your entries. The market is designed to shake out the weak before rewarding the patient and prepared.
MyCryptoParadise
iFeel the success🌴
