#MYRO/USDT Breaks Out of Inverse Head and Shoulders#MYRO
The price is moving in a descending channel on the 1-hour timeframe. It has reached the lower boundary and is heading towards a breakout, with a retest of the upper boundary expected.
We are seeing a bearish trend in the Relative Strength Index (RSI), which has reached near the lower boundary, and an upward bounce is expected.
There is a key support zone in green at 006770. The price has bounced from this level several times and is expected to bounce again.
We are seeing a trend towards stabilizing above the 100-period moving average, which we are approaching, supporting the upward trend.
Entry Price: 0.006940
First Target: 0.007170
Second Target: 0.007619
Third Target: 0.008123
Remember a simple principle: Money Management.
Place your stop-loss order below the green support zone.
For any questions, please leave a comment.
Thank you.
Myroanalysis

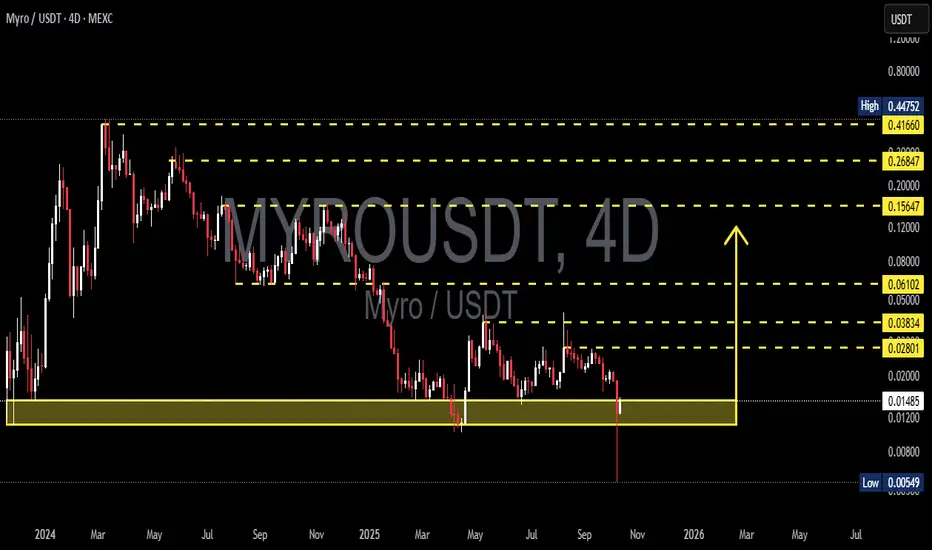
MYROUSDT — Final Battleground: Epic Reversal or Total Breakdown?MYRO is now standing at the most critical moment of its entire trend.
Price is retesting the key demand zone between $0.015 – $0.011, a yellow block that has acted as the last defense line for buyers since early 2024.
This time, price even pierced below it with a massive wick down to $0.0055, only to snap back quickly — a textbook sign of a liquidity sweep or stop hunt before a potential reversal.
This move wasn’t random. It’s how the market flushes out weak longs before revealing its real direction.
Now the question is simple — but critical:
Was this the final trap before a major reversal, or the doorway to deeper destruction?
---
📊 Market Structure & Technical Context
MYRO remains in a macro downtrend, consistently forming lower highs and lower lows since its 2024 peak.
However, each time price revisits the $0.015–$0.011 zone, sellers begin to lose strength — showing strong buying reaction from this historical demand.
The long wick to $0.0055 could be a final shakeout, clearing liquidity before the accumulation phase truly begins.
But if price fails to hold above this zone and closes below it, that same area will flip into resistance — confirming a major breakdown with downside continuation into uncharted territory.
---
🟢 Bullish Scenario — The Rebirth of MYRO
A bullish reversal setup will confirm only if price closes a 4D candle above $0.015 and holds.
Such a move would validate that the long wick was just a liquidity trap — signaling the start of a medium-term recovery.
Potential upside targets:
$0.028 → first resistance zone
$0.038 – $0.061 → mid-term distribution levels
$0.156+ → full reversal target if market-wide momentum supports the move
Look for RSI bullish divergence, rising volume, or momentum flip confirmation.
If these signals align, MYRO could begin forming its first higher low after months of decline — signaling the birth of a new cycle.
---
🔴 Bearish Scenario — The Breakdown of Hope
If MYRO closes a 4D candle below $0.011, the game changes completely.
The yellow block ($0.015–$0.011) turns into a strong resistance zone, and the breakdown likely triggers capitulation pressure.
The next support sits around $0.0055, where the previous liquidity sweep ended.
If that level fails, the market could enter true price discovery below $0.005, with no clear structure to catch the fall.
This would confirm that the downtrend remains dominant and that any future bounce would likely be a dead cat rally, not a true reversal.
---
🧠 Final Thoughts — “Make or Break Zone”
MYRO is now balancing on the edge between hope and collapse.
The $0.015–$0.011 zone isn’t just a technical level — it’s a psychological battlefield where both sides fight for control.
If the bulls defend it successfully, a strong multi-phase recovery could unfold.
If not, the breakdown below $0.011 could mark the start of a new capitulation wave toward fresh lows.
For disciplined traders, this is the moment to wait for confirmation, not to gamble.
Patience here can be the difference between catching the bottom — or falling with it.
---
#MYRO #MYROUSDT #CryptoAnalysis #AltcoinAnalysis #LiquiditySweep #SmartMoneyConcepts #TechnicalAnalysis #CryptoTA #PriceAction #SupportAndResistance #CryptoTrading #SwingTrade #Breakout #CryptoReversal
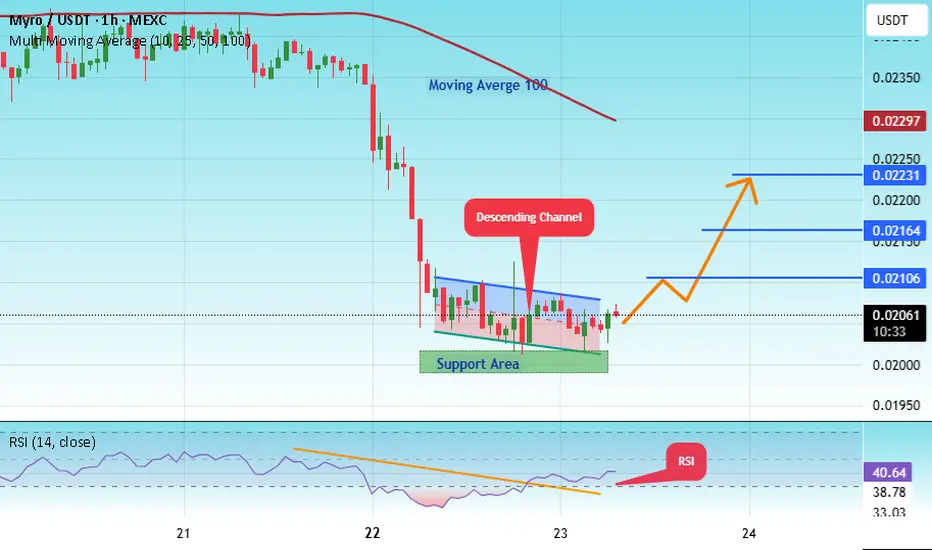
#MYRO/USDT DT Testing Key Support – Breakout or Breakdown ? #MYRO
The price is moving within a descending channel on the 1-hour frame, adhering well to it, and is heading for a strong breakout and retest.
We have a bearish trend on the RSI indicator that is about to be broken and retested, which supports the upward breakout.
There is a major support area in green at 0.02000, which represents a strong support point.
We are heading for consolidation above the 100 moving average.
Entry price: 0.02060
First target: 0.02100
Second target: 0.02160
Third target: 0.02231
Don't forget a simple matter: capital management.
When you reach the first target, save some money and then change your stop-loss order to an entry order.
For inquiries, please leave a comment.
Thank you.
#MYRO/USDT myro road map ( 1 H )#MYRO
The price is moving within an ascending channel on the 1-hour frame, adhering well to it, and is poised to break it strongly upwards and retest it.
We have support from the lower boundary of the ascending channel, at 0.02040.
We have a downtrend on the RSI indicator that is about to break and retest, supporting the upward move.
There is a key support area in green at 0.02020, which represents a strong basis for the upward move.
Don't forget one simple thing: ease and capital.
When you reach the first target, save some money and then change your stop-loss order to an entry order.
For inquiries, please leave a comment.
We have a trend of stability above the Moving Average 100.
Entry price: 0.02040
First target: 0.02140
Second target: 0.02200
Third target: 0.002276
Don't forget one simple thing: ease and capital.
When you reach the first target, save some money and then change your stop-loss order to an entry order.
For inquiries, please leave a comment.
Thank you.

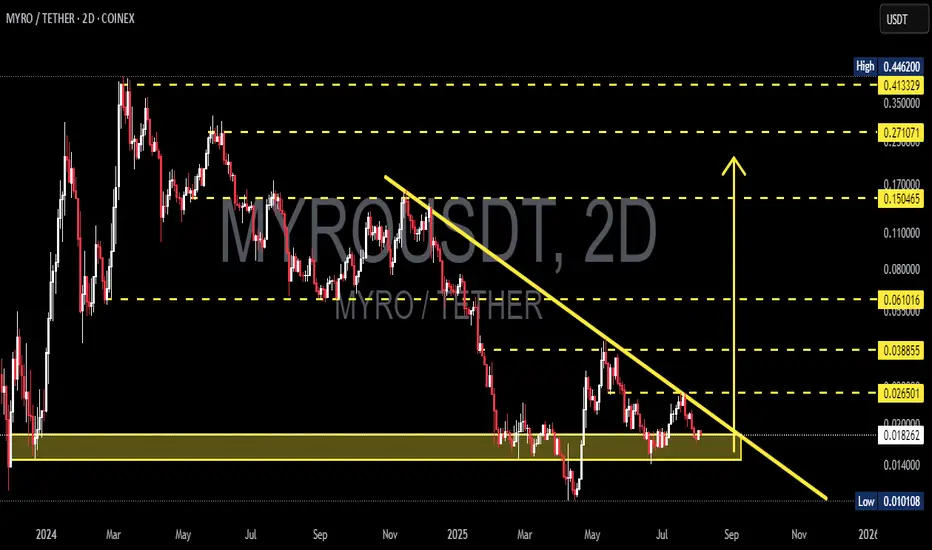
MYRO/USDT Testing Key Support – Breakout or Breakdown?📊 Complete and Relevant Chart Analysis:
The MYRO/USDT pair is currently in a consolidation phase after experiencing a medium-term downtrend. Several key technical elements can be observed in this chart:
---
🟡 Support Zone (Demand Area):
Price is now sitting at a strong support zone (yellow box), ranging around $0.014 – $0.018, which has been tested multiple times throughout 2024–2025.
This zone serves as a potential accumulation base and could act as a springboard for a reversal.
---
📉 Descending Trendline Resistance:
A dominant descending trendline from the November 2024 high continues to suppress the price.
The price has yet to break above this trendline, indicating sellers are still in control on the medium-term timeframe.
---
📈 Key Resistance Levels:
Based on previous structure and potential retracement targets:
$0.026501
$0.038855
$0.061016
$0.150465
$0.271071
---
📉 Nearest Support Levels:
$0.018287 (current price)
If price breaks down below this zone, it may drop toward $0.014000 or even $0.010108 (all-time low)
---
🧠 Pattern & Structure:
A clear Descending Triangle pattern is forming, typically a bearish continuation. However, as price nears the apex and holds the support zone, this could also signal a potential reversal setup.
Volume confirmation will be crucial if a breakout occurs.
---
🚀 Bullish Scenario:
1. Price bounces off the strong support zone and successfully breaks the descending trendline with solid volume.
2. Targets on the upside include:
$0.0265 (minor resistance)
$0.0388
$0.0610 (psychological and technical level)
---
🔻 Bearish Scenario:
1. If price fails to hold above $0.018 and breaks down from the yellow support box:
A drop toward $0.0140 is likely, with potential extension to $0.0101.
2. Increasing selling pressure and low volume on the bounce would strengthen this bearish outlook.
---
🎯 Conclusion:
MYRO/USDT is at a critical juncture, testing a major support level and nearing the end of a descending triangle. The next movement will determine whether we see a bullish breakout or a continuation of the bearish trend.
#MYROUSDT #CryptoAnalysis #AltcoinSetup #SupportResistance #BreakoutTrade #DescendingTriangle #TechnicalAnalysis #CryptoSupport #ReversalPattern #CryptoTrading
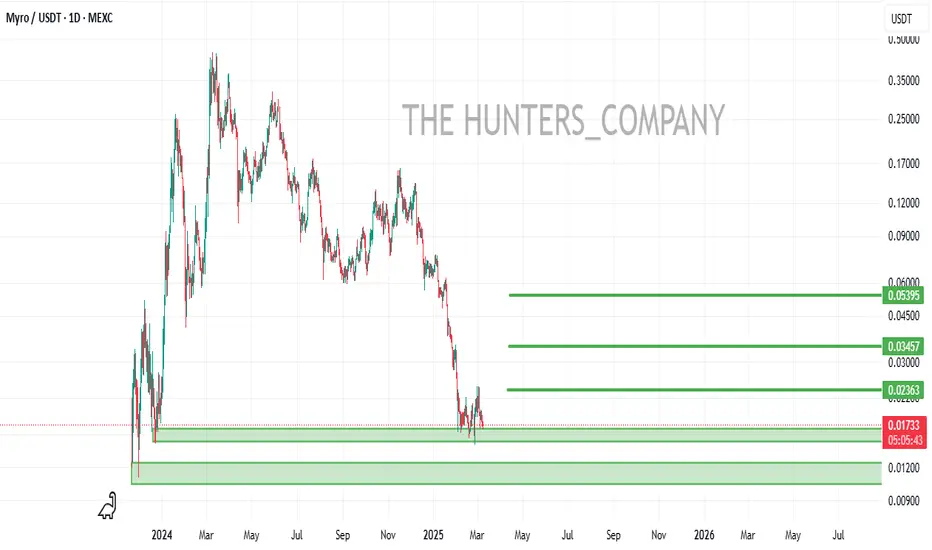
MYROUSDT 2D AnalysisMYRO ~ 2D Analysis
#MYRO Buy back on retest of this support block with short term target of at least 20%+ from this support.

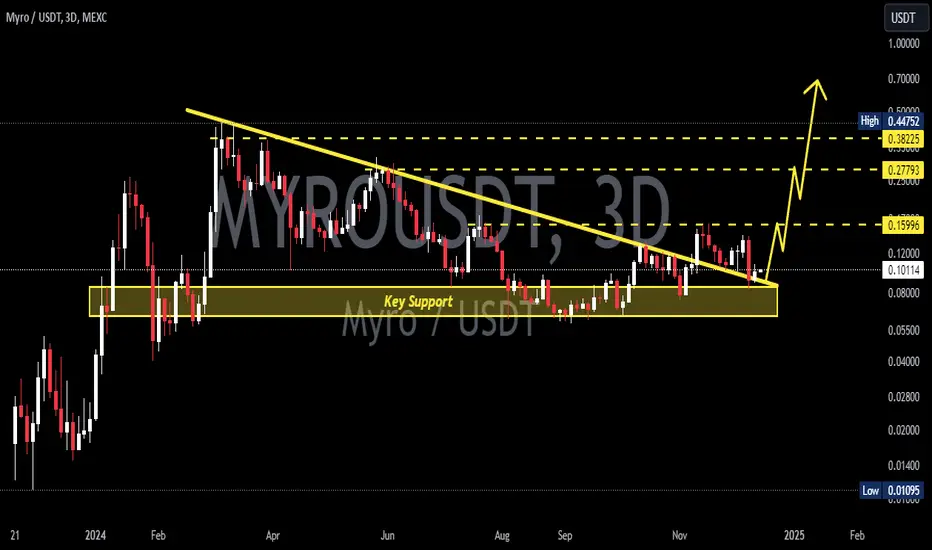
MYROUSDT 3D AnalysisMYRO ~ 3D Analysis
#MYRO This trade is very high risk
Buy gradually from here with a short term target of at least 15%+, long term target $0.2 - $0.4

MYROUSDT 2DMYRO ~ 2D Analysis
#MYRO This trade is very high risk. Buy from here with a short -term target of at least 15%+.

MYRO BUYHello friends
Due to the price correction, we are now at the bottom of the price and are on important support.
You can buy in steps according to the specified ranges.
We have also specified price targets for you.
*Trade safely with us*
MYROUSDT 2DMYRO ~ 2D Analysis
#MYRO This trade is very high risk, But if you still have a Conviction in this coin, the price increase of 20%+ is not too difficult from here.

MYROUSDT 3DMYRO Update ~ 3D
#Myro Retesting this support block,. If you still have Conviction on this coin,. This support block would be a very good buy spot for now. buy in stages with a minimum target of 20%+

MYROUSDT 3DMYRO ~ 3D
#MYRO So far it continues to maintain this support level. If you still have Conviction on the coin,. Buy in stages from here. with a minimum target of 20%+
MYROUSDTMYRO ~ 3D
#MYRO This support block is a great time to buy gradually. With a short term target of at least 20%++

MYROUSDTMYRO ~ 3D Update
#MYRO Very clearly, a break of this resistance line will confirm that bullishness is coming quickly.
