SHELL/USDT — Demand Zone: Accumulation or Final Breakdown?
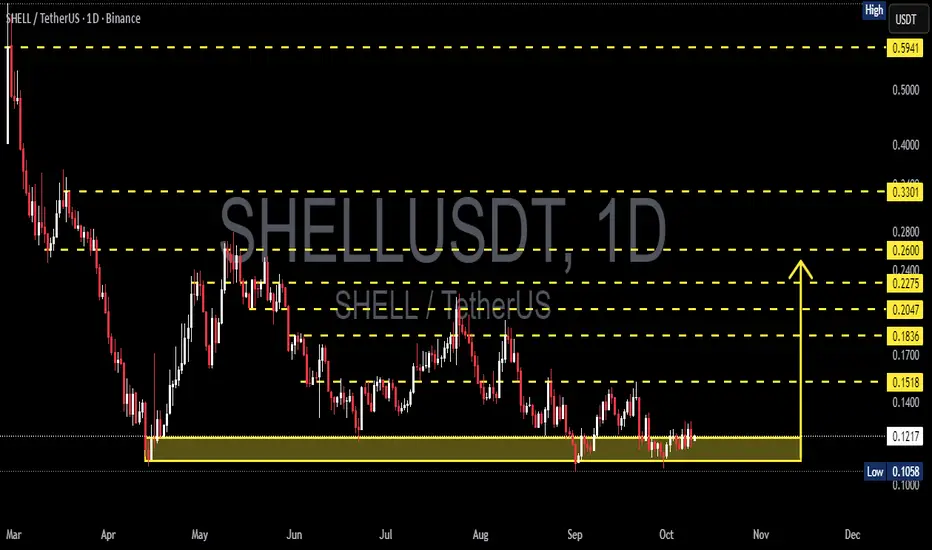
SHELL is currently sitting at a critical support zone between 0.106–0.122 USDT, a region that has acted as a strong base since May. Each time price dips into this yellow zone, buyers have stepped in to absorb the selling pressure — marking it as a battlefield between bulls and bears.
However, sellers are still dominating the broader structure. The series of lower highs since August forms a clear descending triangle pattern, typically bearish — yet, in some cases, such formations become hidden accumulation zones once buying volume quietly starts building near the support.
---
Key Levels
Main Support Zone: 0.106–0.122 (highlighted in yellow — critical buyer defense)
Immediate Resistance: 0.1518 (first breakout trigger)
Next Resistance Levels: 0.1836 → 0.2047 → 0.2275 → 0.26
Major Resistance Targets: 0.33 and 0.59
Current Price: ≈ 0.1214 USDT
---
Market Structure
The current setup forms a descending triangle, defined by constant support and descending highs — a sign of ongoing bearish pressure.
Yet, if the support continues to hold and the market begins to form higher lows, this could shift into a reversal base, signaling the start of a potential trend recovery toward 0.18–0.20 USDT.
But if price breaks below 0.1058 with conviction, it may trigger a capitulation wave, driving SHELL down toward 0.06–0.08 USDT.
---
Bullish Scenario
Bullish confirmation checklist:
1. Price continues to hold above 0.106–0.122.
2. A daily close above 0.1518 with strong buying volume.
3. Successful retest of 0.1518 as new support.
Bullish targets:
0.1518 → 0.1836 → 0.2047 → 0.2275 → 0.26
Potential upside: +25% to +114% from current levels.
Bullish narrative:
If buyers manage to defend this zone, it could represent a final accumulation phase before a larger reversal. This structure often reflects where smart money starts positioning quietly before a trend shift.
---
Bearish Scenario
Bearish confirmation checklist:
1. A daily close below 0.1058 (confirmed breakdown).
2. Failed retest of previous support (turns into resistance).
3. Increasing sell volume confirming momentum continuation.
Downside projection (measured move):
Height of triangle ≈ 0.046 → Breakdown target ≈ 0.0598 USDT.
Potential drop: ~50% from current price.
Bearish narrative:
If the 0.106 zone collapses, buyers lose control. This could trigger a panic-sell phase, clearing out weak hands before the market finds its true bottom.
---
Strategic Takeaway
SHELL is at a make-or-break point:
Hold the zone: Possible start of a new accumulation and recovery.
Lose the zone: Likely continuation of the downtrend with deeper correction.
Aggressive traders may look for entries near support with tight stops below 0.1058.
Conservative traders can wait for confirmation above 0.1518 before taking a position.
Watch for volume spikes and daily closes — they’ll reveal whether this is the beginning of a new bullish cycle or a final breakdown before capitulation.
---
#SHELL #SHELLUSDT #CryptoAnalysis #SupportResistance #DescendingTriangle #Breakout #AltcoinSetup #CryptoChart #TechnicalAnalysis
Myshell
SHELLUSDT – Major Breakout Incoming? Time to Catch the Explosive🔍 Overview:
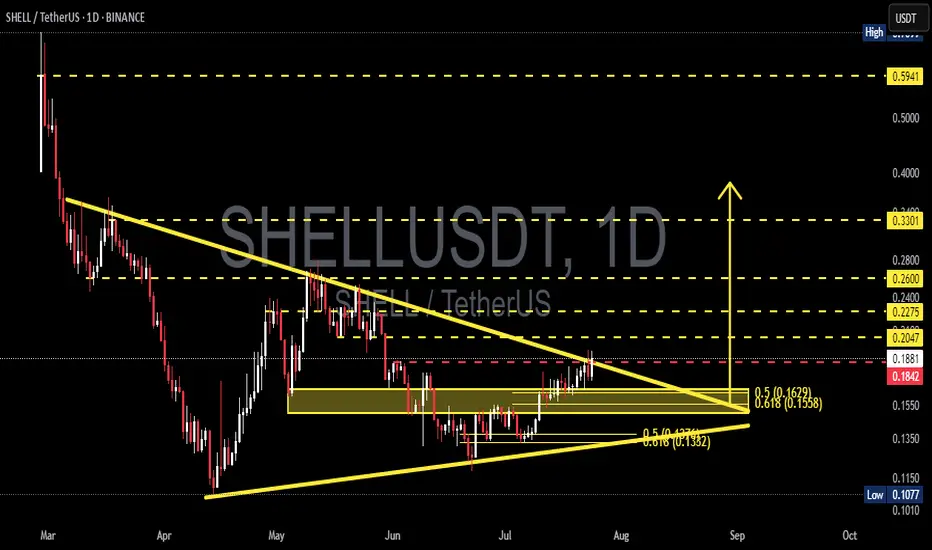
SHELL/USDT is approaching a critical breakout point after forming a large Symmetrical Triangle pattern since early May. Price has been coiling within this triangle, forming a tight squeeze between higher lows and descending resistance – a textbook setup for a high-volatility breakout.
This pattern is highly significant due to its large base structure and multiple confirmations from both trendlines, signaling that a big move may be imminent.
---
📐 Technical Pattern: Symmetrical Triangle + Fibonacci Cluster Support
The Symmetrical Triangle suggests market indecision between buyers and sellers, but pressure is building rapidly.
Strong Fibonacci confluence zone at:
0.5 @ $0.1629
0.618 @ $0.1558
This area acts as a major demand/support zone, having held firm multiple times.
The ascending support line from below shows gradual accumulation and strengthening buyer confidence.
---
🚀 Bullish Scenario (High Breakout Potential):
If price breaks above the descending triangle resistance, we could see a powerful move with clear upside targets:
✅ TP1: $0.2047 (minor local resistance)
✅ TP2: $0.2275 (previous rejection zone)
✅ TP3: $0.2400 (psychological level)
✅ TP4: $0.2600 (former supply zone)
✅ TP5: $0.3301 (measured move from triangle height)
✅ TP6: $0.5941 (long-term resistance)
📈 A confirmed breakout could trigger a mid-to-long-term trend reversal, especially if supported by volume and momentum.
---
📉 Bearish Scenario (Invalidation Risk):
On the flip side, if the price fails to break above and instead breaks below the triangle, then we might revisit key supports:
❌ Support 1: $0.1629 (Fib 0.5)
❌ Support 2: $0.1558 (Fib 0.618)
❌ Support 3: $0.1350 (previous consolidation zone)
❌ Support 4: $0.1077 (major swing low)
📉 A breakdown would negate the bullish triangle and could return price into an extended accumulation or downtrend phase.
---
🔥 Conclusion & Strategy:
SHELL is at the tip of the triangle, and a decisive move is expected soon. With volume gradually increasing and a healthy higher-low structure, all eyes are on whether it can break above resistance.
👉 For breakout traders: Watch for a close above the trendline with volume confirmation.
👉 For swing traders: The $0.1558 – $0.1629 range offers an ideal low-risk entry zone.
This breakout could mark the beginning of a strong reversal trend after months of decline. Don't miss this potential early entry opportunity!
---
📊 Key Levels Recap:
Strong Support Zone: $0.1629 – $0.1558
Breakout Trigger: ~$0.1842
Bullish Targets: $0.2047 → $0.2275 → $0.2400 → $0.2600 → $0.3301
Invalidation / Stop-Loss: Below $0.1558 (triangle breakdown)
---
📢 Final Note:
> "The bigger the base, the higher the breakout space."
SHELL is building a powerful base. If the breakout confirms, it could be the start of something big. Stay alert and prepare to ride the wave!
#SHELLUSDT #CryptoBreakout #AltcoinSetup #SymmetricalTriangle #FibonacciSupport #CryptoReversal #BullishChart #AltcoinWatchlist
MyShell Signals: Bottom Confirmed Rise ConfirmedWhat you see here is a big, classic, Adam & Eve bottom pattern.
First the rounded bottom followed by the pointed-bottom. And this reveals the market will change its trend coming from a classic signal.
What you see on this chart is a perfect falling wedge pattern (orange). This reveals an upcoming bullish breakout, the breakout leading to a new uptrend.
Then you can see a perfect higher low (purple trendline). Coupled with a reversal candle and continuation with a full green candle after the higher low, 22-June, is in. A strong combination of bullish signals but I can show you more.
The full green candle 23-June pushed SHELLUSDT daily above EMA8 and EMA13.
There was high volume 9-June. The highest volume day in months.
There is also a resistance baseline that was conquered around 0.1380. All bullish but still early. SHELLUSDT is still trading at bottom prices compared to what you will be seeing in a matter of months.
The RSI is trending up. Notice the same falling wedge pattern...
The MACD produced a bullish cross after a major higher low. This is all ultra, hyper bullish of course.
When so many bullish signals are combined together, it simply leaves no room for doubt; Crypto is going up.
MyShell is trading at bottom prices with many confirmed signals, soon to grow.
Thank you for reading.
Namaste.
