Bearish Flag Forming — Potential Continuation to the DownsidePrice action suggests a bearish flag is forming after a sharp impulsive move down. The current rising channel looks corrective rather than impulsive, which is typical behavior before continuation to the downside.
This asset shows classic pump & dump characteristics: a fast vertical pump, followed by heavy distribution and weak consolidation. Such structures statistically favor further decline once the flag breaks down.
Bearish scenario:
– Breakdown below the lower flag support confirms continuation
– Downside targets:
🎯 $2.20
🎯 $1.00
As long as price remains inside the flag, volatility compression continues. A loss of support would likely trigger accelerated selling.
MYX

Deep corrections are expected for MYX (12H)The MYX token has risen without supportive market structure and mainly through spike-driven moves. After a major bearish CH and the formation of a liquidity pool above the chart, it is now prone to further corrections.
It is expected to move from the supply zone toward the target levels marked on the chart.
It’s advisable not to hold this asset or maintain a bullish outlook on it.
This coin is highly volatile, so use low leverage, scale into positions in multiple entries, and strictly follow your stop-loss.
A daily candle closing above the invalidation level will invalidate this analysis.
Do not enter the position without capital management and stop setting
Comment if you have any questions
thank you

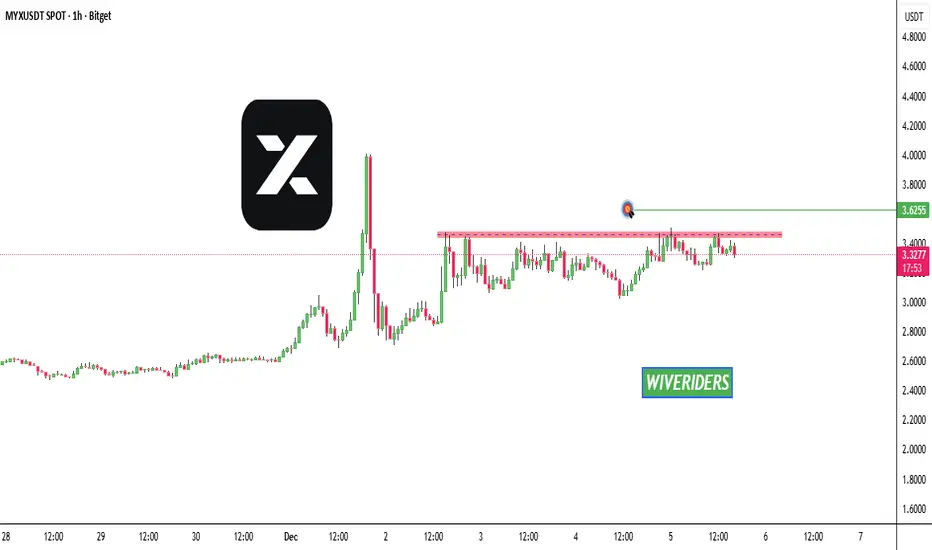
MYX is testing the red resistance zone again🚨📊 MYX Update
MYX is testing the red resistance zone again 🔴.
If a breakout occurs, the first target will be the green line level 🟩🎯.

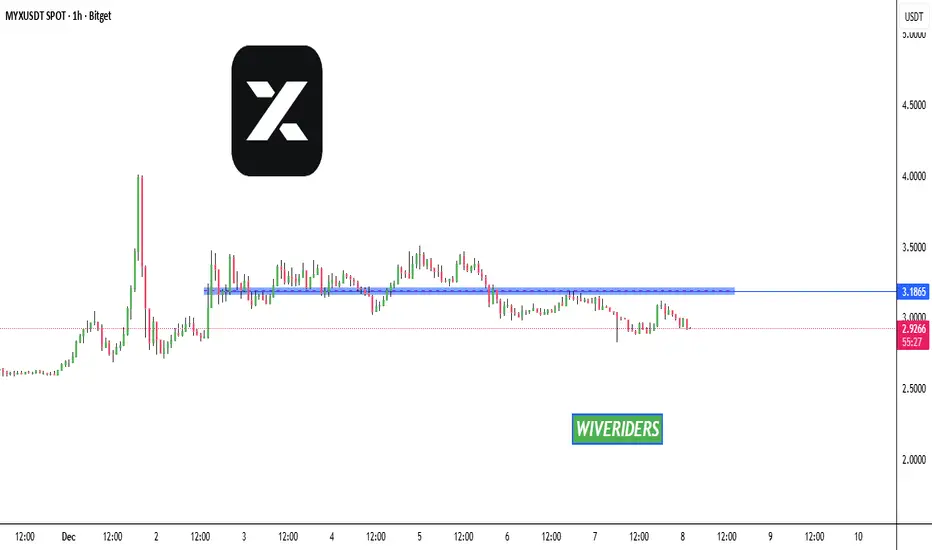
MYX has broken below the blue support level 🚨📊 MYX Update
MYX has broken below the blue support level 🔵⬇,
showing sellers are taking control of the move.
This breakdown increases the chance of further downside
unless buyers quickly reclaim this zone.
MYX is testing a strong red resistance zone🚨📊 MYX Update
MYX is testing a strong red resistance zone 🔴,
a level where sellers have stepped in multiple times before.
Price is slowing down as it reaches this zone,
showing that this is a key decision area for the next move.
If buyers manage to break above this resistance,
the first target will be the green line level 🟩🎯.
But if rejection happens again, price could pull back.
Watch this zone closely — it will determine the next direction.
MYX/USDT 4HOUR CHART UPDATE !!MYX/USDT has broken out of the 4H symmetrical triangle and is now retesting the breakout area around 3.1–3.2, making the bullish setup valid as long as this zone holds.
The price compressed between a descending resistance line and an ascending support line for weeks, then finally broke above the upper boundary and made a local high near 3.4–3.5 before retracing.
The ascending base trendline currently intersects just below 3.0; this, combined with the old triangle top near 3.1, creates the necessary support for a breakout.
Buyers defend 3.0–3.1 and move back up from here, then continue the uptrend towards 3.8–4.0, followed by 4.5 and 5.0 as indicated by the arrows.
A clear 4H close below 3.0 and inside the triangle would turn this into a fakeout and reveal a lower level with rising support, so that zone is a logical invalidation for the current bullish bias.
DYOR | NFA

MYX Analysis (1D)From the point where we placed the red arrow on the chart, the MYX correction has begun.
The corrective phase is either an ABC pattern or a more complex structure. We are currently in Wave B of this phase. Wave B itself is an ABC, where Wave B of B formed a triangle that has now completed, and the price is currently in Wave C of B.
If the price reaches the red zone, we will look for sell/short positions.
The targets are marked on the chart.
A daily candle closing above the invalidation level will invalidate this analysis.
For risk management, please don't forget stop loss and capital management
When we reach the first target, save some profit and then change the stop to entry
Comment if you have any questions
Thank You

MYX Update🚨📊 MYX Update
MYX has also formed a new resistance zone in red 🔴.
This level is now acting as a strong ceiling,
and price must break out above this red resistance
to show any real bullish momentum again.
Until that breakout happens,
sellers remain in control and upside stays limited.

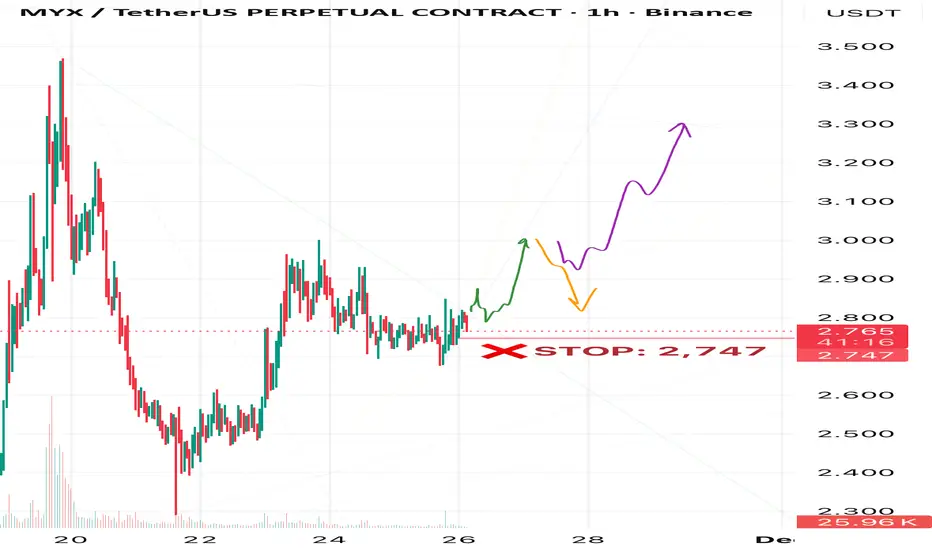
Potential Upside in MYXHi friends! How’s your trading day going?
I spotted an interesting setup in MYX. In my view, it’s at a low start, ready to rocket 🚀
🎯Main target: 3
📈Potential upside: 3.3 and higher
🎬Two scenarios after reaching the main target : follow the orange or purple arrows on the chart
❌Plan invalidation zone: 2.747
⚠️As always, trade carefully — stop-losses are a must. Risk management is key!
Let’s see what the chart shows! 📈
MYX Update🚨📊 MYX Update
MYX is testing the red resistance zone 🔴.
If price breaks out above this level,
we can expect a move back toward the green zone target 🟢.
This resistance remains the key level that must break
for bullish continuation.

MYX Update🚨📊 MYX Update
MYX has broken out of the red resistance zone 🔴 —
a strong bullish signal.
With this breakout confirmed, the first target now sits at the
green line level 🟢.
Momentum is shifting, and buyers are taking control.

MYX - BULLISH LEG UP INCOMING? Is LSE:MYX ready for another leg up? 🚀
Technical analyses outlook:
-Bull div RSvI Daily ✅
-Solid support forming above the 2.500$ level✅
-85% down from Triple TOP weekly resistance!
-H1 Triangle structure Breakout ✅
-Bullish morning star candle daily? 💣
In my opinion, as long as prices consolidate above the green zone , we could see another bull rally like 50%+! 📈
Do you have Any informations about the project, dev etc...?

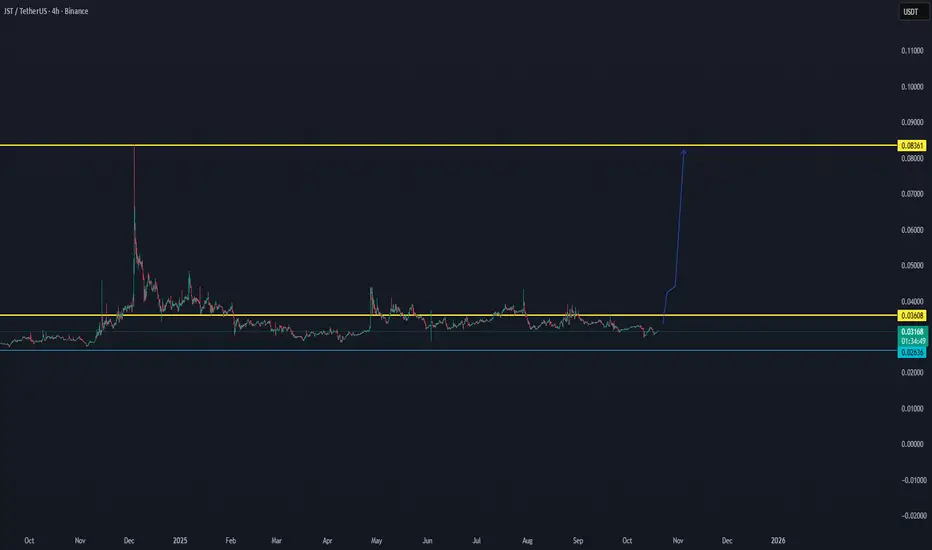
JST/USDT Second BREAKOUT ON WAY..Data view shows that there is a high chance JST can break out for the second time since the last volume data. We will follow these coming time frames to see what is able to do.
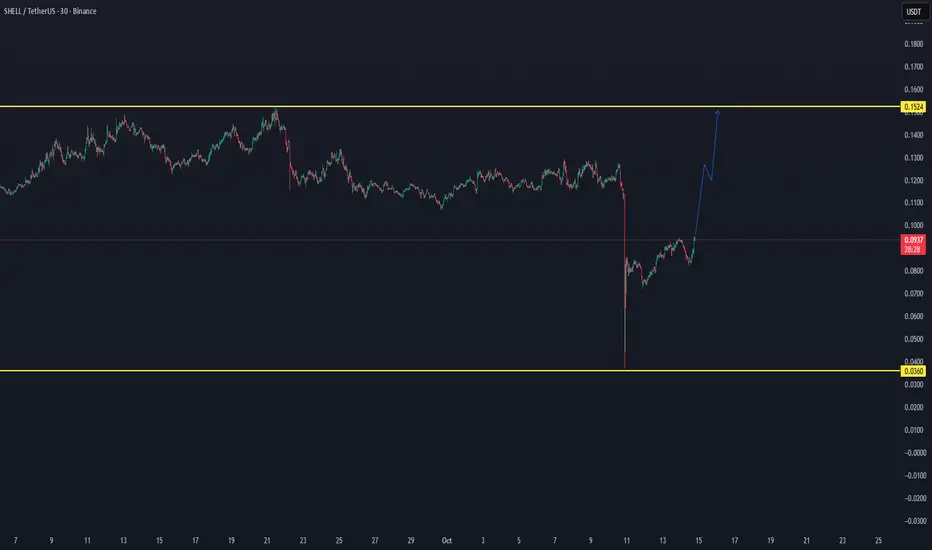
SHELL/USDT — Breakout Setup Building, Eyes on $0.1524SHELL/USDT — Breakout Setup Building, Eyes on $0.1524 🚀
SHELL has formed a clear bottom structure and is now showing early signs of trend recovery after a sharp correction. The price is currently reclaiming strength above the $0.09 level, suggesting a potential shift in short-term momentum.
📊 Technical Overview:
Support zone: $0.0360
Current price: $0.093
Breakout target: $0.1524
A breakout above $0.10–$0.11 could confirm a new upward phase, opening the path toward the $0.1524 zone, which acts as the next significant resistance level.
Momentum indicators and price structure indicate that buyers are gradually stepping in — pointing to a possible continuation move if volume supports the trend.
📈 Bias: Bullish setup forming
🎯 Targets: $0.115 → $0.1524
🕓 Watch for confirmation: A 4H close above $0.10
COAI DID ONE OF THE BEST INCREASES - NEXT ONE AVL:USDTChainOpera AI (AI/USDT) — From Our First Scan to Explosive Gains 🚀
We first scanned ChainOpera AI at just $0.38, and since then it has delivered an incredible surge, reaching new highs above $4.00+ — a massive performance move backed by strong momentum and trend continuation.
📈 Our First Scan: $0.38
💥 Current Levels: $4.32
🔥 Gain: +1000%+
The same technical setup and market structure now appear to be forming on AVL/USDT, showing early signs of accumulation and breakout potential similar to what ChainOpera AI showed before its explosive run.

THE LAST ALV CHART: Binance + Burning the Key — 2025 Will Be ...ALV/USDT Final Chart — The Golden Setup for 2025
After consistent daily updates, this could be the final and most powerful ALV chart leading into 2025.
There’s a strong probability that ALV will target $0.50 on its way toward a $1.70 high in 2025.
As long as the price remains well above the secure zone around $0.11, ALV stays technically bullish and positioned for another breakout — whether early or late in the next cycle. The setup is now confirmed for a solid swing trade into 2025.
There’s also growing speculation that Binance may list ALV, especially following the surge in Binance Alpha volume. Combined with the potential for the team to burn more token supply, the technicals and fundamentals align perfectly — making ALV one of the most promising breakout candidates for 2025.
🔥 ALV could truly be the golden chart of the year.

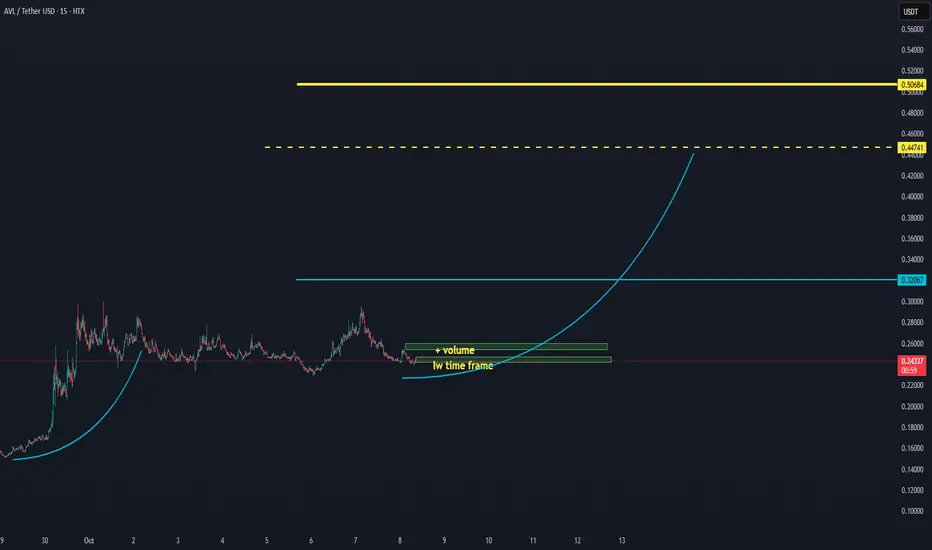
AVL has successfully moved above the low time frame - 08-10-2025AVL has successfully moved above the low time frame zone, showing renewed bullish momentum supported by increasing volume. This indicates growing interest and accumulation in this range — often a precursor to a larger breakout move.
📈 Low Time Frame Zone: Now acting as new support — showing price stability and strength.
🔊 Volume Increase: Rising volume confirms participation from buyers, suggesting the beginning of a potential reversal phase.
🎯 Next Key Targets:
$0.32 — first structural resistance and confirmation zone
$0.44–$0.50 — extended upside targets if momentum sustains
Technical Summary:
✅ Trend: Reclaiming structure above LTF zone
📊 Volume: Expanding (bullish signal)
🟢 Bias: Bullish
🎯 Targets: $0.32 → $0.44 → $0.50
Outlook:
AVL is showing early signs of recovery as it climbs above its low time frame range with increasing volume support. If this momentum continues, a move toward $0.32 could trigger a strong breakout phase targeting the upper resistance zones.
MYX Update📊 MYX Update
MYX is testing the blue support level 🔵
If it breaks out, the first target will be the green line level 🟢
Potential short opportunities ⚠️

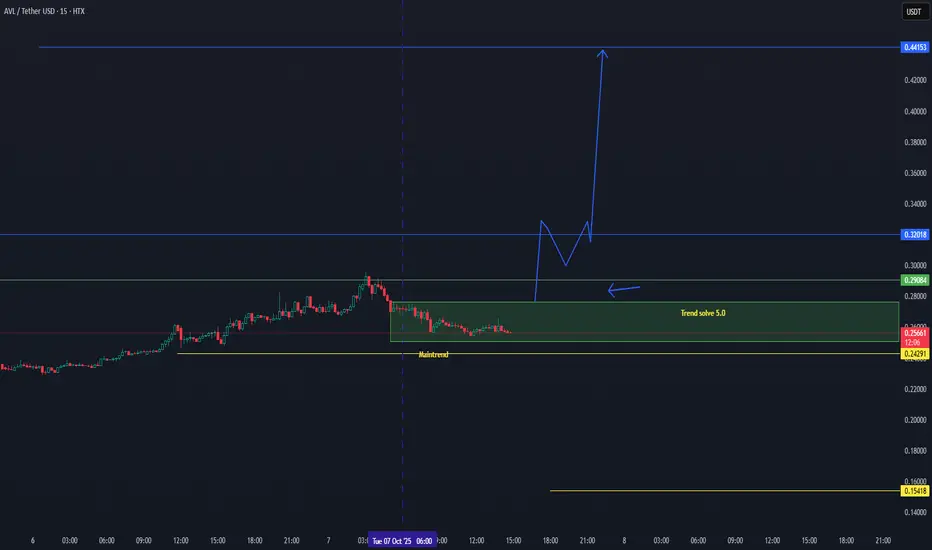
AVL/USDT — In the Solve Zone, Breakout Imminent BEST 2025AVL/USDT — In the Solve Zone, Breakout Imminent 🚀
There is a good chance for 1 time whale candle breakout.
AVL is currently trading inside the “Trend Solve 5.0” zone, showing strong signs of accumulation before a potential breakout. The market is coiling tightly within structure — an indication that momentum is building for a decisive move.
🟢 Main Trend Support: $0.24 — Holding firmly, maintaining bullish structure.
⚙️ Solve Zone Active: Price is consolidating between $0.25–$0.29, a key setup area before expansion.
📈 Breakout Confirmation: A clear move above $0.29 could trigger a strong bullish wave toward the next major resistance at $0.44.
🔄 Pattern Structure: Price forming a potential M-to-V recovery, often signaling a sharp upside continuation once confirmed.
Technical Outlook:
✅ Main Trend: Active and healthy
⚙️ Current Phase: Solve Zone accumulation
🎯 Breakout Target: $0.44
🧭 Invalidation: Below $0.24 (main trend break)
Summary:
AVL remains in a critical technical position — the Solve Zone is nearly complete, suggesting a breakout can occur at any moment. Momentum indicators and price structure both support a potential upside expansion once $0.29 is cleared.
📊 Bias: Bullish
📈 Focus Level: $0.29 Breakout
🎯 Next Major Target: $0.44
AVL Technical Setup Signals Full Bullish Activation — 07-10-2025AVL/USDT — Cycle Activated, Bullish Structure Targeting $0.55 🚀
AVL has officially confirmed activation across all key phases — cycle, main trend, and low time frame — signaling strong bullish momentum building up. The breakout structure now positions AVL for a potential multi-target move.
✅ Cycle = ON: The broader market cycle has restarted, marking the beginning of a new accumulation-to-expansion phase.
✅ Main trend support: Price continues to hold firmly above the main trend zone near $0.24, confirming strong structural support.
✅ Breakout level tested: AVL is testing the $0.29–$0.30 breakout zone, a key trigger for continuation toward higher targets.
✅ Open space above: Once price clears $0.30, resistance remains light up to the $0.50–$0.55 region.
Technical Targets:
🎯 Target A: $0.32
🎯 Target B: $0.44
🎯 Target C (main goal): $0.50–$0.55
Outlook:
Momentum is aligned across all timeframes, and the activation of the full cycle indicates AVL could be entering its next major bullish phase. As long as price remains above $0.24, the bias stays strongly bullish toward the open space above.
📊 Bias: Bullish
⚙️ Structure: Cycle Activated → Breakout Confirmation
📈 Expecting: Strong expansion move toward $0.50–$0.55

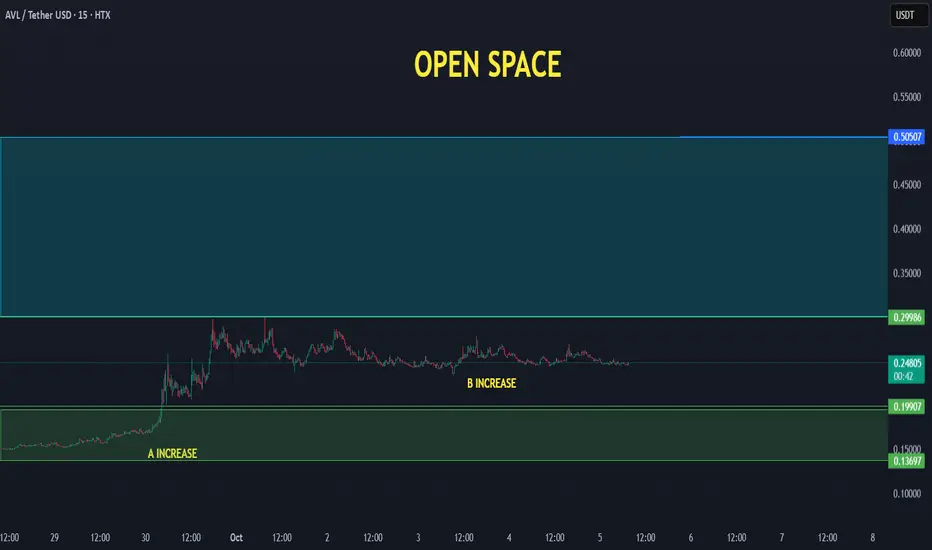
AVL Set to Surprise Investors with Massive Breakout $0,50+AVL Set to Surprise Investors with Massive Breakout Potential — Target $0.50 🚀
We are going to follow it as we did follow BTC below 110K to up to 124K
AVL/USDT continues to build strength after confirming its B increase phase, holding firm around the $0.24 – $0.26 range. This consolidation is happening just below a large open space zone, suggesting that a strong move could follow once momentum returns.
✅ A & B increase structure confirmed: The market shows a repeating cycle pattern, preparing for a C leg breakout.
✅ Open space to $0.50: Once AVL breaks above $0.30, there is very little resistance until $0.50, creating room for a powerful rally.
✅ Volume stability: Current sideways accumulation supports the potential for a sudden move as liquidity builds.
Technical Outlook:
As long as AVL holds above $0.24, bullish momentum remains intact. A breakout above $0.30 could ignite a sharp move toward the $0.50 target zone — aligning with prior high-volume cycles.
📈 Bias: Bullish
🎯 Targets: $0.30 → $0.42 → $0.50
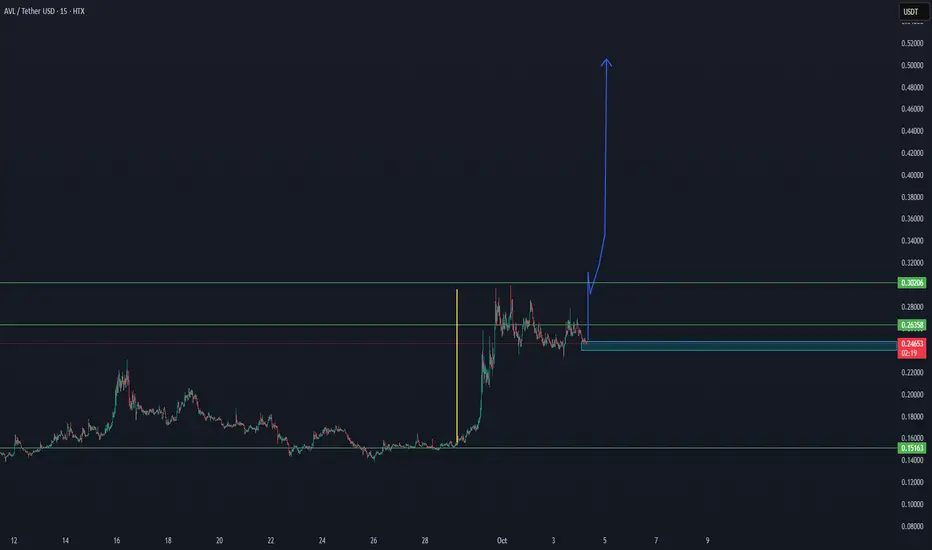
AVL ON WAY TO THE TARGET $0,50 - UPDATE 04-10-2025📊 AVL/USDT Update
AVL is consolidating above key support and holding structure, with price currently around $0.24.
✅ Support around $0.26 – $0.24 is holding.
✅ As long as this zone remains intact, momentum favors another bullish leg.
📈 The next major resistance sits at $0.30, and a successful breakout from there opens the way toward the $0.50 target.
⚡ Outlook: Structure is bullish, and the chart suggests AVL could push to $0.50 in the coming cycle if momentum continues.
AVL/USDT (AVALON LABS) WILL THE BURN SYSTEM BREAKOUT THIS COIN..This is a cycle update with the DCA effect.
The coin has entered a new DCA phase, which includes the possibility of a decrease in supply. A reduced supply could support higher prices, especially with the team’s burning mechanism that has already been implemented in part. If the burning system continues as expected, there is a strong chance that the price of this token could soon target $0.50.
✅ Fact: Avalon Labs has already conducted significant burns (e.g., ~80M AVL and later ~14M AVL), which reduced supply.
✅ Possible outcome: If they continue burning tokens and demand remains stable or grows, the reduced supply could push the price upward — mathematically, $0.50 is a reasonable short-term target (especially given the ~$0.26–0.27 current range).
