Potential Upside in MYXHi friends! How’s your trading day going?
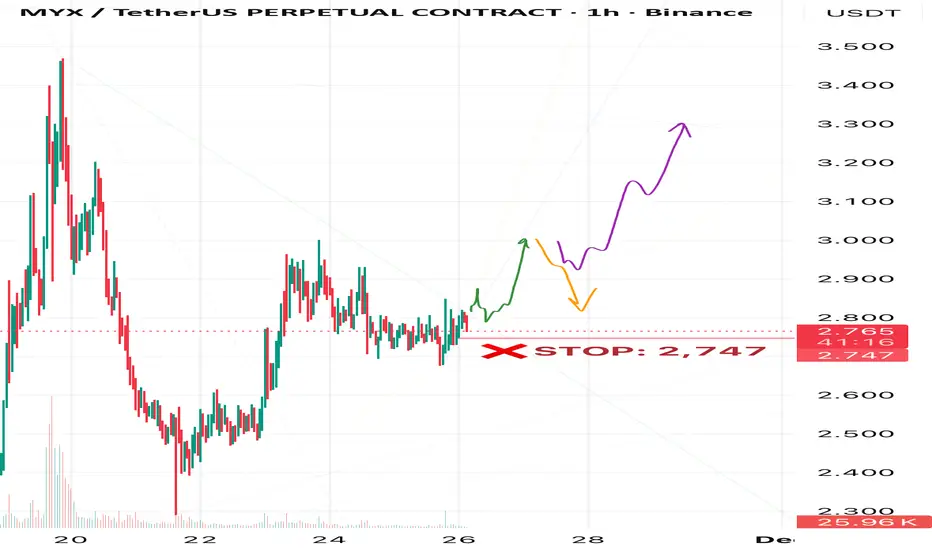
I spotted an interesting setup in MYX. In my view, it’s at a low start, ready to rocket 🚀
🎯Main target: 3
📈Potential upside: 3.3 and higher
🎬Two scenarios after reaching the main target : follow the orange or purple arrows on the chart
❌Plan invalidation zone: 2.747
⚠️As always, trade carefully — stop-losses are a must. Risk management is key!
Let’s see what the chart shows! 📈
Myxusdtperp
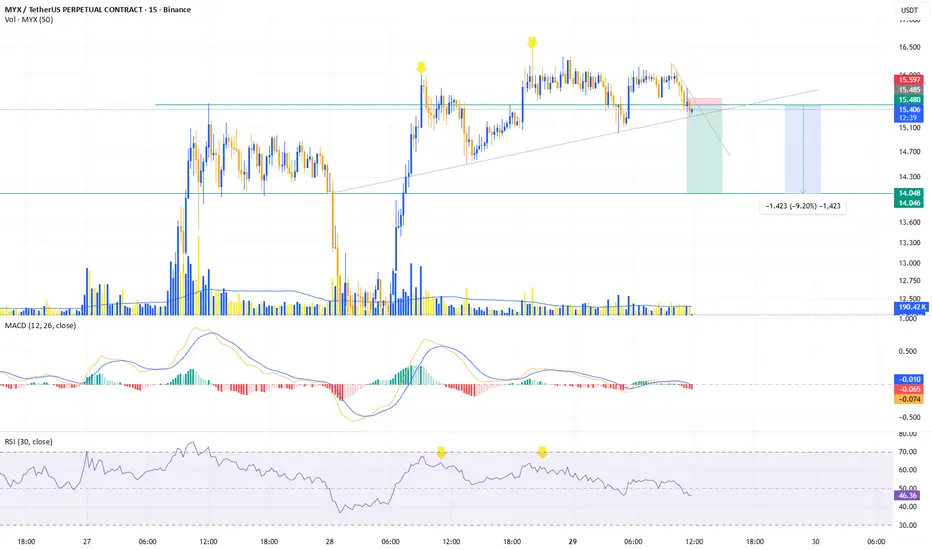
MYXSUSDT.P Short IdeaUpdate on MYXUSDT Journal Entry #16.1
Disclaimer: These charts are for educational purposes only and not financial advice. Trade at your own risk.

MYXUSDT.P Short Idea??Journal Entry #16
The chart shows a bearish convergence signaling a possible shorting.
Disclaimer: These charts are for educational purposes only and not financial advice. Trade at your own risk.
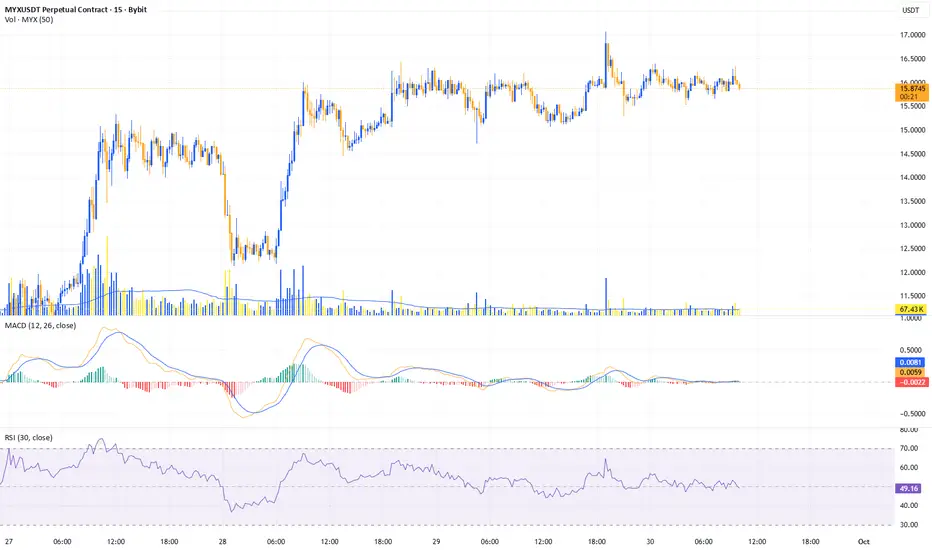
MYXUSDT Shorting Idea??Journal Entry #13
The chart market vs indicator shows bearish divergence,
if this breaksdown the trendline, im hoping to short the market.
3 Altcoins That May Hit All-Time Highs In First Week Of October
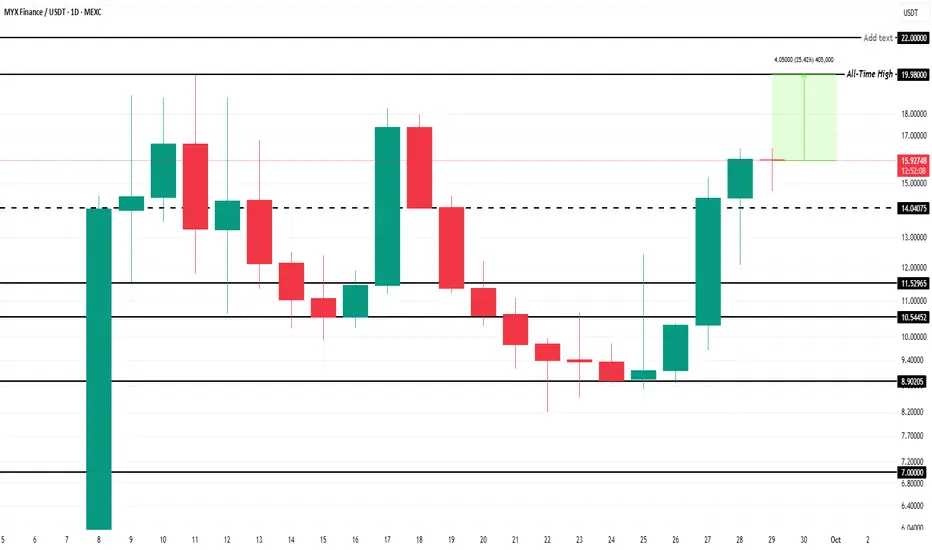
MYX appears ready to aim for a new high, sitting 25.4% away from its next resistance. The altcoin has secured $14.04 as a strong support level, giving investors confidence that upward momentum could continue if broader market conditions align with bullish sentiment.
A further rally will depend on both market support and investor activity. If momentum builds, MYX could retest its $19.98 all-time high and surpass it. Breaking past this critical resistance level would open the door for a move toward $22.00, signaling stronger upside potential in the near term.
However, if MYX fails to maintain $14.04 as support, the bullish outlook could quickly collapse. The altcoin risks falling back toward $10.54, which would mark a significant retracement. Losing this support level would invalidate the bullish thesis.
MYXUSDT longed and Scalped lolJournal Entry #11.
From the Consolidation (boxed below), it did the usual:
1. Fake-out
2. Liquidity Grab thingy.
I was out for a while so i didn't get to ride it.
Good thing it still wants to breakout. Hence, scalped.
Good Sunday everyone.

MYX - Bitcoin Divergence Could Lead to 48% Price Recovery
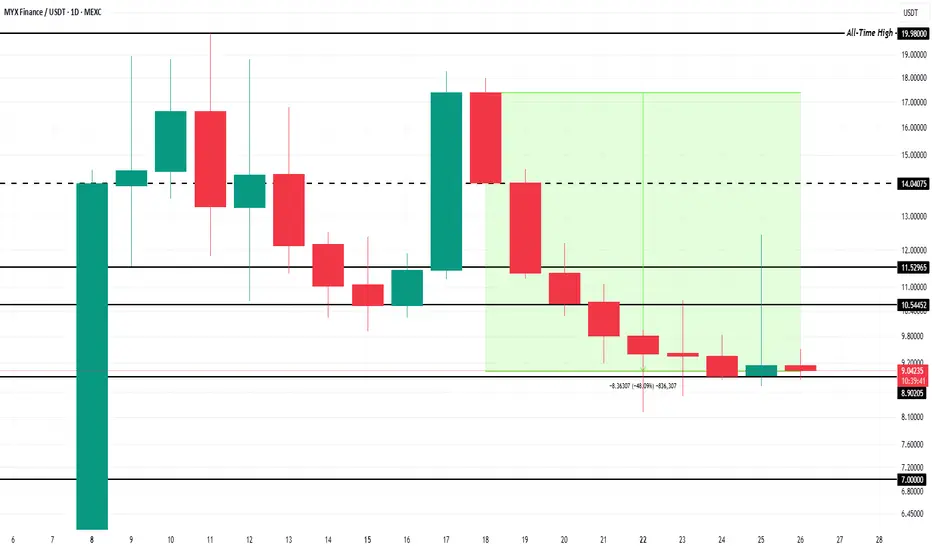
MYX is currently priced at $9.03, holding just above the critical $8.90 support. The altcoin’s decline came after failing to breach its all-time high of $19.98, leaving it nearly halved in value. Holding above $8.90 will be essential for recovery attempts.
If the bullish signals play out, MYX could rebound from support and break through resistance at $10.54. Clearing this level would open the path toward $14.04, helping the token erase much of its recent 48% decline. Strong demand will be key to sustaining this move.
However, downside risks remain. If investors withdraw support, MYX could slip below $8.90 and extend its decline toward $7.00 or lower. Such a move would invalidate the bullish thesis and place the altcoin back into a heavy downtrend.
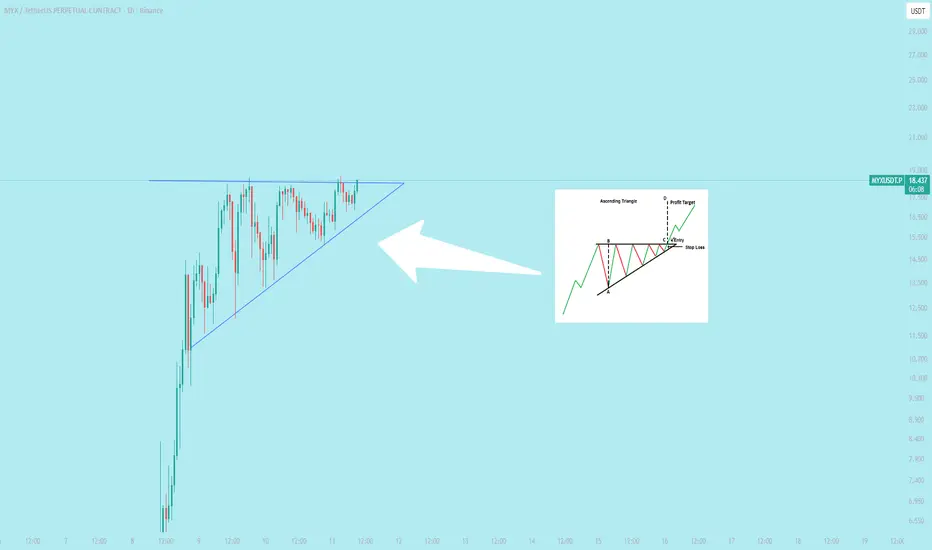
$MYX Performing Ascending Triangle Chart PatternsHow to Trade an Ascending Triangle
Here’s how traders can approach a stock that’s forming an ascending triangle pattern.
Step 1: Identify the Pattern Formation
To find an ascending triangle pattern, look for a stock that had a strong uptrend and is now trading sideways. A horizontal area of resistance should be clearly visible in the chart, while drawing trendline across the stock’s lows should yield an ascending line.
Step 2: Wait for the Breakout
Ascending chart patterns can take weeks to months to fully develop. Each new test of the resistance area has the potential to break out, but traders should be wary of false breakouts. A sustained breakout will typically be accompanied by above-average trading volume. The closer the ascending trendline comes to meeting the horizontal resistance line, the more likely a breakout is to occur.
Step 3: Enter a Trade
Traders can enter a bullish trade once a breakout is confirmed.
Step 4: Exit the Trade
The expected price movement of the breakout is equal to the price difference at the widest part of the ascending triangle pattern. You can measure the distance between the resistance area and the lowest low at the start of the pattern and add that to the resistance area to calculate a profit target for the trade.
Same Setup, Bigger Boom Incoming?The price action here is telling a clear story. Every time LSE:MYX spends time moving sideways, quietly accumulating in a range, it eventually launches into a powerful breakout. We can see it happened once, then again — each consolidation phase built up energy, and when that energy released, the market ripped higher.
Right now, the same pattern looks to be repeating. Price is sitting inside a tight range once again, showing signs of healthy consolidation. If history is any guide, this could be the calm before another explosive move.
Accumulation → Boom.
Accumulation → Boom.
And now…? The setup looks like it’s preparing for the next chapter.
DYOR, NFA
#PEACE
Stay tuned for more update

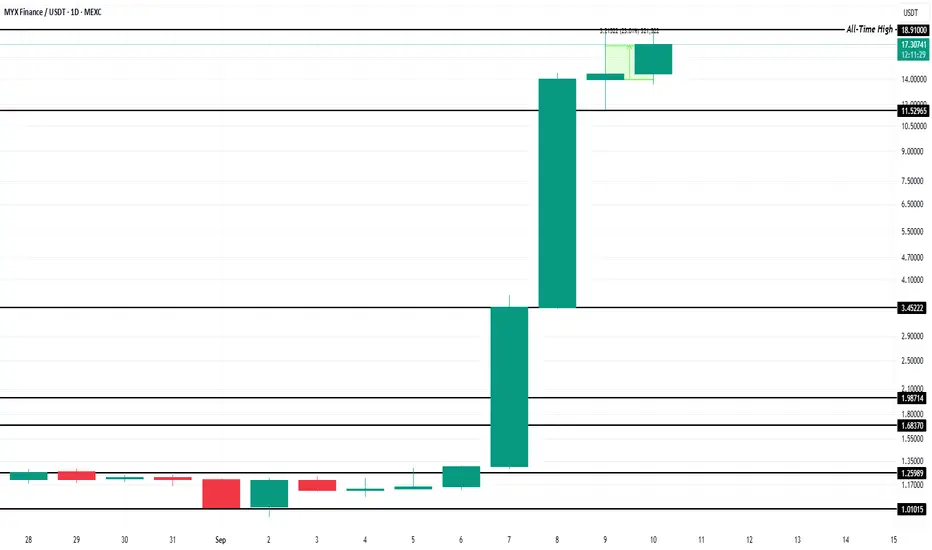
MYX Finance Price Nears ATH Post 22% Rise But Reversal Is LikelyAt the time of writing, MYX trades at $18.22 after surging 30% in the past 24 hours. The token recently set a new ATH on Tuesday and is now just shy of reclaiming that milestone, with momentum favoring another upward push.
Still, the threat of reversal looms. Historically, tokens entering fresh ATH zones often transition from accumulation to profit-taking phases. If investors book profits aggressively, MYX could retreat toward $11.52 or even lower, erasing part of its recent gains.
Conversely, if holders remain resilient and resist selling pressure, MYX could breach its ATH of $18.91 and push past $20.00. Such a move would invalidate the bearish outlook, setting the stage for another leg higher.
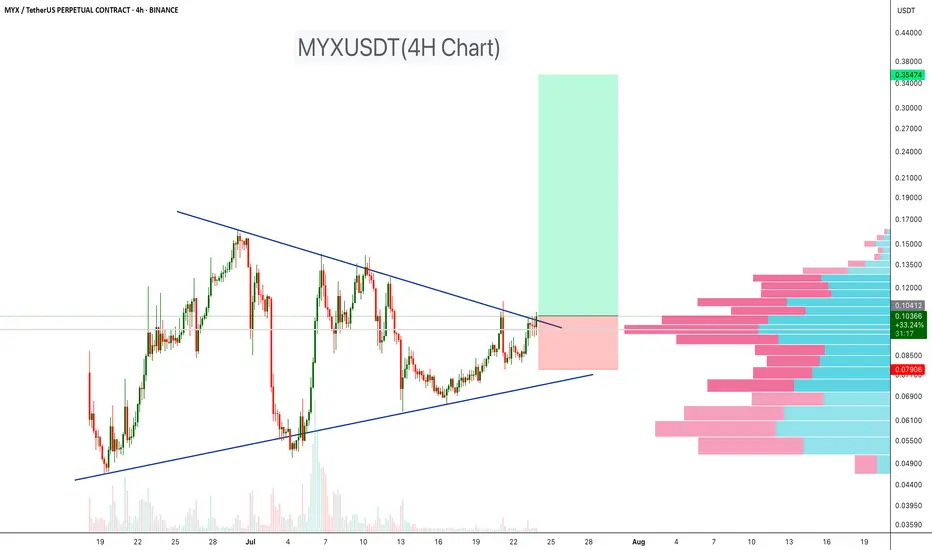
MYXUSDT Triangle Breakout!MYXUSDT is breaking out of a well-defined symmetrical triangle on the 4-hour timeframe, after weeks of consolidation between tightening trendlines. The breakout is occurring just above a high-volume node, as shown on the right-side volume profile, which now acts as a strong demand zone and potential support for continuation.
Price is currently holding above the breakout level ($0.105), with solid momentum and improving volume, indicating a potential trend expansion toward the projected target zone near $0.35.
Cheers
Hexa