Buy Citizens Financial GroupShort Term Trading Advice by Naranj Capital
Buy Citizens Financial Group
● Buy Range- 60 - 61
● Target- 64 - 65
● StopLoss- Below 58
● Potential Return- 5-7%
● Duration- 12-14 Trading Days
Naranjcapital

Buy Charles Schwab CorporationShort Term Trading Advice by Naranj Capital
Buy Charles Schwab Corporation
● Buy Range- 100 - 100.5
● Target- 106 - 107
● StopLoss- Below 97
● Potential Return- 5-6%
● Duration- 12-14 Trading Days

Buy BiogenShort Term Trading Advice by Naranj Capital
Buy Biogen
● Buy Range- 178 - 180
● Target- 188 - 190
● StopLoss- Below 180
● Potential Return- 5-6%
● Duration- 12-14 Trading Days

Walmart Stays Strong, Ready for the Next LeapWalmart is proving once again why it remains one of the strongest companies in the world. Even as many retailers struggle, Walmart continues to grow, innovate, and win the confidence of investors.
Its stock is already up 22% this year, beating the S&P 500, and many signs show that the company could stay strong in 2026 as well.
◉ Why Walmart Is Winning
Walmart has become a perfect mix of traditional retail and modern technology.
Strong results:
● Revenue up 5.8% year over year
● Operating income up 8%
● EPS rising from $0.58 to $0.62
Market share growth:
Walmart gained more customers in grocery and general merchandise. Even higher-income shoppers have been spending more at Walmart.
E-commerce strength:
Online sales grew 27% as Walmart expands its online offerings and reaches customers beyond its stores.
Growing advertising business:
Walmart’s ad sales increased 53% in the latest quarter, turning it into a serious player in retail advertising.
◉ Technology Is Shaping Walmart’s Future
Walmart is investing heavily in technology to stay ahead:
● Partnering with OpenAI to let customers use ChatGPT for shopping and checkout
● Training developers to code faster with AI
● Automating supply chains and warehouses
● Buying Vizio to strengthen its advertising ecosystem
These changes are helping Walmart protect its low-price model while moving closer to becoming a tech-driven retailer.
◉ Leadership and Listing Changes
Two important updates were recently announced:
● CEO Doug McMillon is stepping down after ten years
● John Furner, head of Walmart U.S., will become the new CEO
Walmart also announced that it will move its stock listing from the New York Stock Exchange to the Nasdaq. This connects Walmart more closely with tech-focused indexes and funds.
◉ Dividend Stability
Walmart is a Dividend King, raising its dividend every year for more than 50 years. This adds strong stability for long-term investors.
◉ Technical Outlook
● From a technical point of view, the stock recently broke out of an ascending triangle pattern and touched a new all-time high.
● If this momentum continues, Walmart could see another strong rally in 2026.
◉ Final Thoughts
Walmart is winning today and building an even stronger position for the future. With solid financials, strong e-commerce growth, expanding advertising revenue, and steady leadership changes, the company is well-placed for 2026 and beyond.

Gold & Silver Are On Fire Right Now!🌕 Gold is up — heading towards its fourth straight monthly gain, hitting a fresh two-week high on expectations of an upcoming rate cut by the Federal Reserve.
💎 Silver just smashed a new all-time high — zooming to $56.78/oz, rallying ~16.6% this month alone!
📈📉 With global rate-cut hopes rising, safe-haven metals are drawing fresh investor love. Whether you call it “hedge”, “insurance”, or “bullish vibe” — the trend is clear: metals are in demand.
👉 Bottom line: If you’ve been waiting for a strong entry into commodities — now might be the moment. Gold and silver are ringing the bell loud and clear! 🔔

Buy Insmed IncorporatedShort Term Trading Advice by Naranj Capital
Buy Insmed Incorporated
● Buy Range- 188 - 192
● Target- 200 - 202
● StopLoss- Below 180
● Potential Return- 4-5%
● Duration- 12-14 Trading Days

Bull Run Stumbles: S&P 500 Heads Toward a Potential Correction After a rough day on Wall Street, the S&P 500 dropped about 1.2%, pulling U.S. markets lower. But there’s more behind this fall than just profit-taking.
What’s Really Happening?
Warning Signs from Wall Street
Two top banking leaders raised caution. Morgan Stanley’s Ted Pick expects a 10–15% correction, calling it a “healthy normalization.”
Goldman Sachs’ David Solomon warned that tech stocks are showing bubble-like behavior, with prices running much faster than earnings.
AI Boom Driving Market Concentration
The AI craze and tech optimism have made a few mega-cap companies dominate the market. In fact, just 10 big tech firms now make up nearly 40% of the S&P 500’s total value, making the market more fragile.
Fed Confusion Adds to Uncertainty
The Federal Reserve is sending mixed signals — some officials talk about possible rate cuts by December, while others say rates should stay high because the economy is still strong.
Adding to the mess, a partial U.S. government shutdown has delayed key data, leaving investors and the Fed guessing about what’s really happening in the economy.
What the Chart Reveals
From a technical standpoint, the U.S. market’s rally has been nothing short of extraordinary. Since the April bottom near 4,835, the index has soared nearly 42%, touching a recent peak around 6,920 — and even gained about 12–13% before the latest (April 2025) pullback began.
But now, the momentum seems to be fading. The chart is flashing early warning signals — RSI divergence suggests that while prices made new highs, the underlying strength (momentum) did not. That often hints at a potential trend reversal.
If this weakness deepens, the index could correct swiftly by around 10%, targeting the 6,200–6,100 zone. And if the “healthy normalization” predicted by Morgan Stanley’s Ted Pick (a 15% drop) plays out, the index might slide further to around 5,700 — a level that would reset valuations to more reasonable territory after the sharp run-up.
Valuation Check
Let’s set aside all the opinions and headlines for a moment and focus on the key valuation metrics that truly help us understand the real picture of the U.S. market.
The Price-to-Earnings (P/E) Ratio — The Market’s Mood Meter
P/E Ratio = Current Market Price/Earnings Per Share (EPS)
So, Current Market Price = P/E Ratio*EPS
Currently, the S&P 500’s P/E ratio stands at 30.8x, with an EPS of $222.5.
When you multiply the two — 30.8 × 222.5 = roughly $6,800 — it perfectly aligns with the index’s recent market level.
Now, to find out what the fair value of the market should be, let’s use the 5-year median P/E ratio, which is around 25.4x.
Fair Market Price = 25.4*222.5 = 6,650.
This aligns perfectly with the technical chart levels, suggesting that a 15% correction would be a healthy pullback to help cool down the overheated U.S. market.
The Buffett Indicator — Market Cap vs. GDP
One of Warren Buffett’s favorite valuation tools compares the total U.S. stock market capitalization to the country’s GDP — essentially measuring how large the market has grown relative to the real economy.
At present, this ratio stands at around 224%, far above the long-term fair value range of 100–120%. Even when compared to its 5-year median level of 192%, the market still appears significantly overvalued.
To return to its median level, the ratio would need to drop by roughly:
100 = 16.6%
That’s roughly a 15–16% correction, which again perfectly aligns with both the technical chart signals and Ted Pick’s projection of a healthy market normalization.
The Bottom Line
The U.S. market’s extraordinary rally has been built on a mix of AI optimism, liquidity hopes, and investor euphoria, but the fundamentals are starting to whisper caution.
Both valuation metrics and technical signals point to the same conclusion — the market is stretched, and a 10–15% correction wouldn’t be a disaster; it would be a return to balance.
History shows that every overheated bull run needs a pause — not to end the story, but to give it a stronger foundation.
So if the coming months bring some red on the screen, smart investors will see it not as fear, but as the market taking a deep breath before its next big move.

General Motors: Turning Headwinds into GrowthWhen the global auto industry was rattled by tariffs, regulatory uncertainty, and the volatile EV market, many would have expected General Motors NYSE:GM to struggle. Instead, the Detroit giant did something remarkable: it turned challenges into opportunities.
In a single day after reporting earnings, GM’s stock jumped 14.7%, its biggest one-day surge in nearly six years. Investors cheered as the company’s market cap climbed near $63 billion, trading at a surprisingly low 6× earnings—a rare combination of value and growth in today’s auto sector.
◉ Steady Revenue Amid Strategic Shifts
In Q3 2025, GM posted $48.6 billion in revenue, holding steady despite headwinds. Net income fell 57% YoY to $1.32 billion, driven largely by one-time strategic charges—but the story behind the numbers was far more encouraging.
Adjusted EBIT hit $3.4 billion, which would have been about 9% if not for $1.1 billion in tariff costs—a figure right in GM’s historical “sweet spot” for North America.
Even more striking was the company’s confidence. GM raised its 2025 EBIT guidance by $1.25 billion, from $11.25 billion to $12.5 billion. The message was clear: GM is not just surviving—it’s thriving.
◉ Commanding the U.S. Market
GM’s market share in the U.S. climbed to 17%, the best third-quarter level since 2017. With 710,000 units sold (+8% YoY), the company continues to dominate high-margin segments:
● 41% share in full-size pickups
● 60% share in full-size SUVs
● 16.5% of the U.S. EV market, second only to Tesla
Remarkably, GM’s incentive spending remains low at 4% of the average transaction price, versus the industry’s 6.9%, helping preserve margins even in a fiercely competitive market.
◉ Strategic Realignment: Pragmatism Over Volume
GM isn’t chasing growth blindly. It made a $1.6 billion charge to recalibrate its EV roadmap, focusing on profitability over aggressive volume. The company:
● Repurposed the Orion Plant for ICE production
● Ended the BrightDrop commercial van program
● Scaled battery module capacity to match realistic demand
Meanwhile, a $4 billion investment across U.S. facilities increases ICE production and reduces tariff exposure—turning a potential risk into a strategic advantage.
◉ Turning Tariffs Into Opportunity
Tariffs could have been a major headache. Instead, GM’s combination of disciplined pricing, manufacturing realignment, and cost control has offset ~35% of gross tariff exposure, lowering net risk and positioning the company for even more relief by 2026.
◉ Electric Vehicles: A Calculated Path Forward
EVs remain GM’s “North Star,” but now with a sharper focus on profitability. In Q3 2025, GM sold 67,000 EVs, capturing 16.5% of the U.S. EV market. Chevrolet’s Equinox EV became the top-selling non-Tesla EV.
Management is strategically right-sizing production, aiming to reduce EV losses starting 2026 while sustaining innovation.
◉ China: A Quiet Turnaround
While the world watched Tesla, GM quietly delivered a fourth consecutive profitable quarter in China, earning $80 million in equity income. Market share rose to 6.8%, with 470,000 units sold (+10% YoY). New energy vehicle sales have grown for ten straight quarters, outperforming many global peers.
◉ Software and Services: The High-Margin Engine
GM isn’t just about cars. Its software and services segment, now nearly $2 billion in revenue, is reshaping the company’s future.
● OnStar subscribers reached 11 million (+34% YoY)
● Super Cruise users surpassed 500,000 (almost doubled)
● Deferred revenue hit $5 billion, with ~70% margins
This high-margin, recurring revenue stream is becoming a cornerstone of GM’s profitability story.
◉ Disciplined Capital & Shareholder Returns
GM’s commitment to shareholders is clear:
● $2.1 billion invested in projects.
● $1.3 billion in debt repaid.
● $3.5 billion in year-to-date share buybacks, cutting share count 15% YoY.
Strong cash flow and shareholder returns reinforce GM’s reputation as a strategically disciplined company.
◉ Risks on the Horizon
No story is complete without caution:
● EV demand may soften post-federal tax credits.
● Additional Q4 charges related to EV adjustments and BrightDrop wind-down.
● Ongoing tariff and supply chain risks.
● Warranty costs of ~$900M annually.
● Economic and consumer headwinds could impact sales and financing.
◉ The Valuation Story
Despite all this, GM trades at 6× earnings, a stark contrast to Tesla’s 200× multiple. As Morgan Stanley’s Adam Jonas observed: “GM has higher margins and higher growth than Tesla, and trades at six times earnings—not 200 times.”
◉ What the Chart Says
● The monthly chart shows a clear breakout from an Inverted Head & Shoulders pattern, signaling a potential uptrend.
● The daily chart confirms this breakout with a big gap up and strong volume, signaling robust buying interest.
◉ Looking Ahead: 2026 and Beyond
GM expects 2026 to outperform 2025, driven by:
● Lower EV losses
● Reduced warranty costs
● Full-year tariff relief
● Strong demand for high-margin trucks and SUVs
With EBIT guidance now at $12–13B, GM is poised for sustainable profitability.
◉ The Investment Takeaway
General Motors is no longer just a traditional carmaker—it has become a story of change and resilience. The company has shown it can handle global challenges, adjust its business approach, and make smart, disciplined decisions.
For investors, GM is more than a stock; it shows how a long-standing company can reinvent itself and still deliver steady returns. By balancing innovation, profitability, and careful use of capital, GM proves that strong leadership and clear focus can create lasting value—even in a tough industry.
In short, GM is a prime example of turning challenges into opportunities, making it a strong choice for investors who care about smart strategy, stability, and growth.
💬 What do you think about GM? Would you invest now or hold off? Let us know in the comments!

Buy Jones Lang LaSalleShort Term Trading Advice by Naranj Capital
Buy Jones Lang LaSalle
● Buy Range- 297 - 300
● Target- 312 - 316
● StopLoss- Below 285
● Potential Return- 4-5%
● Duration- 14-15 Trading Days

Invest in STRL: Ride the Coming US Digital Infrastructure Surge◉ Abstract
Sterling Infrastructure (NASDAQ: STRL) is a top pick to benefit from America's digital infrastructure boom, with the sector expected to grow 26% annually through 2034. The company specializes in data centers, 5G networks, and smart city projects, supported by a $1 billion backlog and improving profit margins. While risks like regional market shifts and housing demand exist, STRL's fundamentals are strong—revenue grew 7% in 2024, debt is manageable, and its P/E ratio (17.9x) looks cheap compared to peers (70.5x).
Technically, the stock shows bullish patterns after pulling back 35% from highs. With government infrastructure spending rising and strategic acquisitions likely, STRL could deliver 35-40% returns in the next 12-14 months. A good option for long term investing!
Read full analysis here...
◉ Introduction
The U.S. digital infrastructure market, valued at approximately USD 140 billion in 2024, is expanding rapidly, with a projected CAGR of 26.4% through 2034. This growth is driven by factors like the expansion of 5G networks, increased demand for data centers, rising cloud services adoption, AI automation, and investments in smart cities and edge computing. The 5G infrastructure segment alone is expected to grow at a CAGR of 20.2%, reaching USD 17.26 billion by 2030. North America holds a 42.8% share of the global market.
◉ Key Trends and Opportunities
1. Data Centers: Demand continues to rise, driven by cloud computing, AI, and data-intensive applications. Power availability and location are becoming critical, with providers moving to secondary markets to secure reliable energy sources.
2. Fiber Networks: Expansion is underway to support new data centers and remote connectivity needs. Middle-mile and long-haul fiber, as well as fiber-to-the-home (FTTH), are key areas of investment and consolidation.
3. 5G and Wireless: Ongoing rollout of 5G networks is fueling growth in hardware and network densification, with increased activity expected in wireless infrastructure and tower markets.
4. Edge Computing and Smart Cities: The proliferation of IoT devices and smart city initiatives is driving demand for edge data centers and low-latency networks.
5. Mergers and Acquisitions: The market is seeing consolidation, especially in fiber and data center segments, as major players acquire smaller firms to expand their footprint and capabilities.
Today, we’ll focus on Sterling Infrastructure (STRL), a key player navigating the U.S. infrastructure market.
This report provides a detailed look at STRL's technical and fundamental performance.
◉ Company Overview
Sterling Infrastructure Inc. NASDAQ:STRL is a U.S.-based company specializing in e-infrastructure, transportation, and building solutions. It operates through three key segments: E-Infrastructure Solutions, which focuses on site development for data centers, e-commerce warehouses, and industrial facilities; Transportation Solutions, handling infrastructure projects such as highways, bridges, airports, and rail systems for government agencies; and Building Solutions, providing concrete foundations and construction services for residential and commercial projects. Originally founded in 1955 as Sterling Construction Company, the firm rebranded to its current name in June 2022. Headquartered in The Woodlands, Texas, the company serves a wide range of sectors, including logistics, manufacturing, and public infrastructure.
◉ Investment Advice
💡 Buy Sterling Infrastructure NASDAQ:STRL
● Buy Range - 148 - 150
● Sell Target - 200 - 205
● Potential Return - 35% - 40%
● Approx Holding Period - 12-14 months
◉ SWOT Analysis
● Strengths
1. Strong E-Infrastructure Backlog – With over $1 billion in backlog, Sterling has a robust pipeline of future projects, ensuring sustained revenue growth.
2. Higher-Margin Services Shift – The company’s strategic focus on higher-margin work (21% gross profit margin in Q4) improves profitability without relying solely on volume.
3. E-Infrastructure Growth Potential – Expected 10%+ revenue growth and 25%+ operating profit growth in 2025 position Sterling for strong earnings expansion.
4. Strategic M&A Opportunities – Strong liquidity allows for accretive acquisitions, enhancing market share and service offerings.
5. Share Repurchase Program – Active buybacks reduce outstanding shares, potentially boosting EPS and shareholder value.
● Weaknesses
1. Texas Market Transition Risks – Moving away from low-bid work in Texas may slow revenue growth in the Transportation segment if not managed well.
2. Revenue Loss from RHB Deconsolidation – Excluding $236 million in RHB revenue could distort growth metrics and reduce reported earnings.
3. Residential Market Pressures – A 14% decline in residential slab revenue (due to DFW affordability issues) could persist if housing demand weakens further.
4. Geographic Expansion Challenges – High costs and logistical hurdles in expanding data center projects outside core regions may limit growth opportunities.
5. Competitive Bidding & Acquisition Risks – Difficulty in securing profitable acquisitions or winning competitive bids could hinder margin and revenue growth.
● Opportunities
1. Data Center & E-Commerce Boom – Rising demand for data centers and distribution facilities presents long-term growth potential for E-Infrastructure.
2. Government Infrastructure Spending – Federal and state investments in highways, bridges, and airports could boost Transportation Solutions revenue.
3. Strategic Acquisitions – Pursuing complementary M&A deals could expand capabilities and market reach.
4. Diversification into New Regions – Expanding into underserved markets could reduce dependency on Texas and mitigate regional risks.
5. Operational Efficiency Improvements – Further margin expansion through cost optimization and technology adoption.
● Threats
1. Economic Slowdown Impact – A recession could reduce demand for residential and commercial construction, affecting Building Solutions.
2. Rising Interest Rates – Higher borrowing costs may pressure profitability and delay large-scale projects.
3. Labor & Material Cost Inflation – Increasing wages and supply chain disruptions could squeeze margins.
4. Intense Competition – Rival firms competing for the same infrastructure projects may drive down pricing and profitability.
5. Regulatory & Permitting Delays – Government approvals and environmental regulations could slow project execution.
◉ Revenue & Profit Analysis
● Year-on-Year
➖ FY24 sales reached $2,116 million, reflecting a 7.28% increase compared to $1,972 million in FY23.
➖ EBITDA rose to $334 million, up from $264 million in FY23.
➖ EBITDA margin improved to 15.8%, up from 13.4% in the same period last year.
● Quarter-on-Quarter
➖ Q4 sales decreased to $499 million, down from $593 million in Q3, but showed a slight increase from $486 million in Q4 of the previous year.
➖ Q4 EBITDA was $80.3 million, down from $105 million in Q3.
➖ Q4 diluted EPS saw a notable rise, reaching $8.27 (LTM), up from $5.89 (LTM) in Q3 2024.
◉ Valuation
1. P/E Ratio (Price-to-Earnings)
● Current vs. Peer Average
➖ STRL’s P/E ratio is 17.9x, much lower than the peer average of 70.5x, suggesting the stock is undervalued compared to peers.
● Current vs. Industry Average
➖ Compared to the broader industry average of 22.9x, STRL again looks relatively inexpensive at 17.9x.
2. P/B Ratio (Price-to-Book)
● Current vs. Peer Average
➖ STRL’s P/B ratio stands at 5.7x, slightly higher than the peer average of 5x, indicating overvaluation.
● Current vs. Industry Average
➖ Against the industry average of 3.6x, STRL’s 5.7x P/B ratio suggests a noticeable overvaluation.
3. PEG Ratio (Price/Earnings to Growth)
➖ STRL’s PEG ratio is 0.21, which means the stock appears undervalued relative to its strong expected earnings growth.
◉ Cash Flow Analysis
➖ Sterling Infrastructure's operating cash flow grew to $497 million in FY24, up from $479 million in FY23, showing steady financial strength.
◉ Debt Analysis
➖ The company's debt-to-equity ratio is 0.38, indicating a healthy balance sheet with manageable debt levels.
◉ Top Shareholders
➖ The Vanguard Group has significantly increased its investment in this stock, now owning an impressive 8.3% stake, which marks a 30% rise since the end of the September quarter.
➖ Meanwhile, Blackrock holds a stake of around 8% in the company.
◉ Technical Aspects
➖ On the monthly chart, the stock remains in a strong uptrend.
➖ On the daily chart, an Inverted Head & Shoulders pattern has formed, signaling a potential breakout soon.
➖ The stock is currently trading at about 35% below its all-time high, making it an attractive investment opportunity.
◉ Conclusion
Sterling Infrastructure (STRL) stands out as a strong investment candidate, backed by solid financial performance, a growing E-Infrastructure backlog, and a strategic focus on higher-margin projects. Its attractive valuation, healthy cash flow, and low debt levels provide further confidence in its growth potential. While there are challenges—such as market competition, geographic expansion hurdles, and economic uncertainties—Sterling’s strengths, including a robust project pipeline, strategic acquisitions, and exposure to high-growth sectors like data centers and 5G infrastructure, offer a favorable risk-reward balance. Overall, Sterling is well-positioned to benefit from the ongoing U.S. e-infrastructure boom, making it an attractive long-term investment opportunity.

Atour: The Smart Way to Invest in China's Hospitality Market◉ Abstract
Atour Lifestyle Holdings Limited is taking advantage of China's fast-growing hotel industry. The hospitality sector of China is expected to reach $157.46 billion by 2032, growing at a rate of 8.23% each year. This growth comes from a strong economy, more people moving to cities, and an increase in travel. Atour uses a smart business model that allows for quick expansion while keeping costs low. They offer a variety of hotel brands and even sell sleep-related products.
In FY23, Atour's sales jumped to $657.4 million, a 106% increase from the previous year, along with strong earnings growth. With over 83 million members in its loyalty program and a focus on great customer experiences, Atour is set for continued success in China's hospitality market.
Overview of the Hotel Service Industry in China.
Continue reading full article here:
◉ Overview of the Hotel Service Industry in China
China's hotel service industry is on the cusp of a remarkable growth spurt, fueled by the country's soaring economy, rapid urbanization, and an unprecedented surge in domestic and foreign travel.
● Projected Market Value: $157.46 billion by 2032
● Growth Rate: 8.23% Compound Annual Growth Rate (CAGR) from 2024 to 2032
◉ What's Driving this Growth?
● Economic Growth: China's economy continues to expand, boosting disposable incomes and travel budgets.
● Urbanization: As more Chinese citizens move to cities, they're seeking better travel experiences and accommodations.
● Increased Travel: Both domestic and foreign travel are on the rise, driving demand for hotels and travel services.
As China's hotel service industry experiences rapid growth, Atour Lifestyle Holdings NASDAQ:ATAT Company has established itself as a prominent force in the market. By delivering a unique blend of comfort, style, and local charm, Atour is redefining the hospitality landscape in China.
Atour's strategic focus on mid-to-upscale hotels enables the company to provide immersive local experiences, innovative design, and exceptional service. This distinctive approach has fostered a loyal customer base and positioned Atour for continued success in China's burgeoning hotel market.
◉ Investment Advice
💡 Buy Atour Lifestyle Holdings NASDAQ:ATAT
● Buy Range - 27 - 27.5
● Sell Target - 36 - 37
● Potential Return - 30% - 35%
● Approx Holding Period - 12-14 months
◉ Business Model
Atour Lifestyle Holdings Limited utilizes an asset-light, franchise-oriented business model that enables rapid expansion and operational efficiency in China's hotel industry. Here are the key components:
● Manachised Model: Atour primarily operates through a "manachised" model, where franchisees handle capital expenditures and hotel leases while Atour provides management and training. This approach minimizes operational costs and maximizes revenue from franchise royalties.
● Diverse Brand Portfolio: The company offers various hotel brands, including Atour, Atour S, Atour X, and ZHOTEL, catering to different market segments and customer preferences.
● Retail Integration: Atour has expanded into retail by selling sleep-related products, generating significant revenue and enhancing the guest experience.
● Customer Loyalty Programs: The A-CARD loyalty program boasts over 63 million members, driving customer retention and engagement through various benefits.
● Digital Capabilities: Atour leverages technology for a seamless customer experience, allowing easy online bookings and efficient communication during stays.
● Focus on Experience: The company emphasizes delivering unique lifestyle experiences through thematic hotels and tailored offerings.
◉ Key Competitors
1. Huazhu Group (H World Group): A leading competitor with over 10,150 hotels, Huazhu operates a similar manachised model and has been expanding rapidly, making it one of the largest players in the market.
2. Jin Jiang International: With a vast portfolio exceeding 12,000 hotels, Jin Jiang is another major competitor that employs a mix of franchising and management strategies.
3. GreenTree Hospitality Group: Focused on midscale accommodations, GreenTree operates around 3,000 hotels and utilizes a franchise-based model with manachised elements.
4. BTG Homeinns Hotels: Known for its budget offerings, BTG Homeinns has a significant presence with thousands of hotels primarily targeting domestic travelers.
5. Plateno Group (7 Days Inn): Operating primarily in the budget segment, Plateno utilizes a manachised approach to grow its network of over 3,000 hotels.
These companies dominate the domestic market, while international brands like InterContinental Hotels Group (IHG) and Shangri-La Hotels & Resorts lead the high-end segment.
◉ Strategic Initiatives Powering Atour's Growth Trajectory
● Expanded Hotel Network: 140 new hotels added in Q3 and 732 under development, increasing capacity and driving revenue growth.
● Upscale Brand Introduction: SAVHE Hotel launch in core business districts, enhancing occupancy and average daily rate (ADR).
● Retail Segment Growth: 107.7% year-over-year GMV growth in 'deep sleep' products, boosting revenue and net margins.
● Membership Base Expansion: Over 83 million members, increasing revenue potential through customer loyalty and repeated business.
◉ Revenue & Profit Analysis
● Year-on-year
➖ FY23 sales reached $657.4 million, a remarkable 106% increase from $328 million in FY22.
➖ EBITDA surged to $142 million, up from $36 million in FY22.
➖ The EBITDA margin widened to 21.6% from 11.15% in the same period.
● Quarter-on-quarter
➖ Q3 sales reached $270 million, a 9% increase from $247 million in Q2 and a 52% jump from $177 million in Q3 2023.
➖ Q3 EBITDA climbed to $72.6 million, up from $56.2 million in Q2.
➖ Q3 diluted EPS rose to $0.39 (LTM) from $0.30 (LTM) in Q2 2024.
◉ Valuation
● P/E Ratio
ATAT has a P/E ratio of 24x, which is fairly valued when compared to the peer average of 23.7x.
● PEG Ratio
With a PEG ratio of just 0.15, ATAT appears to be undervalued based on its anticipated earnings growth.
◉ Profitability Analysis
With a 30.7% ROCE, ATAT demonstrates its expertise in generating substantial profits through efficient capital allocation.
◉ Cash Flow Analysis
ATAT achieves remarkable growth in operational cash flow, rising 582% to $280 million in FY23 from $41 million in FY22.
◉ Debt Analysis
ATAT's debt-to-equity ratio stands at 0.67, signaling that debt is not a significant concern for the company.
◉ Top Shareholders
➖ Mr. Haijun Wang, CEO of Atour Lifestyle Holdings, holds a significant 19.2% stake.
➖ Trip.com Group Limited holds approximately 13.6% stake.
◉ Technical Aspects
➖ The weekly chart indicates that after a long period of consolidation, the stock price has formed a Rounding Bottom Pattern and is likely to break through its strong resistance zone soon.
➖ A Pole & Flag pattern has formed on the daily chart, with the stock price targeting higher levels following a successful breakout.
◉ Conclusion
Following a thorough analysis, we believe Atour presents a lucrative investment opportunity. With its appealing valuation, impressive financial track record, and strategic growth initiatives, Atour is well-positioned to capitalize on the growing tourism sector. The company's commitment to delivering exceptional customer experiences further strengthens its potential for long-term growth and value creation for shareholders.

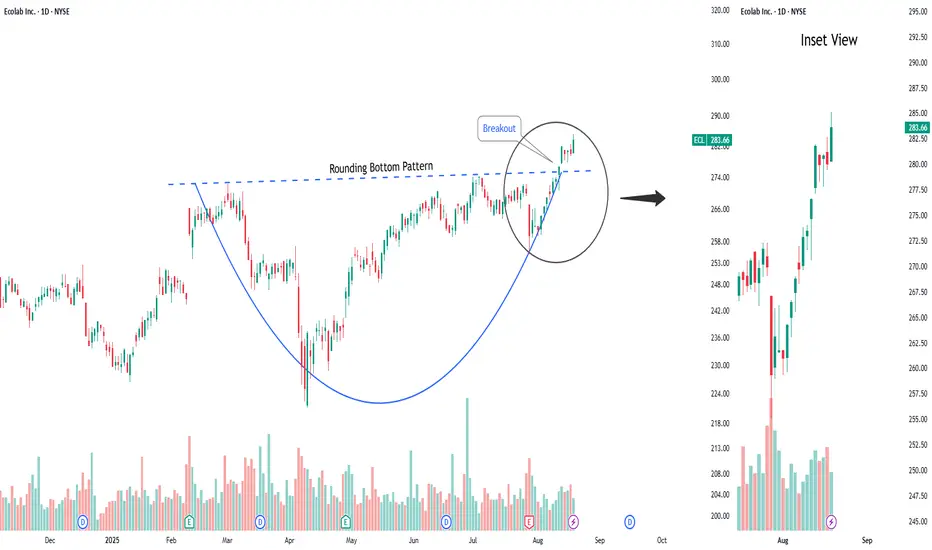
Buy EcolabShort Term Trading Advice by Naranj Capital
Buy Ecolab
● Buy Range- 282 - 285
● Target- 295 - 300
● StopLoss- Below 276
● Potential Return- 4-5%
● Duration- 12-14 Trading Days
Market Mood Sours as Inflation Surprises AgainU.S. stock markets were under pressure on Tuesday after new inflation data came in higher than expected. This has made investors rethink how soon the Federal Reserve might cut interest rates.
What Happened?
● The Consumer Price Index (CPI) recorded its biggest monthly rise in 5 months.
● Core inflation (which excludes food and energy) jumped by 2.9% compared to last year — more than the Fed's 2% target.
What It Means
● Investors had expected the Fed to cut interest rates multiple times in 2025.
● After the inflation report, they now think the Fed will cut less than expected.
● The chances of a rate cut in September also dropped sharply.
Market Impact
● Bond yields went up — the 10-year U.S. government bond yield rose to 4.49%, making borrowing more expensive.
● Stock futures fell (Dow, S&P 500, Nasdaq), as higher yields tend to hurt company profits and stock prices.
S&P 500 and Dow Struggle at Resistance
● Both the S&P 500 and Dow Jones faced resistance near all-time highs.
● This rejection suggests potential for further short-term pullback, especially if macro pressures like inflation and rate uncertainty persist.
Near-Term Outlook
With inflation running hotter than expected, hopes for early Fed rate cuts have cooled. Traders and investors should remain cautious, manage risk actively, and prepare for continued volatility in the coming weeks.

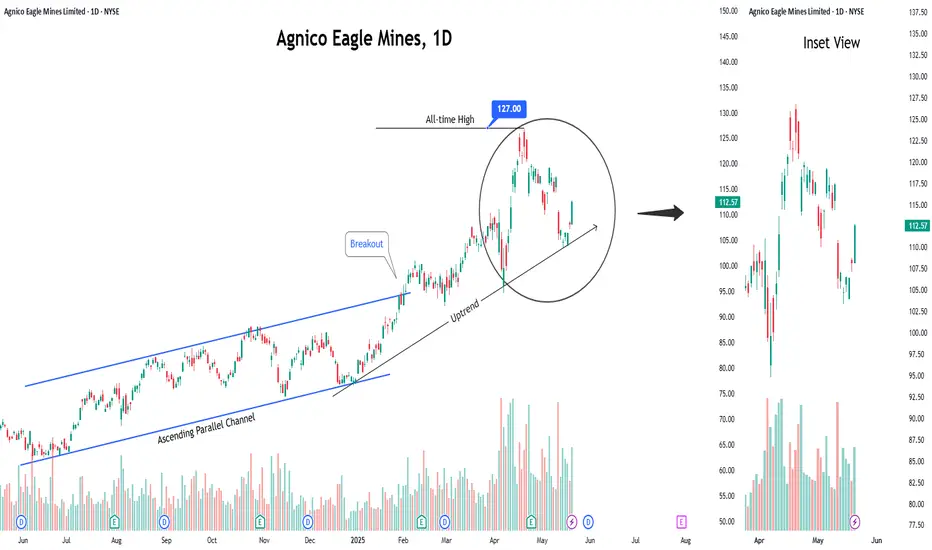
Buy Agnico Eagle Mines LimitedShort Term Trading Advice by Naranj Capital
Buy Agnico Eagle Mines Limited
● Buy Range- 108.5 - 112
● Target- 116 - 118
● StopLoss- 104.5
● Potential Return- 4-5%
● Duration- 14-15 Trading Days
Primoris Services: A Long-Term Pick in US Energy Infrastructure◉ Abstract
Our latest analysis focuses on the booming U.S. utility and energy sector, set to hit a massive $1.1 trillion! Learn about the key drivers fueling this growth, from our increasing electricity needs and the electric vehicle revolution to the exciting rise of clean energy.
We have also given a “Buy” rating on Primoris Services Corporation NYSE:PRIM , a major player in building this energy infrastructure. Our analysis reveals their strong financial performance, attractive valuation compared to its peers, and promising technical indicators. While acknowledging potential headwinds like regulatory shifts, we believe Primoris presents a compelling long-term investment opportunity with significant upside potential. Read detailed analysis here and invest smartly.
Read full analysis here...
◉ Introduction
Imagine the companies that bring electricity to your home, the gas for your stove, and are building the future of clean energy. That's the U.S. utility and energy sector! It's a massive part of the American economy, and it's getting even bigger. By 2025, experts predict it will be worth a whopping $1.1 trillion! This includes everything from generating electricity to delivering it through power lines and pipelines, as well as distributing natural gas across the country.
This sector has been steadily growing at about 2.7% each year between 2020 and 2025, and it looks like this growth is going to continue. This article will give you a snapshot of the major reasons behind this growth, top players in this sector, and investment opportunities.
◉ Major Factors Behind the Growth of US Energy Sector
1. Electricity Use is Climbing: Americans are using more power than ever. The EIA expects electricity consumption to hit 4,205 Billion kWh in 2025, up from 4,097 Billion kWh in 2024. This surge is fuelled by increased usage in residential, commercial, and industrial sectors.
2. Everything’s Going Electric: Think about electric cars, heat pumps that heat and cool homes, and even cleaner machines in factories. More and more things are switching to electricity, which means we need even more power! This big shift towards using electricity is called electrification, and it's a major driver for the energy sector.
3. Clean Energy on the Rise: Solar panels and wind turbines are becoming a bigger part of how we get our electricity. These renewable energy sources are growing fast. By 2026, it's expected that they will provide about 27% of all the electricity in the U.S., up from around 25% in 2024. This move towards cleaner energy is really important for the future.
4. Massive Investments Ahead: To keep up with this growing demand and the shift to new technologies, utility companies are investing a lot of money. They are upgrading power grids (the network of lines that deliver electricity), building charging stations for electric vehicles (EVs), and using smart technologies to manage energy better. Experts at S&P Global predict that total spending on these things could be over $790 Billion between 2025 and 2030!
◉ Big Players in Building the US Energy Infrastructure
1. Quanta Services, Inc. NYSE:PWR : A premier provider of specialized infrastructure solutions for the electric power and oil & gas sectors. They are also heavily involved in renewable energy projects like solar and wind farms. You can learn more about them on their official website .
2. Primoris Services Corporation NYSE:PRIM : They provide construction and engineering services for the energy, utility, and infrastructure markets. They are increasingly focusing on building projects related to renewable energy. You can explore their details on their official website .
3. MasTec, Inc. NYSE:MTZ : This is a top infrastructure company in North America, working on energy, utility, and communication projects. This includes building renewable energy facilities, telecom networks, and oil & gas pipelines. You can find more information on their official website .
This report offers an in-depth analysis of Primoris Services Corporation , a prominent player in the U.S. energy infrastructure space.
Our long term recommendation is backed by Primoris Services Corporation ’s technical analysis and fundamental performance.
◉ Investment Advice
💡 Buy Primoris Services Corporation NYSE:PRIM
● Buy Range - 67 - 68
● Sell Target - 88 - 90
● Potential Return - 30% - 45%
● Approx Holding Period - 12-14 months
◉ Revenue and Profit Analysis
● Year-on-Year
- In FY24, Primoris reported revenue of $6,367 Million, marking an 11% increase from $5,715 Million in FY23.
- EBITDA grew to $415 Million, up from $366 Million the previous year, with the EBITDA margin slightly improving to 6.5% from 6.4%.
● Quarter-on-Quarter
- Q4 FY24 revenue reached a record $1,741 Million, up from $1,649 Million in Q3 and 14.9% higher than $1,515 Million in Q4 FY23.
- Despite the revenue growth, Q4 EBITDA declined to $110.6 Million from $123 Million in Q3.
- Diluted EPS (LTM) rose to $3.30 in Q4, up from $3.00 in Q3 FY24, indicating solid earnings momentum.
◉ Valuation
1. P/E Ratio (Price-to-Earnings)
● Compared to Peers:
- PRIM’s P/E is 17.9x, much lower than the peer average of 32.7x. This means the stock is cheaper than most competitors based on earnings.
● Compared to Industry:
- With a P/E ratio of 17.9x, PRIM trades below the industry average of 26.4x, suggesting it offers strong value within the sector.
2. P/B Ratio (Price-to-Book)
● Compared to Peers:
- PRIM’s P/B is 2.6x, while peers average 4.5x—again showing the stock may be undervalued.
● Compared to Industry:
- Compared to the industry average of 4.4x, PRIM still appears to be a bargain.
3. PEG Ratio (Price/Earnings to Growth)
PRIM’s PEG ratio is 0.43, which suggests the stock is not only cheap but also expected to grow earnings strongly—an attractive combination for investors.
◉ Cash Flow Analysis
- Primoris saw a strong improvement in operating cash flow, which jumped to $508 Million in FY24 from $196.8 Million in FY23—a sign of better cash generation from its core business.
◉ Debt Analysis
- With a debt-to-equity ratio of 0.42, the company maintains a solid financial position, suggesting its debt levels are well under control and not overly risky.
◉ Top Shareholders
- The Vanguard Group holds a substantial 11.6% stake in Primoris, reflecting strong confidence in the company.
- BlackRock also increased its investment by 9.65% from Q3 FY24 and now owns approximately 11.3% of the company.
◉ Technical Aspects
- On the monthly chart, the price is in an overall uptrend and has bounced off the trendline support, indicating continued upward momentum.
- On the daily chart, the price has broken through a rounding bottom pattern and is holding above the breakout zone, suggesting a potential for further upside movement.
◉ Potential Risks & Challenges
1. Regulatory Uncertainty: Ongoing concerns about global trade policies, tariffs, and regulatory changes, especially in the solar and battery storage markets, could impact future project economics and timing.
2. SG&A Expenses: Increased by $10.9 Million year-over-year, driven by higher personnel costs and $3.2 Million in severance expenses.
3. Energy Segment Backlog: Experienced a decrease due to the timing of new solar awards, potentially affecting future revenue visibility.
◉ Conclusion
Primoris Services Corporation NYSE:PRIM stands out as a promising investment, backed by consistent growth, strong financials, and a strategic focus on renewable energy and infrastructure. Despite facing risks like regulatory changes and backlog fluctuations, its solid position in the U.S. energy sector—especially with increased demand for clean energy solutions—gives it a clear path forward. With a competitive valuation and support from major investors like Vanguard and BlackRock, Primoris is poised for sustainable growth, making it an attractive long-term opportunity for investors.

Buy Agnico Eagle Mines LimitedShort Term Trading Advice by Naranj Capital
Buy Agnico Eagle Mines Limited
● Buy Range- 116 - 119
● Target- 125 - 126
● StopLoss- 112
● Potential Return- 5-6%
● Duration- 14-15 Trading Days

Gold on the Go: Prices Set to Surge Amid Uncertainty● Gold prices have recovered from a 6.5% fall and are now trading above $3000 per ounce.
● Tariff developments and US President Trump's comments are influencing market sentiment and gold prices.
● A record $21 billion inflow into Gold ETFs was recorded in Q1 2025, indicating strong interest in gold as a safe-haven asset.
● Technical analysis suggests a key support level for gold prices between $2950 and $2960, which could impact market trends.

Head & Shoulder Breakdown: Will S&P 500 Drop Another 10%?● The S&P 500 has experienced significant volatility recently, mainly due to President Donald Trump's announcement of new tariffs.
● On April 3, 2025, the index saw a nearly 5% drop, its worst single-day loss in five years.
● The recent price action suggests that the index has broken below the neckline of the Head and Shoulder pattern, indicating a potential continuation of the downward trend.
◉ Key support levels to watch
● 1st Support - 5,200 - 5,250
● 2nd Support - 4,950 - 5,000

Euro Rises Above $1.09 Despite Tariff ThreatsThe euro climbed above $1.09, showing unexpected strength after President Trump announced 20% tariffs on all EU imports.
◉ Fundamental Rationale
● The currency got a boost because the U.S. dollar weakened. Trump’s tariffs made trade tensions worse and worried people about slower economic growth.
● Also, new numbers showed Eurozone inflation fell to 2.2% in March, the lowest since November 2024.
● This lower inflation means the European Central Bank doesn’t need to raise interest rates, making the euro more appealing to investors.
◉ Technical Observation
● From a technical perspective, an inverse head and shoulders pattern has formed, hinting at a possible trend reversal.
● A breakout above $1.095 could pave the way for stronger bullish momentum.

Buy Brinker InternationalShort Term Trading Advice by Naranj Capital
Buy Brinker International
● Buy Range- 151 - 156
● Target- 166 - 169
● StopLoss- 145
● Potential Return- 6-8%
● Duration- 14-15 Trading Days

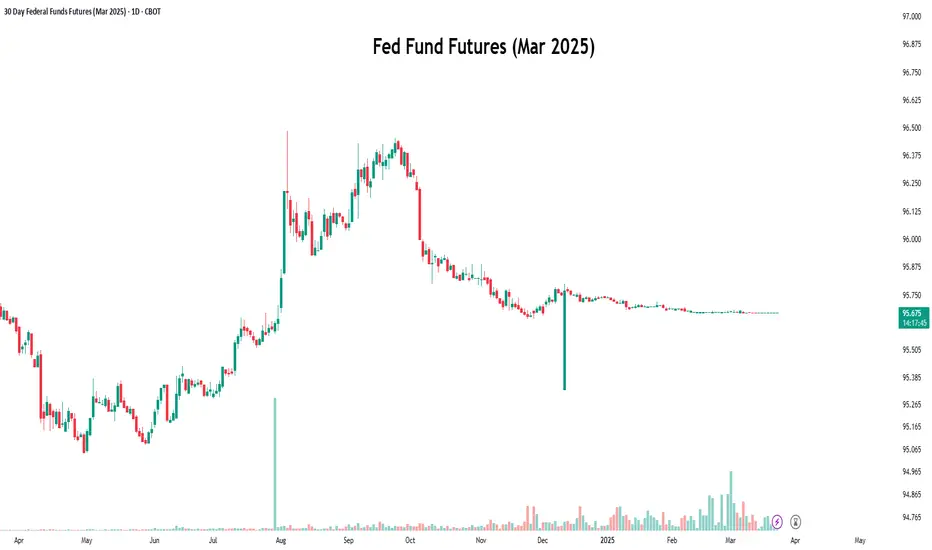
Decoding Fed Rate Changes via Federal Funds Futures Index◉ What Are Federal Funds Futures?
● Definition: Federal Funds Futures are financial contracts traded on the Chicago Mercantile Exchange (CME) that allow market participants to bet on or hedge against future changes in the federal funds rate (the interest rate at which banks lend to each other overnight).
● Purpose: These futures reflect the market's expectations of where the Fed will set interest rates in the future.
◉ How Federal Funds Futures Work?
● Pricing: The price of a federal funds futures contract is calculated as 100 minus the expected average federal funds rate for the contract month.
➖ Example: If the futures price is 95.00, it implies an expected federal funds rate of 5.00% (100 - 95 = 5).
● Contract Expiry: Each contract represents the market's expectation of the average federal funds rate for a specific month.
◉ Why Use Federal Funds Futures?
● Predict Fed Policy: Traders and investors use these futures to gauge the likelihood of the Fed raising, cutting, or holding interest rates.
● Hedge Risk: Institutions use them to protect against potential losses caused by interest rate changes.
● Market Sentiment: They provide insight into what the broader market expects from the Fed.
◉ Steps to Analyze Fed Policy Using Federal Funds Futures
● Step 1: Check Current Federal Funds Futures Prices
Look up the prices of federal funds futures contracts for the months you're interested in. These are available on financial platforms like Bloomberg, Reuters, or the CME Group website.
● Step 2: Calculate the Implied Federal Funds Rate
Implied Federal Funds Rate = 100 - Futures Price.
➖ Example: If the futures price for March is 95.5, the implied rate is 4.5% (100 - 95.5 = 4.5).
● Step 3: Compare Implied Rates to the Current Rate
If the implied rate is higher than the current federal funds rate, the market expects the Fed to raise rates. If it's lower, the market expects a rate cut.
● Step 4: Estimate the Probability of Rate Changes
By comparing the implied rates of contracts expiring before and after an FOMC meeting, you can estimate the probability of a rate change.
➖ Example: If the implied rate for March is 4.75% and the current rate is 4.5%, the market is pricing in a 25 basis point (0.25%) hike.
● Step 5: Monitor Changes Over Time
Track how futures prices change over time. Shifts in prices indicate changes in market expectations. For example, if futures prices drop (implying higher rates), it suggests the market is anticipating a more hawkish Fed.
◉ Practical Applications
● Trading: Traders use federal funds futures to speculate on interest rate movements.
● Economic Forecasting: Economists use them to predict the Fed's monetary policy and its impact on the economy.
● Investment Strategy: Investors adjust their portfolios based on expected rate changes (e.g., shifting from bonds to equities if rates are expected to rise).
◉ Limitations of Federal Funds Futures
● Market Sentiment: Futures prices reflect market expectations, which can be influenced by sentiment and may not always accurately predict Fed actions.
● External Shocks: Unexpected events (e.g., geopolitical crisis, pandemics) can disrupt rate expectations.
● Liquidity: Less liquid contracts (further out in time) may not accurately reflect expectations.
◉ Example Analysis
Let’s assume:
➖ Current federal funds rate: 4.5%
➖ March federal funds futures price: 95.5
● Step 1: Calculate the implied rate:
100 − 95.5 = 4.5%.
● Step 2: Compare to the current rate:
The implied rate (4.5%) is equal to the current rate (4.5%), suggesting the market expects no change in rates by March.
● Step 3:
If the futures price drops to 95.25, the implied rate becomes 4.75%, indicating the market now expects a 25 basis point rate hike..
◉ Why This Matters?
● For Traders: Federal funds futures provide a direct way to bet on or hedge against interest rate changes.
● For Investors: Understanding rate expectations helps in making informed decisions about asset allocation.
● For Economists: These futures offer valuable insights into market expectations of monetary policy.
◉ Conclusion
Federal funds futures are a powerful tool for analyzing and predicting the Fed's interest rate decisions. By understanding how to interpret these futures, traders, investors, and economists can gain valuable insights into market expectations and make more informed decisions. However, it's important to consider their limitations and use them in conjunction with other economic indicators for a comprehensive analysis.
Gold Falls from Peak, but Rate Cut Hopes Keep Outlook Positive● Gold prices fell after hitting a high at $3057.59 due to a stronger US dollar, making it more expensive for overseas buyers.
● Despite this, gold is set for its third consecutive weekly gain, up 0.7% this week.
● Market participants expect at least two US Federal Reserve rate cuts this year, supporting gold's long-term bullish outlook.
◉ Technical Observations
● While moving through the rising parallel channel, the price has just faced resistance from the upper boundary and is expected to have a pullback towards $2,950.
● If the price slips below this level, the next strong support is expected near $2,790.

Gold Prices Rise as Inflation Fears Subside◉ Fundamental Rationale
● Gold prices remain steady despite a strong US dollar, supported by a softer-than-expected US CPI report.
● The US CPI report showed a 0.4% rise, lower than the forecasted 0.5%, easing inflation concerns.
● Weaker US inflation data reduces the likelihood of a rate hike, making gold more attractive to investors.
● The strong US dollar, fueled by a surge in US Treasury yields, failed to dent gold's appeal.
● Prices are expected to remain supported as investors seek safe-haven assets amid economic uncertainty.
◉ Technical Observations
● Gold prices have broken free from a Symmetrical Triangle pattern and surged upward.
● Currently trading near all-time highs, the rally is expected to continue, propelling prices beyond the previous high.
