USNAS100: Consolidation Near 25720 Ahead of CPI & EarningsUSNAS100 | Market Overview
U.S. stock index futures edged lower ahead of key U.S. inflation data and Q4 earnings from JPMorgan Chase, which will kick off the earnings season. Investors remain cautious as both events may significantly influence the interest-rate outlook and short-term market direction.
TECHNICAL VIEW (USNAS100)
Volatility is expected to remain elevated ahead of today’s inflation release.
Price is currently consolidating between 25720 and 25835, awaiting a breakout.
📈 Bullish Scenario
Bullish bias remains valid while trading above 25720
A 1H candle close above 25835 would confirm upside continuation toward:
25985 - 26170
📉 Corrective / Bearish Scenario
A 1H candle close below 25720 would trigger a correction toward:
25510 - 25250
Key Levels
Pivot Line: 25720
Resistance: 25835 – 25985 – 26170
Support: 25510 – 25250
NAS

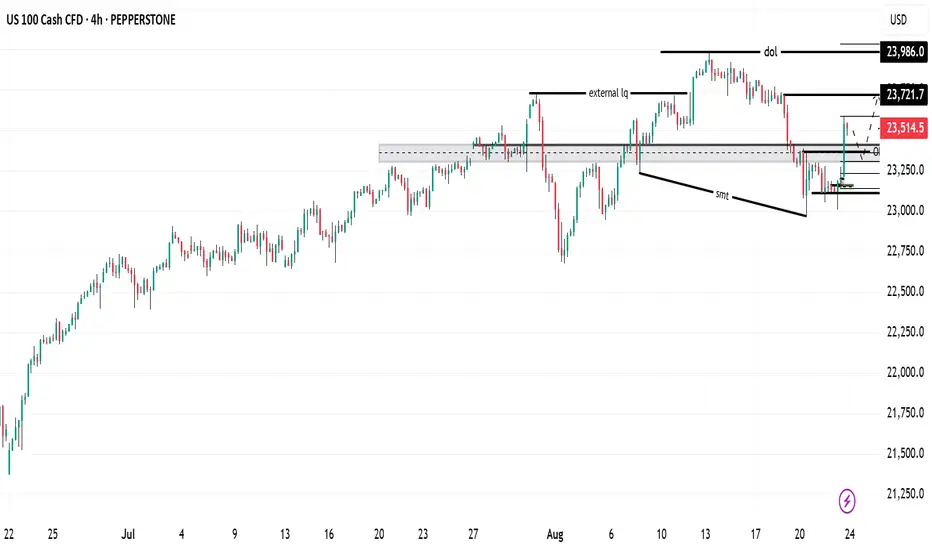
US100 - Short SetupI would love to see this continue it's bearish theme, obviously the stock market open volume is what really drives this instrument. If we can stay in this position and follow a theme as indicated with the path arrows on the chart, this may well be one of the best entries this year!
We have banked a bit of profit now and running this risk free. We may be able to get multiple entries from this original signal, or in the case this resistance zone breaks and we get the remaining position tapped at entry, we have 25,250 sell zone to fall back on.

Bitcoin Time-Channel CyclesYellow = 1064d expansion
Green = 658d mean node
Blue = 364d compression
This chart documents a repeating BTC time-channel structure built from prior cycle highs and lows. The goal here is not to force a price prediction, but to show that Bitcoin has been respecting a consistent rhythm in time and slope across multiple market regimes. When the previous major ATL is used as the anchor, the next macro expansion phase has repeatedly aligned with a ~1064-day duration. That expansion window is displayed as the larger corridor, and it has now shown up cleanly from the 2015 ATL into the 2017 ATH, from the 2018 ATL into the 2021 ATH, and again from the 2022 ATL into the 2025 ATH..
Inside each 1064-day expansion corridor, a secondary time node appears at roughly 658 days, which is the golden-ratio contraction of the full expansion cycle. What’s notable is that price has not been randomly positioned at this midpoint in time. Instead, it has repeatedly migrated back to the mean of the rising channel near the 658 day mark, acting like a structural equilibrium reset within the broader uptrend. This “mean hit” behavior is visible across cycles and is one of the main reasons to watch time geometry alongside price geometry. After the mean-hit, the market has historically rotated into the final leg of the expansion phase before completing the cycle high.
Following each macro high, the bearish compression phase has clustered around ~364 days, shown as the blue corridor. These reset windows are materially shorter than the expansion windows, which matches the observed tendency for bullish advances to build over years while bearish phases compress into faster, more volatile declines. The expansion to compression ratio is close to 3:1, reinforcing the idea that the market “inhales” slowly and “exhales” quickly in time. The important takeaway is that the model is not asking price to obey a specific number; it’s showing how price has behaved inside repeating time-based corridors, with the mean of the channel acting as a magnet around the 658 day node.
This framework is shared as a structural study, not a guarantee. Markets can mutate, and no historical symmetry is permanent. However, when a time-channel sequence repeats cleanly across multiple cycles, it becomes a useful way to frame expectation, especially for identifying where equilibrium touches and regime shifts are statistically more likely to occur. If this rhythm continues to hold, future cycle windows can be mapped the same way, with the emphasis placed on time-based decision zones and mean reactions rather than on any single price target.

1:11 Trade idea;Nasdaq
A good zone for big trades
Its an instituional level, a lot of agressive buyers

NQ Shorts IncomingYM approaching 4H imbalance, ES could sweep asian session high and play into previous OB while NQ sweeps london session liq and mitigates asian session OB

NQ Bias | October 15, 2025NQ perpective after mass liquidity sweep again. Correlation w/ other indices as well.

Nasdaq 100 Eyes 24,550–25,050 if Fed Signals Dovish ToneUSNAS100 – Technical Overview
The Nasdaq remains in focus as traders await the Federal Reserve’s rate decision later this week.
Markets largely expect a 25 bps cut, but the key driver will be Chair Powell’s tone on inflation, labor-market weakness, and tariff risks.
Earlier record highs across U.S. indexes were fueled by tech strength and optimism over U.S.–China trade talks, while gold’s surge to new highs underscores strong safe-haven demand.
Technical Outlook
📉 Correction phase
Price is expected to retest 24,240 → 24,115 before attempting another bullish leg.
A sustained drop below 24,110 would expose deeper support at 23,870.
📈 Bullish continuation
Holding above 24,240 – 24,115 keeps the broader uptrend intact.
Once consolidation is complete, a renewed rally targets 24,550 → 24,800, with a potential extension to 25,050 if the Fed delivers a more dovish message.
Key Levels
Pivot: 24,380
Resistance: 24,550 – 24,800 – 25,050
Support: 24,240 – 24,115 – 23,870
📌 Market Context:
A 25 bps Fed cut may offer moderate support for tech-heavy indices, while a more aggressive 50 bps cut could accelerate the next breakout toward fresh ATHs. Conversely, a hawkish tone from Powell could trigger a deeper correction before the next leg higher.

USNAS100 Holds Below 24,115 as Fed Rate Decision LoomsUSNAS100 – Overview
Markets are awaiting the upcoming Federal Reserve rate decision, which will set the tone for the next move:
A 50 bps cut would likely trigger strong bullish momentum.
A 25 bps cut may result in a more moderate reaction.
📉 Bearish scenario: For now, the Nasdaq shows bearish momentum while trading below 24,115, with downside targets at 23,935 → 23,870 → 23,700.
📈 Bullish scenario: A confirmed 1H close above 24,115 would shift bias bullish, opening the way to 24,245 → 24,350.
Key Levels
Pivot: 24,115
Resistance: 24,245 – 24,350
Support: 23,940 – 23,870 – 23,700

NAS still charging HighsEverything explained in video, please let me know if I may have missed any details!

nas100 on fire📊 NASDAQ 100
The market has recently reacted from the weekly pd arrays (internal lq) now market will hunt buy sides liquidity (external lq) and bellow my expectition using a differnt concepts po3, weekly profile, pd arrays matrix ,weekly and daily bias... new weekly opening gap will be a good zone for buys oppotunities .... follow me to get analysis day by day
SHORT ON US30US30 Has given us a nice CHOC (Change of Character) to the downside.
This indicates a huge potential of US30 dropping more after it pulls back into the supply zone that created the change.
Dollar news is also a catalyst today for this play. If news comes out good for PMI and makes the dollar rise... US30 could fall almost 3000 points over the next few days.
Take Advantage.

NAS and Oil Down - Minimal DrawdownQuick thoughts and reasons for trades taken with almost zero drawdown
Nas Short/Oil Short Trades

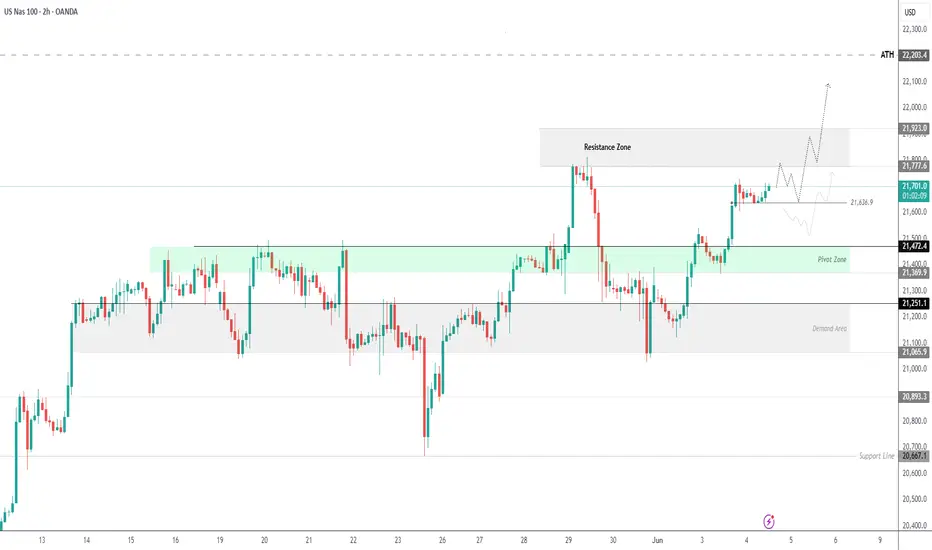
USNAS100 – Bullish Scenario Valid Above 21640, Targeting 21920USNAS100 | Technical Analysis
The price initiated a bullish trend after breaking above 21470, as previously mentioned. It is now continuing toward the target at 21770.
Currently, price is approaching the resistance at 21775.
If it fails to break above and stabilizes below 21775, we may see a consolidation within the range of 21775–21640.
🔺 A 1H close above 21775 may trigger a continued bullish move toward 21920 and 22100.
🔻 A 1H close below 21640 could lead to a correction down to 21475.
Resistance: 21775, 21920, 22100
Support: 21640, 21510, 21370
Nasdaq giving hints of bearishness failing to close above rangePlease review what I think I'm seeing. If you have any comments in regard to these potential levels they are always welcome.
I believe we may be actually bearish from here but without a daily close below the highest block, my decided choice must be neutral. Purely mechanical analysis will save your portfolio 💎
Don't forget to subscribe & share this with someone who is learning 🙏🏾

NASDAQ MEGA BOUNCE ZONEI want to see a super bounce from this demand zone tomorrow due to the recent reactions around this price level. Lots of interest being shown here. I am sized in pretty heftily on MNQ futures. In a $0 or HERO position. WIll be closing my laptop now...

NAS still charging for bullish targets but currently retracingWe are looking at a retest of break points on the session. Going into this session we will monitor what happens at the previously broken levels.
We do have bearish imbalances in LTFs that have yielded neat entry on shorts. Stay sharp in this range.
Share with someone in need on true levels 🔑

[How to] Trade Recap: NAS Short in Asia--quick 70 pips!⚡️ Easy quick short in Asia. Thank you Honk Kong 🙏🏾
Share this with anyone willing to learn the truths of candlestick analysis ✨

Post CPI Update: NAS still very well behaved in this range🎯 As previously mentioned, we were expecting the bearish imbalance to be the magnetic area. Price in this chart is behaving just as it should. As well with bearish imbalance or FVG, we expect price to find it as a trend continuation point.
If we do not get a bullish close over the previous day, we will expect a swift attack of the lows in the coming PA.
Share this with a friend who's learning 🧠

Intraday Update: Indices may be ready for the SMT reversal👀 Clearly we have a bullish reversal from the clearing of a previous daily imbalance range. Of course we expect NAS to get a head start on achieving it's buyside targets and that's just what we get on today.
🧼 Clean buyside ideas happening although we are technically still bearish on the daily until we get a higher close over a previous daily block. This is fine, it just means we will still see heavy bearish flow above lower time frame highs until then no sweat!
Share this with someone trying to learn 🫡

NAS (Indices) still bleeding for sellside correction🙏🏾 As promised in our simple bias methodology, our bearish daily closes are still allowing for the big boys to be adamant about reaching sellside goals for better buy prices
Share with a friend who needs the true levels 🎯

GOLD, NAS, & BTC Daily Overview: Whole Market BleedingDXY is fundamentally bullish but this recent bearish retrace has allowed us to put risk on for a few weeks but the last few sessions have been hungry for correction.
We all know that before we can continue to rally, it will be wise to allow the market to collect more supporters at better pricing. This alongside inefficient price delivery zones will make easy targets for sellside revisit market wide.

LONG ON NAS100Nas is oversold and has rejected a major demand area.
I will be buy nas to the next resistance level

SHORT ON NASToday Im selling nas.
I made good money on the drop from yesterday.
Price has since pulled back into discount and tapped into supply.
News for PMI is coming out which is (expected) to be positive.
I will be selling nas this morning looking to catch at least 1000 points.
