Beyond the Chart - NAS100 Through Technicals & FundamentalsCAPITALCOM:US100 US100 | Trendline + FVG Setup 🎯
Trend’s still bullish short-term, but momentum’s fading rejection hit right inside that upper FVG.
Below 24,920–25,000, I’m eyeing a pullback toward 24,760s for liquidity sweep.
🔥 Rejection + imbalance fill = bearish continuation on deck.
CPI, PPI & shutdown talks = fuel for volatility this week.
NASDAQ 100 CFD
NAS100 Analysis: Trend, VWAP, Three-Drive Pattern, and Fibonacci📹 In this video, we take a detailed look at the NASDAQ/NAS100, which is currently in a strong bullish trend 📈. While the momentum is impressive, price may now be overextended, so caution is important ⚠️.
🔎 I share how I incorporate the VWAP, three-drive patterns, and the Fibonacci retracement tool to help plan high-probability trades 🎯.
📊 We also cover trend analysis, price action, and market structure, giving you a full breakdown of how these indicators work together to identify potential setups 🚀.
⚠️ Disclaimer: This content is for educational purposes only and not financial advice. Always trade responsibly and manage your risk.

Wall Street pauses after record highs as investors await Fed sigWall Street pauses after record highs as investors await Fed signals
U.S. stocks were little changed Oct 7, easing after the S&P 500 and Nasdaq closed at record highs, as traders looked to upcoming Federal Reserve remarks for policy cues. Gains have slowed amid stretched valuations and uncertainty caused by the government shutdown, now in its seventh day.
Markets continue to price in a 25-basis-point Fed rate cut later this month, supported by signs of labor market softness, though the data blackout has limited visibility. Analysts say the absence of official reports leaves the Fed leaning dovish unless future labor data show improvement.
Investor focus is also shifting toward the upcoming earnings season, where forecasts and corporate commentary may play a larger role in shaping sentiment. Fed officials including Michelle Bowman, Raphael Bostic, Stephen Miran, and Neel Kashkari are set to speak this week.

Can COIN's $330 Breakout Reach $380? ~ Tactical Entry Plan📈 COINBASE GLOBAL, INC. (COIN) - Money Heist Plan (Swing/Day Trade) 🕵️♂️
🚨 Ready to execute the ultimate heist on COIN? This Money Heist Plan uses the Thief Strategy, a layered limit order approach to catch the breakout at $330.00 ⚡. Below, I've outlined the setup, technicals, fundamentals, and macro insights to help you navigate this trade like a pro. Set your alarms, plan your escape, and let’s dive into the details! 🔒
🛠️ Trade Setup: The Thief Strategy
The Thief Strategy is a tactical approach using multiple limit order layers to enter the trade post-breakout, maximizing flexibility and precision. Here’s how to execute it:
Asset: COINBASE GLOBAL, INC. (COIN) 💰
Entry Trigger: Breakout above $330.00 ⚡
Set a price alert on TradingView to catch the breakout in real-time! 🔔
Layered Entries (Thief Style): Place multiple buy limit orders to scale in:
$310.00
$315.00
$320.00
$325.00
$330.00
Pro Tip: Adjust layers based on your risk tolerance and strategy. Confirm entries only after the breakout at $330.00! ✅
Stop Loss (SL): Place at $295.00 post-breakout 🛑
Note: Adjust SL based on your risk management. The Thief Strategy is flexible—manage risk at your discretion, dear Traders (Thief OGs)! 😎
Take Profit (TP): Target $380.00 🎯
Resistance and overbought levels signal a potential police barricade 🚔. Escape with profits before the trap! Adjust TP based on your strategy.
Disclaimer: TP is not fixed—take profits at your own risk and preference.
📊 Why This Plan? Technical & Fundamental Breakdown
🔍 Technical Analysis: The Thief’s Blueprint
Breakout Catalyst: COIN is testing the $330.00 resistance. A confirmed breakout signals strong bullish momentum 📈.
Thief Strategy Advantage: Layered entries reduce risk of false breakouts and allow scaling into the move.
Key Levels to Watch:
Support: $295.00 (SL zone)
Resistance/Target: $380.00 (overbought zone)
Setup Confirmation: Use volume spikes and RSI for breakout confirmation. Set TradingView alerts to stay sharp! 🔔
📉 Fundamental & Macro Insights
Market Cap: $81.47B
PE Ratio (TTM): 30.52 (above industry avg., signaling high valuation)
EPS (TTM): $10.39
Revenue Growth (YoY): +12.36% (2025 est.) 💪
Profit Margin: 42.67% 🔥
Cash Reserves: $7.54B (strong balance sheet)
Risks:
Q2 profit drop to $33.2M vs. $294.4M YoY 📉
High P/E (30.71) and Price/Sales (12.61) raise valuation concerns
Macro Drivers:
Genius Act: Boosted crypto optimism 🚀
Crypto Market Trends: Bitcoin’s record highs in July 2025 fuel COIN’s upside potential
😰 Fear & Greed Index
Current Sentiment: Neutral to Greedy (Crypto Fear & Greed Index: 0-100)
Trend: Mixed emotions due to crypto volatility and regulatory developments
Takeaway: Greed supports breakout potential, but stay cautious of volatility spikes.
🧠 Investor Sentiment
Retail Traders: Cautiously optimistic 😊, holding for long-term crypto growth but cautious of short-term volatility.
Institutional Traders: Mixed 🤔—some see overvaluation, others bet on crypto adoption and regulatory clarity.
🐂 Bullish vs. Bearish Outlook
Bullish Score: 60% 🐂
Why? Strong revenue growth (+13.72% YoY est. for 2026), crypto adoption, and institutional interest.
Bearish Risks: 40% 🐻
Why? Profit volatility, high valuation, and crypto market dependence.
Key Watch: Q3 earnings (Sep 2025) and crypto market trends.
💡 Why Trade COIN Now?
Short-Term: Neutral to slightly bearish due to profit concerns, but the $330.00 breakout could spark a quick swing/day trade.
Long-Term: Bullish on COIN’s role in crypto infrastructure and regulatory tailwinds.
Thief Strategy Edge: Layered entries and disciplined risk management make this setup ideal for volatile markets.
🔗 Related Pairs to Watch (USD)
BITSTAMP:BTCUSD : Bitcoin’s momentum drives COIN’s price action.
BITSTAMP:ETHUSD : Ethereum’s performance impacts COIN’s trading volume.
BITSTAMP:XRPUSD : Watch for altcoin rallies tied to regulatory news.
AMEX:SPY : Broader market trends influence COIN’s beta (3.69).
📅 Market Data Snapshot (10 Sep 2025)
Previous Close: $318.78
Day’s Range: $315.88 - $328.67
52-Week Range: $142.58 - $444.65
Avg. Volume: 13.43M shares
✨ “If you find value in my analysis, a 👍 and 🚀 boost is much appreciated — it helps me share more setups with the community!”
#TradingView #COIN #SwingTrading #DayTrading #CryptoTrading #TechnicalAnalysis #ThiefStrategy #MoneyHeist

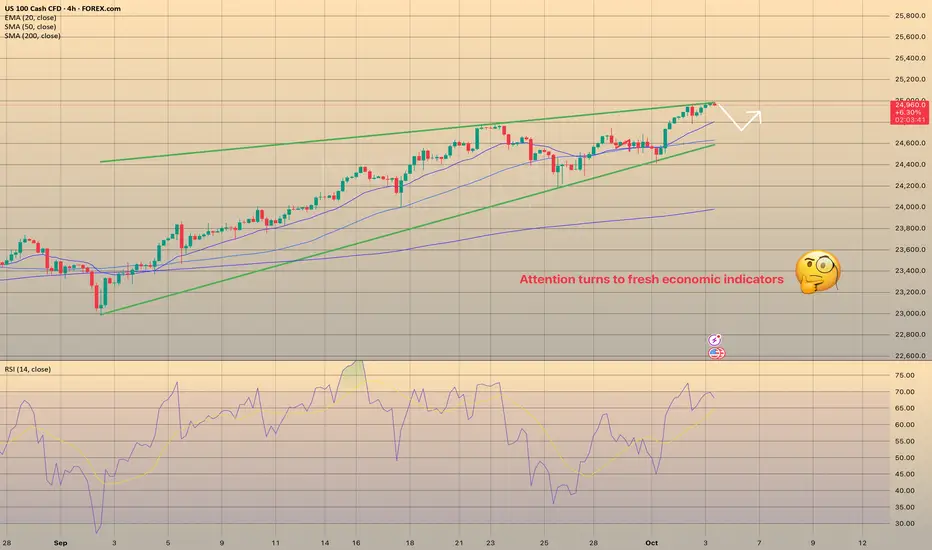
NAS100 - Stock Market on Federal Holiday!The index is above the EMA200 and EMA50 on the four-hour time frame and is in its long-term ascending channel. If the upward momentum decreases, we can expect a correction to the demand zones and buy Nasdaq in that range with an appropriate reward for the risk.
Traders in prediction markets now estimate that the U.S. federal government shutdown could last more than a week and potentially extend into mid-October. These projections suggest that Washington’s political environment has reached a deadlock, making a swift agreement in Congress increasingly unlikely.
The shutdown began early Wednesday morning after Democrats and Republicans—along with President Donald Trump—failed to reach a compromise on a temporary funding bill. As a result, hundreds of thousands of federal employees have been placed on unpaid leave, and numerous government programs and public services have been suspended.
According to data from Bank of America, since 1990, U.S. government shutdowns have lasted an average of 14 days. Although the S&P 500 has typically risen about 1% during such periods, an extended impasse could weigh heavily on an already fragile economy and markets near record highs.
The credit rating agency Fitch stated that the current shutdown will not have a direct impact on the United States’ credit rating, which remains at AA+ with a stable outlook. However, the agency noted that repeated reliance on short-term funding resolutions reflects persistent weaknesses in U.S. fiscal governance. Still, Fitch expects the U.S. dollar’s status as the world’s reserve currency to remain intact in the near future.
Fitch also added that a short-lived shutdown is unlikely to affect most public-finance credits, though a prolonged one could pose negative risks for bond issuers—particularly those dependent on federal funding in areas such as healthcare, housing, and higher education.
Meanwhile, UBS argued that concerns over the U.S. government shutdown have been overstated, predicting that its economic impact will be limited and short-lived. The bank advised investors to look beyond political noise and instead focus on Federal Reserve rate cuts, corporate earnings, and opportunities in artificial intelligence.
Economists at Citi expect the Federal Reserve to implement two 25-basis-point rate cuts in October and December, in line with its Dot Plot projections. However, the shutdown could delay access to key labor and inflation data, forcing investors to rely more heavily on private sources such as ADP reports.
Similarly, Bank of America forecasts a rate cut in October but notes that markets have already priced in this outcome, assigning a 95% probability for October and 85% for December. In essence, this projection merely aligns with the consensus that has already formed among traders.
In actual market developments, expectations have shifted back toward easing policies. Over the past two weeks, the hawkish pressure that had supported the dollar has eased, and markets are once again pricing in a lower-rate trajectory. Currently, about 105 basis points of rate cuts are priced in for next year, compared with a previous low of 94 basis points—a shift that favors equities while weighing on the dollar.
According to Daniel Pavilonis, senior commodities broker at RJO Futures, the government shutdown will not significantly impair the Fed’s ability to assess labor market conditions. “The Fed relies more on its proprietary datasets than on official government statistics,” he explained. “Even amid a shutdown, policymakers maintain a fairly accurate picture of the economy.”
After a week dominated by employment data—some released and others delayed due to the shutdown—the upcoming week is expected to be relatively quiet for official U.S. economic releases unless a resolution is reached.Instead, market attention will pivot toward remarks from Federal Reserve officials.
On Wednesday, the minutes of the September FOMC meeting will be released, offering deeper insight into policymakers’ views on the rate path and inflation risks. Then, on Friday, the University of Michigan’s preliminary Consumer Sentiment Index for October will shed light on household perceptions of the economy and their financial conditions—a key gauge for domestic demand strength.
In addition, investors will closely monitor speeches from several Fed officials, including Bostic, Bowman, Miran, Kashkari, Barr, and Musalem. Their comments could directly influence market expectations for monetary policy and shape trading sentiment in the days ahead.
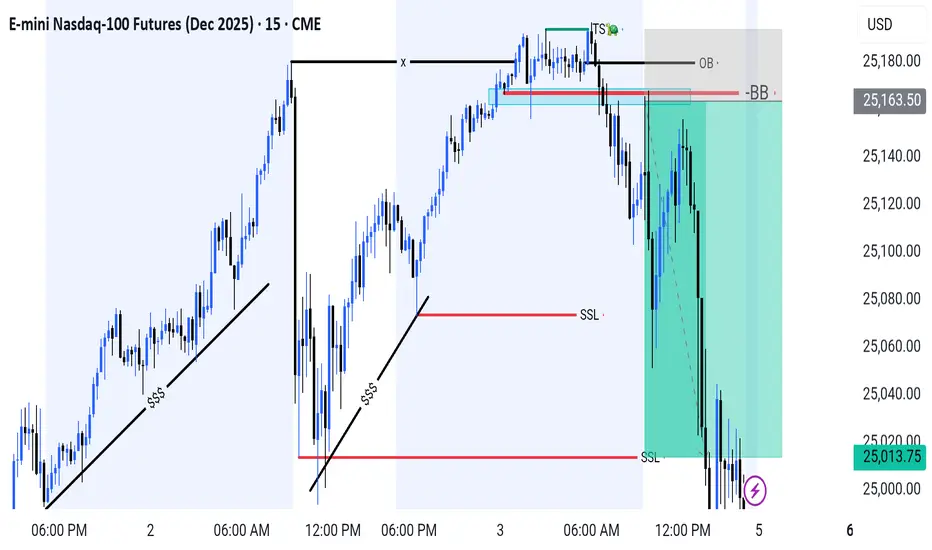
Nasdaq-100 | Textbook OB Rejection SSL Target Hit.Price swept the internal liquidity (TS 🐢) and tapped into a premium Order Block (OB), showing clear signs of rejection. This confirms a potential shift in market structure with bearish momentum building up. Alhumdulillah Target Hit✅️
🔹 Key Points:
Buy-side liquidity (BSL) taken before OB mitigation
Strong rejection from OB + Breaker Block (BB) zone
Market structure shift confirmed on 15m
Targeting sell-side liquidity (SSL) below recent swing lows
As long as price remains below the OB, bearish continuation is expected. Watch for short setups aligned with internal structure breaks.
NASDAQ 100 Technical Analysis & ForecastNASDAQ 100 (NAS100) Technical Analysis & Forecast
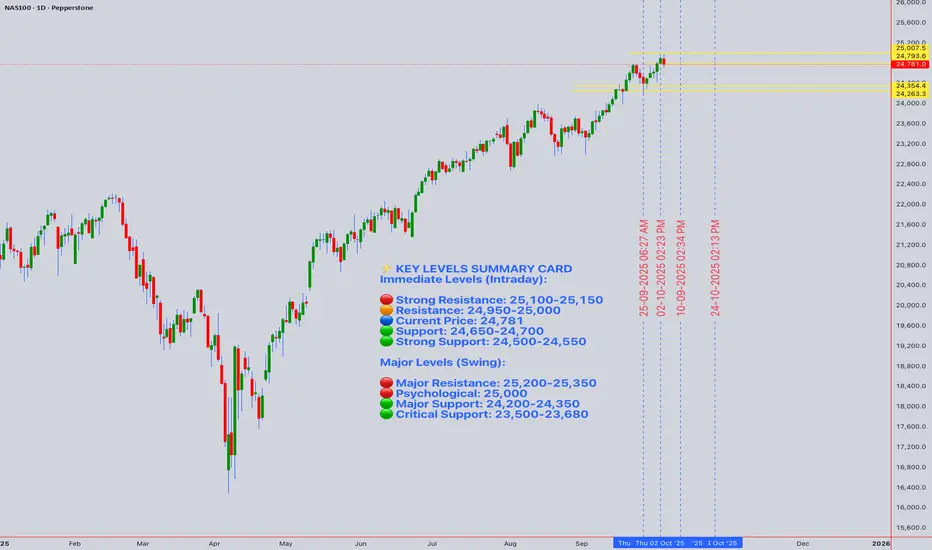
Current Price: 24,781.00 | Date: October 4, 2025, 12:54 AM UTC+4
📊 EXECUTIVE SUMMARY
The NASDAQ 100 is currently trading at 24,781.00, showing resilience near all-time highs. This comprehensive analysis integrates multiple technical frameworks to provide actionable insights for both intraday and swing traders navigating the tech-heavy index.
Key Takeaway: NAS100 exhibits a cautious bullish bias with critical support at 24,650 and resistance at 25,100. Traders should monitor for potential consolidation before the next directional move.
🔍 MULTI-TIMEFRAME TECHNICAL ANALYSIS
Monthly & Weekly Outlook (Swing Trading Perspective)
Long-term Trend Assessment:
Primary Trend: Bullish structure remains intact with higher highs and higher lows established since Q4 2024
Elliott Wave Count: The index appears to be in Wave 5 of a larger impulse structure from the 2022 lows, suggesting a mature bull cycle
Ichimoku Cloud (Weekly): Price trading above the cloud with Tenkan-sen (9-period) above Kijun-sen (26-period), confirming bullish momentum
Key Weekly Levels:
Major Resistance: 25,200 - 25,350 (psychological level and prior consolidation zone)
Major Support: 24,200 - 24,350 (former resistance turned support, 20-week EMA)
Critical Support: 23,500 (50-week EMA, must hold for bull trend continuation)
Gann Analysis:
Square of 9 calculation from recent lows suggests the next significant price target at 25,088 (45° angle)
Time cycle analysis indicates potential volatility window October 8-12, 2025
Price-time squaring suggests equilibrium at current levels, with break expected by mid-October
Daily Chart Analysis (Swing & Position Trading)
Trend & Momentum:
50-day SMA: 24,420 (acting as dynamic support)
200-day SMA: 23,680 (long-term trend anchor)
RSI (14): Currently at 64, showing bullish momentum without overbought conditions
MACD: Positive histogram with signal line above zero, indicating upward momentum
Chart Patterns Identified:
Ascending Triangle Formation: Consolidation between 24,650 support and 25,100 resistance suggests a bullish continuation pattern
Wyckoff Analysis: Signs of re-accumulation phase (Trading Range) after the spring rally, indicating smart money positioning
Harmonic Patterns:
Potential Bullish Bat pattern completing near 24,650, with PRZ (Potential Reversal Zone) offering strong support
Fibonacci retracement from recent swing shows 61.8% level at 24,580, aligning with multiple support factors
Volume Profile:
VWAP (Anchored from Sept 1): 24,695 - price maintaining above VWAP indicates institutional buying
Volume Analysis: Above-average volume on up days suggests strong bullish participation
High Volume Node (HVN): 24,750-24,800 represents fair value area
4-Hour Chart (Transitional Timeframe)
Technical Indicators:
Bollinger Bands: Price trading in upper band (24,950), suggesting near-term overbought conditions but strong trend
RSI (14): 68 - approaching overbought but no bearish divergence yet
Stochastic Oscillator: %K at 82, %D at 76 - overbought territory, watch for crossover
Ichimoku System:
Price above cloud (bullish)
Lagging span above price (confirming bullish sentiment)
Cloud ahead is thin, suggesting potential resistance at 25,050-25,100
Support & Resistance:
Immediate Resistance: 24,950 → 25,100 (psychological and technical confluence)
Immediate Support: 24,650 → 24,500 (previous consolidation and EMA cluster)
1-Hour Chart (Intraday Swing Reference)
Short-term Momentum:
20 EMA: 24,745
50 EMA: 24,680
100 EMA: 24,620
Price trading above all key EMAs indicates short-term bullish control
Candlestick Patterns:
Recent formation of bullish engulfing patterns on hourly suggests buying pressure
No immediate reversal patterns detected
Warning Signs:
Potential Bear Trap: If price briefly breaks below 24,650 with low volume, expect quick recovery (trap for shorts)
Bull Trap Risk: Break above 25,100 without volume confirmation could reverse quickly
📈 INTRADAY TRADING STRATEGY (Week of October 4-11, 2025)
15-Minute & 30-Minute Chart Focus
Monday-Tuesday Bias: Consolidation expected between 24,650-24,950
Long Entry Strategies:
Setup 1: Support Bounce Play
Entry Zone: 24,650-24,700
Stop Loss: 24,580 (below harmonic PRZ)
Target 1: 24,850 (Risk:Reward 1:2)
Target 2: 24,950 (Risk:Reward 1:3.5)
Confirmation: RSI (15-min) oversold below 30, bullish candlestick reversal pattern
Setup 2: Breakout Play
Entry: Break and retest of 24,950 with volume
Stop Loss: 24,870
Target 1: 25,050
Target 2: 25,150 (ascending triangle measured move)
Confirmation: Volume 20% above average, 15-min candle close above 24,950
Setup 3: VWAP Reversion
Entry: Price touches VWAP (currently ~24,695) from above on 5-min chart
Stop Loss: 24,650
Target: 24,800-24,850
Confirmation: Volume spike on touch, bullish divergence on 5-min RSI
Short Entry Strategies:
Setup 1: Resistance Rejection
Entry Zone: 25,050-25,100
Stop Loss: 25,150
Target 1: 24,850
Target 2: 24,700
Confirmation: Bearish engulfing or shooting star on 15-min chart, RSI divergence
Setup 2: Failed Breakout (Bull Trap)
Entry: Price breaks 25,100 but closes back below within 2 candles (15-min)
Stop Loss: 25,130
Target: 24,800
Confirmation: High volume on breakout but no follow-through
🎯 SWING TRADING STRATEGY (October-November 2025)
Bullish Scenario (60% Probability)
Primary Strategy: Ascending Triangle Breakout
Entry Plan:
Aggressive Entry: Current levels (24,780) with tight risk management
Conservative Entry: Pullback to 24,500-24,650 support zone
Breakout Entry: Confirmed break above 25,100 with volume
Position Sizing:
Risk 1-2% of capital per trade
Scale in: 50% at first entry, 30% on confirmation, 20% on continuation
Price Targets:
Target 1: 25,350 (measured move from triangle)
Target 2: 25,800 (Fibonacci extension 1.618)
Target 3: 26,200 (psychological and Gann Square of 9 target)
Stop Loss Management:
Initial Stop: Below 24,500
Trail Stop: Move to breakeven once Target 1 is reached
Final Stop: Trail with 4-hour 20 EMA
Time Horizon: 3-6 weeks
Bearish Scenario (40% Probability)
Invalidation Triggers:
Break below 24,500 on daily close
Head and Shoulders pattern develops (left shoulder at 25,200, head forming now, right shoulder anticipated)
MACD bearish crossover on daily chart
Short Strategy (Swing):
Entry Conditions:
Daily close below 24,500
RSI breaks below 50 on daily
Death cross forming (50 SMA crossing below 200 SMA - currently not present)
Targets:
Target 1: 24,200 (weekly support)
Target 2: 23,850 (50-day SMA)
Target 3: 23,500 (major support and 50-week EMA)
Stop Loss: Above 24,800
📉 RISK FACTORS & MARKET CONTEXT
Technical Risk Factors:
Overextension: Weekly RSI approaching 70 suggests limited upside without consolidation
Volume Divergence: If breakout occurs with declining volume, suspect false move
Elliott Wave: If in Wave 5, expect exhaustion and correction before new highs
External Market Considerations:
Macroeconomic Factors to Monitor:
Federal Reserve policy statements (October FOMC meeting expectations)
Q3 2025 earnings season for mega-cap tech (starting mid-October)
Geopolitical tensions and their impact on risk sentiment
US Dollar strength affecting multinational tech companies
Sector-Specific Catalysts:
AI technology developments and adoption rates
Semiconductor supply chain updates
Regulatory environment for big tech
Interest rate trajectory impacts on growth stocks
🛡️ RISK MANAGEMENT RULES
For All Trading Timeframes:
Position Sizing: Never risk more than 2% of capital on single trade
Stop Loss: Mandatory on every trade, no exceptions
Take Profits: Scale out at predetermined levels (50% at T1, 30% at T2, 20% at T3)
Maximum Daily Loss: Stop trading if down 4% in single day
Correlation Risk: NAS100 correlates with QQQ, SPX, and major tech stocks - monitor for divergences
Trading Journal Requirements:
Document all entries with screenshots
Record reasoning and technical setup
Track hit rate and average risk:reward
Weekly performance review and strategy adjustment
📅 WEEKLY INTRADAY ROADMAP
Monday, October 7:
Bias: Neutral to slightly bullish
Key Level: 24,750 (Friday's close area)
Strategy: Wait for direction after Asian/European session
Action: If holds above 24,700, look for longs on 15-min pullbacks
Tuesday, October 8:
Bias: Testing resistance at 24,950
Gann Time Cycle: Potential volatility day
Strategy: Breakout or rejection trades
Action: High-probability setups at extremes
Wednesday, October 9:
Bias: Continuation or reversal confirmation day
Strategy: Follow Tuesday's direction with momentum
Action: Trail stops on profitable positions
Thursday, October 10:
Bias: Mid-week profit-taking possible
Strategy: Mean reversion trades if overextended
Action: Watch for VWAP reversion setups
Friday, October 11:
Bias: Week-end positioning, reduced size
Strategy: Close most intraday positions before weekend
Action: Only high-conviction swing trades held over weekend
🎓 INDICATOR CONFLUENCE SUMMARY
Bullish Signals (Current):
✅ Price above 50-day, 100-day, and 200-day SMAs
✅ Ichimoku cloud bullish on daily and weekly
✅ MACD positive on multiple timeframes
✅ Volume profile shows accumulation
✅ Ascending triangle continuation pattern
✅ Gann angles supporting upward trajectory
Bearish Warnings:
⚠️ RSI approaching overbought on 4-hour
⚠️ Potential Elliott Wave 5 exhaustion
⚠️ Bollinger Bands showing overextension
⚠️ Stochastic overbought on shorter timeframes
Neutral/Watch:
🔍 Volume needs to increase on breakout attempts
🔍 Wyckoff accumulation phase requires confirmation
🔍 Head and Shoulders pattern could develop if resistance holds
🎯 FINAL TRADING RECOMMENDATIONS
For Intraday Traders:
Focus on the 24,650-25,100 range for the next week. Best opportunities exist at range extremes with clear risk management. Favor long setups given the broader bullish context, but remain nimble and respect stop losses.
Best Intraday Timeframes: 5-min for entries, 15-min for trend confirmation, 1-hour for bias
For Swing Traders:
The ascending triangle offers an excellent risk:reward setup. Consider building positions on pullbacks to 24,500-24,650 with stops below 24,450. Target the 25,350-25,800 zone over the next 4-6 weeks. Monitor daily candle closes for trend confirmation.
Best Swing Timeframes: Daily for entries, 4-hour for momentum, weekly for trend validation
⚡ KEY LEVELS SUMMARY CARD
Immediate Levels (Intraday):
🔴 Strong Resistance: 25,100-25,150
🟠 Resistance: 24,950-25,000
🔵 Current Price: 24,781
🟢 Support: 24,650-24,700
🟢 Strong Support: 24,500-24,550
Major Levels (Swing):
🔴 Major Resistance: 25,200-25,350
🔴 Psychological: 25,000
🟢 Major Support: 24,200-24,350
🟢 Critical Support: 23,500-23,680
📝 DISCLAIMER
This analysis is for educational and informational purposes only. Trading financial instruments carries substantial risk and may not be suitable for all investors. Past performance does not guarantee future results. Always conduct your own research and consult with licensed financial advisors before making trading decisions. The author is not responsible for any trading losses incurred based on this analysis.
Next Update: October 11, 2025
Analysis Valid Through: October 18, 2025
Prepared using advanced technical analysis incorporating Wyckoff, Elliott Wave, Gann, Harmonic Patterns, Ichimoku, and modern momentum indicators.RetryClaude can make mistakes. Please double-check responses.
BUY NASDAQOn the Nasdaq Futures, we went long on the market since it grabbed the minor sellside liquidity and gave us a FVG to ride, our target is the buyside liquidity.
Follow for more!

Wall Street extends record run as Shutdown delays key data, Fed Wall Street extends record run as Shutdown delays key data, Fed in Focus
U.S. stocks closed at record highs on Oct. 2, led by tech, with futures extending gains the next day. Optimism is supported by expectations of Fed rate cuts, though the government shutdown—now in its third day—has delayed key data, including nonfarm payrolls, leaving traders reliant on weaker private labor surveys.
With official releases on hold, ISM and S&P Global PMI data will carry added weight, while Fed officials’ speeches could sway rate-cut bets. While momentum points to weekly gains, the rally remains fragile as political gridlock, hawkish commentary, or profit-taking could trigger volatility.
Market Implications:
Supportive factors: Tech sector strength, softer labor signals, and rate-cut expectations.
Risks: Prolonged shutdown delaying visibility on economic conditions, potential hawkish Fed commentary, and profit-taking at record levels.
Outlook: If momentum holds, the S&P 500, Dow, and Nasdaq are positioned to close the week higher, though volatility is likely to remain elevated until greater policy clarity emerges.
Market on Fire: S&P 500 & Nasdaq Rally Towards New HighsWe have a beautiful P-Shape volume profile formed at the top and we broke and closed above it.
The P-shape volume profile is bullish profile that is formed when large volumes are transacted at the highs meaning participants a willing to pay premium price . You can see the POC so close to the top of the VAH
I checked the CVD of the volume on a footprint chart and i see the volume has -ve Delta , which means alot of aggressive sellers transacted there trying to push the price down. Now that they are being squeezed slowly and start closing out their positions, it should fuel the uptrend. i entered the trade soon as we broke and closed above the value area.
Food for thought.. Who was willing to pay the high price to buy from the aggressive sellers?
DEFINITIONS
POC- point of control
VAH- Value area high
CVD- Cumulative Volume Delta
Target is the ExoFade area..Lets see how this trade goes

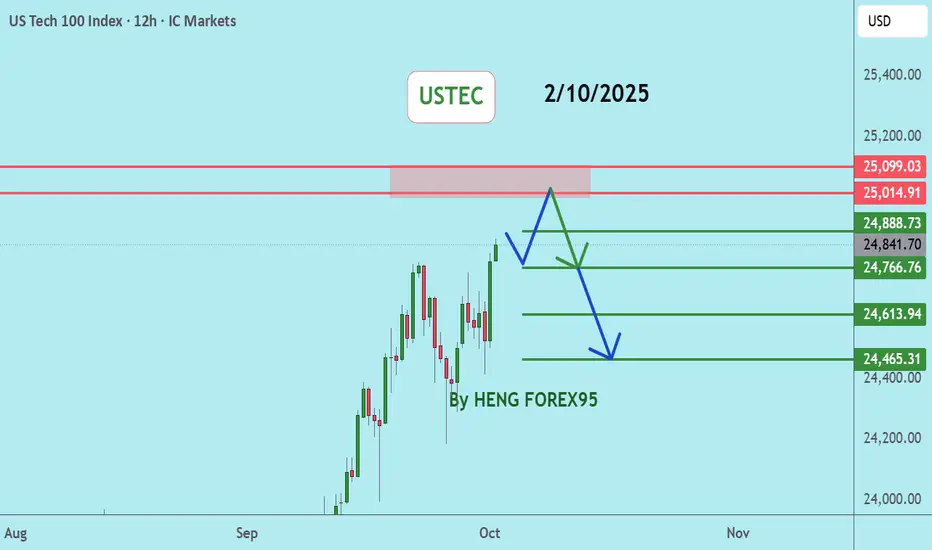
USTEC, NASDAQNasdaq price is still in a strong uptrend, there is a chance to test the 25014-25124 level. If the price cannot break through the 25124 level, it is expected that the price will have a chance to go down. Consider selling in the red zone.
🔥Trading futures, forex, CFDs and stocks carries a risk of loss.
Please consider carefully whether such trading is suitable for you.
>>GooD Luck 😊
❤️ Like and subscribe to never miss a new idea!
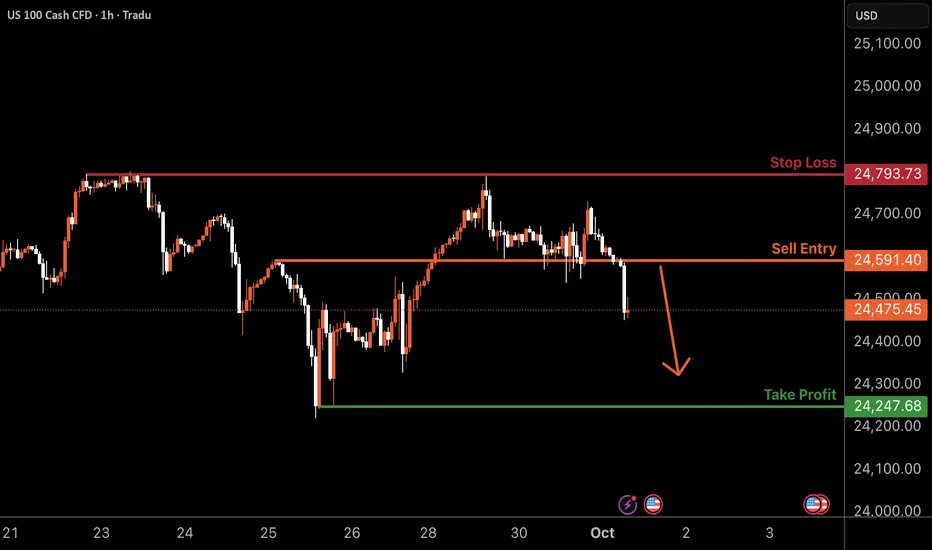
NAS100 H4 | Bearish Drop OffNas1100 is rising towards the sell entry at 24,591.40, which is an overlap resistance and could drop from this level to the downside.
Stop loss is at 24,793.73, which is a multi-swing high resistance.
Take profit is at 24,249.86, which is a swing low support.
High Risk Investment Warning
Trading Forex/CFDs on margin carries a high level of risk and may not be suitable for all investors. Leverage can work against you.
Stratos Markets Limited (tradu.com ):
CFDs are complex instruments and come with a high risk of losing money rapidly due to leverage. 65% of retail investor accounts lose money when trading CFDs with this provider. You should consider whether you understand how CFDs work and whether you can afford to take the high risk of losing your money.
Stratos Europe Ltd (tradu.com ):
CFDs are complex instruments and come with a high risk of losing money rapidly due to leverage. 66% of retail investor accounts lose money when trading CFDs with this provider. You should consider whether you understand how CFDs work and whether you can afford to take the high risk of losing your money.
Stratos Global LLC (tradu.com ):
Losses can exceed deposits.
Please be advised that the information presented on TradingView is provided to Tradu (‘Company’, ‘we’) by a third-party provider (‘TFA Global Pte Ltd’). Please be reminded that you are solely responsible for the trading decisions on your account. There is a very high degree of risk involved in trading. Any information and/or content is intended entirely for research, educational and informational purposes only and does not constitute investment or consultation advice or investment strategy. The information is not tailored to the investment needs of any specific person and therefore does not involve a consideration of any of the investment objectives, financial situation or needs of any viewer that may receive it. Kindly also note that past performance is not a reliable indicator of future results. Actual results may differ materially from those anticipated in forward-looking or past performance statements. We assume no liability as to the accuracy or completeness of any of the information and/or content provided herein and the Company cannot be held responsible for any omission, mistake nor for any loss or damage including without limitation to any loss of profit which may arise from reliance on any information supplied by TFA Global Pte Ltd.
The speaker(s) is neither an employee, agent nor representative of Tradu and is therefore acting independently. The opinions given are their own, constitute general market commentary, and do not constitute the opinion or advice of Tradu or any form of personal or investment advice. Tradu neither endorses nor guarantees offerings of third-party speakers, nor is Tradu responsible for the content, veracity or opinions of third-party speakers, presenters or participants.
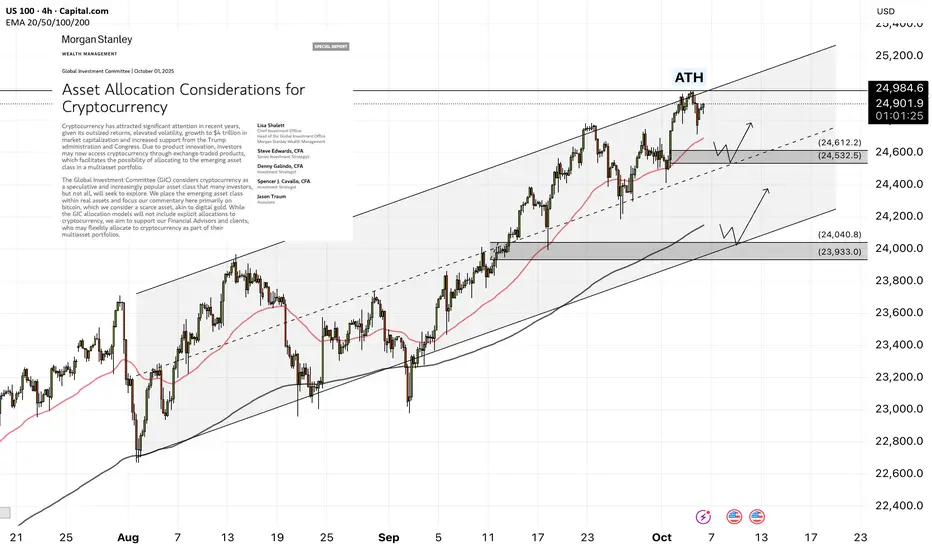
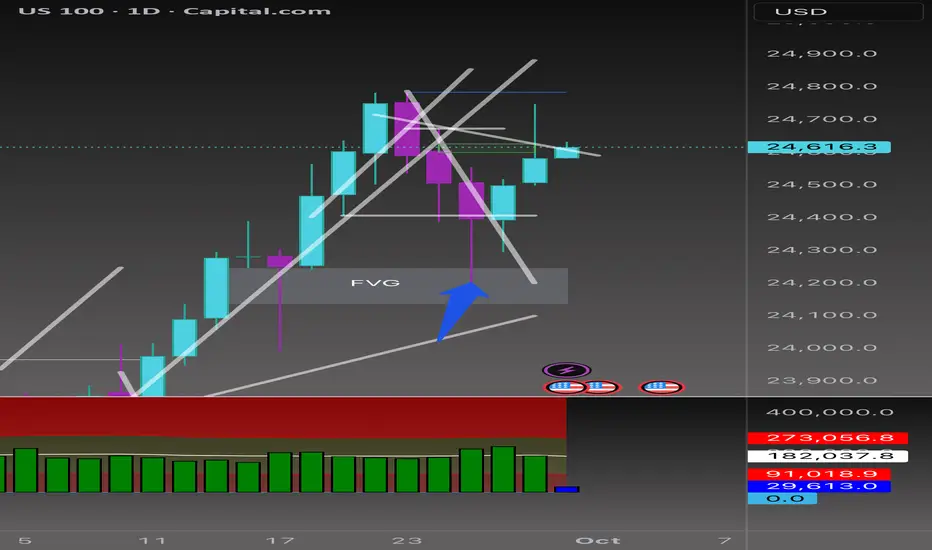
Beyond the Chart - NAS100 Through Technicals & FundamentalsCAPITALCOM:US100 The trendline I drew on the lower timeframe yesterday worked perfectly, and price is still respecting it. We did see a break, but right after that, a Bearish FVG and a Breaker Block formed. This trendline will remain my pilot line for analysis.
NASDAQ Daily Analysis 📊
On the daily chart, the FVG formed on Sep 15th has been revisited, but price couldn't hold in this zone and was quickly rejected. The trendline I've drawn is still active and guiding the move.
⚡️Volatility note: Daily volatility is starting to compress (blue print on my model), meaning the next breakout move could expand strongly. If price breaks above the trendline with momentum, buyers may look beyond 24,650 toward 24,720–24,800 before reevaluating. If rejection holds, compressed volatility could fuel an accelerated drop into the 24,520 → 24,440 FVG zone, and possibly 24,300.
🦖 If a bullish candle closes back above the trendline, I’ll be looking at 24,650 as a buy trigger. A confirmed break here could open the door toward 24,720 → 24,780 liquidity levels.
🐼 If sellers keep control below the trend, downside targets remain at the FVGs around 24,520 → 24,440, and potentially 24,300 (Discount PD Array).
⚡️ Bottom line:
Today’s US data (Chicago PMI, JOLTS, Consumer Confidence) + multiple FOMC speeches will likely decide direction.
📉 Hot data or hawkish tone → sellers push deeper.
📈 Softer numbers or dovish Fed comments → bulls may retest higher levels.
NASDAQ-NAS100 4H Analysis: Buy OpportunityHello Guys,
I’ve prepared a 4-hour NAS100 analysis for you.
I’ll be entering a buy position from 24,500.00 with a target set at 24,748.00.
Set your stop level according to your own margin.
Once the markets open, I’ll definitely take my shot on the buy side of NAS100.
Let’s see how this analysis plays out together.
Every like is my biggest motivation to keep sharing these analyses.
Thanks to everyone supporting me!

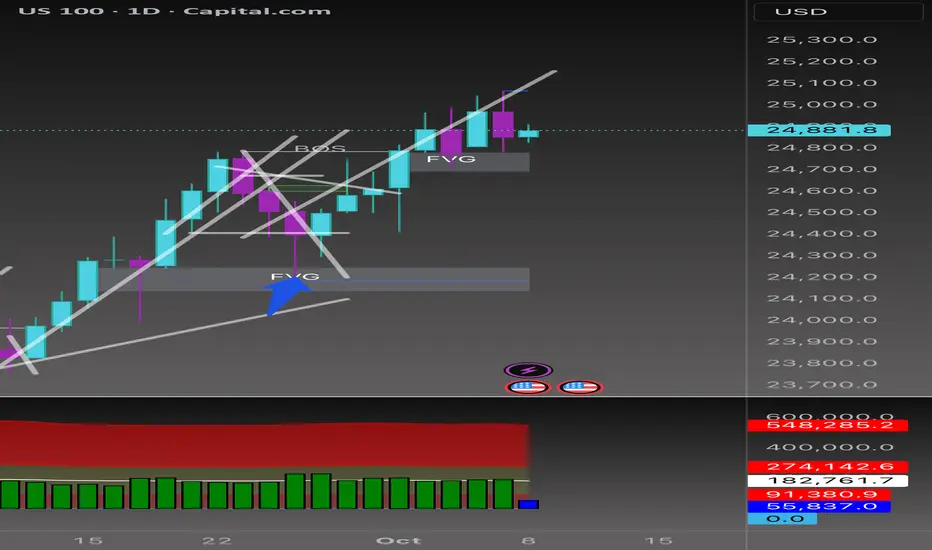
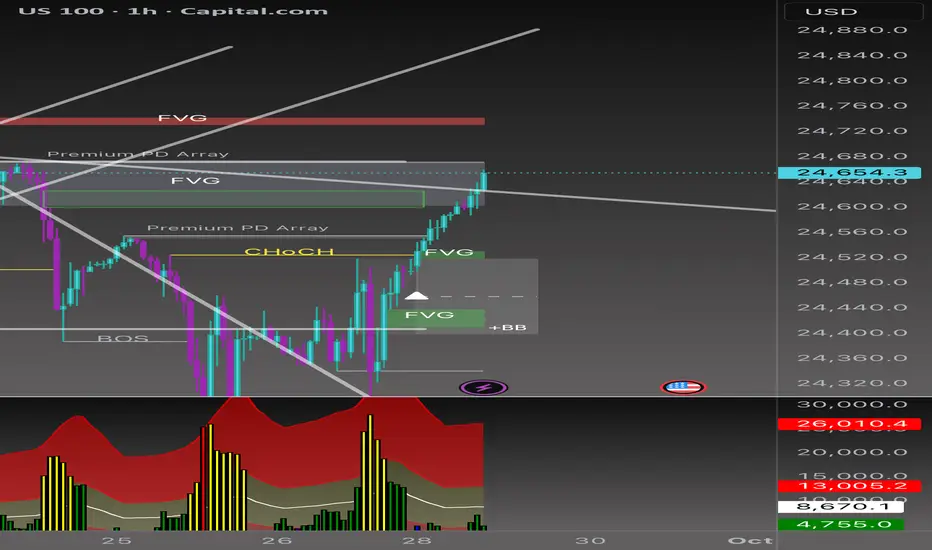
Beyond the Chart - NAS100 Through Technicals & FundamentalsThe trendline I drew last week played out perfectly. Price has carved out a fresh trend on the lower timeframe and is breaking to the upside. But the real confirmation comes only if the FVG is fully filled and we get a strong bullish close above 24,700.
NASDAQ Daily Analysis 📊
👉Hold above 24,500 – 24,520 → BUY targeting 24,700 (upper FVG). Break & hourly close above 24,700 → room to push toward 24,850 – 24,900.
👉24,700 – 24,750 → strong SELL zone (Premium PD Array + FVG overlap). First downside target: 24,400 – 24,350.
⚡️Bottom line:
• Bullish case→ If inflation comes in lower and the Fed takes a softer tone → buyers could step in and push levels higher.
• Bearish case → If data runs hot and the Fed signals more tightening → selling pressure kicks in, and your short levels become key.
NAS100 - Stock Market Awaits Employment Data!The index is above the EMA200 and EMA50 on the four-hour time frame and is in its long-term ascending channel. If the upward momentum decreases, we can expect a correction to the demand range and buy Nasdaq in that range with an appropriate reward for the risk.
According to reports released over the weekend, UBS stated that there is a 93% probability of the U.S. economy entering a recession this year. This figure implicitly suggests that the country may already be in recession, though some analysts remain skeptical of such a direct conclusion. UBS’s projection is based on indicators such as personal income, consumption, industrial production, and employment.
The bank warned that the U.S. economy has reached “historically troubling levels,” though no outright collapse has yet occurred. Analysts at UBS described the economy as “weak, soft, and fragile,” while noting that a definitive declaration of recession has not been made.
In the United States, an official declaration of recession is the responsibility of the Business Cycle Dating Committee at the National Bureau of Economic Research (NBER), which typically makes such calls with a lag of 6 to 18 months after the recession has started. Their assessment relies on revised data covering GDP, employment, income, sales, and production, and they generally avoid premature decisions.
In the meantime, policymakers and markets tend to act on real-time indicators such as GDP estimates, jobs data, yield curve signals, and credit spreads. In practice, traders react more strongly to price movements than to formal definitions of recession.
Separately, Michael Feroli, chief U.S. economist at J.P. Morgan, dismissed Fed board member Steven Miran’s call for cutting rates to 2.5% or lower. The bank has maintained its forecast for gradual 25-basis-point cuts, targeting a range of 3.25% to 3.5% by early next year.
A potential Supreme Court case involving Fed board member Lisa Cook has also emerged as a “wild card,” since a ruling against her could undermine the positions of other members as well. J.P. Morgan has warned that politicization of the Federal Reserve would leave the institution more vulnerable to pressure from a Trump administration on monetary policy.
The U.S. dollar remained relatively strong this week, as investors continued to parse the Fed’s less-dovish stance. While the latest dot plot showed policymakers aligned with the market on two additional rate cuts this year, the median dot for 2026 pointed to only one more 25-basis-point reduction. By contrast, markets still expect as many as three cuts next year.
However, following Chair Jerome Powell’s cautious tone on Tuesday—emphasizing that the Fed must continue balancing the competing risks of elevated inflation and a weakening labor market—investors scaled back some of their bets.
Inflation risks remain significant. The OECD highlighted this week that the full effects of tariff hikes are still unfolding. What supports Powell’s cautious approach is that, despite signs of labor market weakness, the Fed’s own forecasts remain relatively optimistic, with economic activity showing resilience. The Atlanta Fed’s GDPNow model projects 3.3% growth for Q3.
Although last week’s inflation data failed to dampen market optimism for rate cuts—and equities continued their rally—the focus in the coming week will shift back to labor market conditions.
The week begins Monday with pending home sales data. On Tuesday, the JOLTS job openings report and the consumer confidence index will be released. Wednesday brings private-sector employment data from ADP, followed by the ISM Manufacturing PMI. On Thursday, weekly jobless claims will be published as usual.
All of these releases will build up to Friday’s critical nonfarm payrolls (NFP) report, widely seen as the market’s ultimate test.Investors will closely monitor whether recent labor market weakness persists, and whether the Fed can move another step toward a rate cut at the October meeting. Finally, the ISM Services Index will provide a more comprehensive picture of U.S. economic health.
Ahead of the jobs data, traders may also take note of remarks from several Fed officials, including Vice Chair Jefferson, New York Fed President Williams, Atlanta Fed President Bostic, Chicago Fed President Goolsbee, and Dallas Fed President Logan. The ADP and NFP releases on Wednesday will likely provide the first snapshot of September labor market performance.

NASDAQ100 HIGH PROBABILITY SETUP SOON!!!🚨 NAS100 HIGH PROBABILITY BUY SETUP 🚨
* Here We Can See Clearly The Next Potential Moves For US100 Coming Hours/Days.
* Keep Your Eyes Close On Your Trading Positions.
* Happy PIP Hunting Traders.
FXKILLA.

NAS100: CRITICAL BREAKOUT ZONE! 25K Battle Ahead 🚀 NAS100: CRITICAL BREAKOUT ZONE! 25K Battle Ahead 📊
Current Price: 24,507.1 | Date: Sept 27, 2025 ⏰
📈 INTRADAY TRADING SETUPS (Next 5 Days)
🎯 BULLISH SCENARIO
Entry Zone: 24,480 - 24,520 📍
Stop Loss: 24,420 🛑
Target 1: 24,650 🎯
Target 2: 24,800 🚀
🎯 BEARISH SCENARIO
Entry Zone: 24,550 - 24,580 📍
Stop Loss: 24,630 🛑
Target 1: 24,300 🎯
Target 2: 24,150 📉
🔍 TECHNICAL ANALYSIS BREAKDOWN
📊 KEY INDICATORS STATUS:
RSI (14): 58.3 ⚡ *Neutral Zone - Room to Move*
Bollinger Bands: Mid-band Squeeze 🔥
VWAP: 24,465 - Dynamic Support Holding 💪
EMA 50: 24,380 ✅ *Bullish Above Key Level*
Volume: Declining 📊 *Awaiting Catalyst*
🌊 WAVE ANALYSIS:
Elliott Wave: Wave 4 Correction Complete 🌊
Next Target: Wave 5 Extension to 25,200+ 🎯
🔄 HARMONIC PATTERNS:
Bullish Bat Pattern Active at 24,450 ✨
ABCD Completion targeting 24,750 🔄
⚖️ SWING TRADING OUTLOOK (1-4 Weeks)
🚀 BULLISH TARGETS:
Weekly Resistance: 24,850 🏆
Monthly Target: 25,200 🌙
Gann Square of 9: 25,000 ⭐
📉 BEARISH INVALIDATION:
Weekly Support: 24,200 ⚠️
Critical Level: 24,000 🚨
🎭 MARKET STRUCTURE:
Trend: Consolidating Bullish 💪
Momentum: Building Energy 🔥
Wyckoff Phase: Re-accumulation 📈
Ichimoku: Neutral Cloud 🟡
🔥 CRITICAL LEVELS TO WATCH:
Resistance: 24,600 | 24,750 | 25,000 🚧
Support: 24,350 | 24,200 | 24,000 🛡️
Breakout Trigger: 24,580 confirmed close 💥
⚡ RISK MANAGEMENT:
Max Risk per Trade: 1.5% 🛡️
R:R Ratio: Minimum 1:3 ⚖️
Position Size: Conservative in Range 📏
🌍 MARKET CATALYSTS:
Tech Earnings Season Approaching 💼
Fed Policy Impact on Growth Stocks 🏛️
AI/Tech Momentum Driving Index 🤖
🎯 FINAL VERDICT:
NAS100 coiling for EXPLOSIVE MOVE! 🚀
25K psychological level in sight! 💥
Watch for volume spike above 24,580 👀
Trade Management: Scale in on pullbacks to VWAP 📈
Key Decision Zone: 24,500-24,600 battle crucial ⚔️
---
*⚠️ Disclaimer: Trading involves risk. Use proper risk management. This analysis is for educational purposes only.*
For individuals seeking to enhance their trading abilities based on the analyses provided, I recommend exploring the mentoring program offered by Shunya Trade. (Website: shunya dot trade)
I would appreciate your feedback on this analysis, as it will serve as a valuable resource for future endeavors.
Sincerely,
Shunya.Trade
Website: shunya dot trade
🔔 Follow for Daily Updates | 💬 Share Your NAS100 Strategy

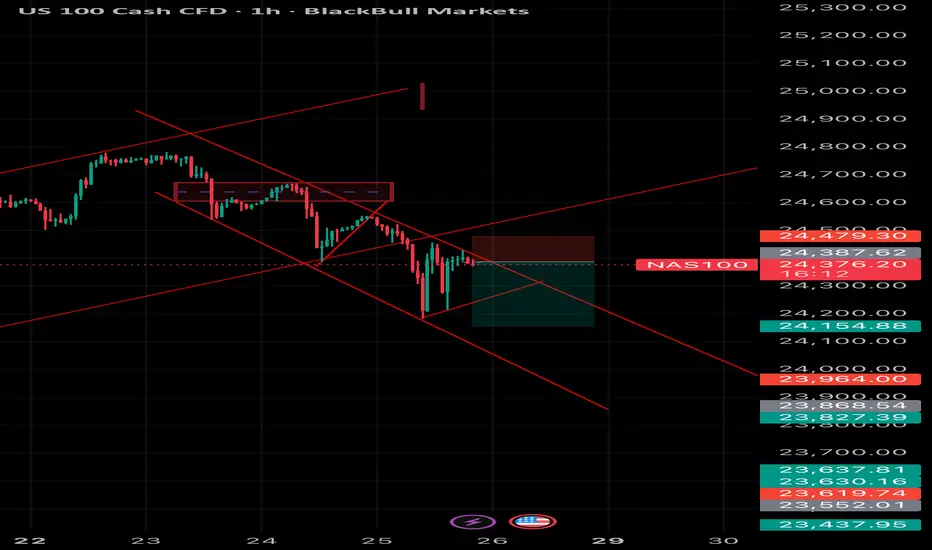
NAS100 Technical Analysis 1 Hour Chart📉 NAS100 Technical Analysis (1H Chart)
NAS100 is trading around 24,374 and continues to respect a strong descending channel, signaling bearish momentum.
• Trend: Price rejected the previous supply zone (24,470 – 24,500) and failed to break above resistance, confirming sellers are still in control.
• Entry Zone: The retest of broken support turned resistance around 24,387 – 24,479 shows bearish rejection with downside continuation likely.
• Target Levels:
• First target: 24,154 (mid-channel support)
• Next target zone: 23,960 – 23,827 (lower channel support)
• Invalidation: A clean 1H close above 24,500 would invalidate this bearish structure and could trigger a corrective move higher.
👉 Short-term bias remains bearish while under 24,500 with room for continuation toward 24,150 – 23,900.
NasdaqToday's price action can tell us a lot about the trend and future movements. After the drop to 24200, an uptrend line formed and resistance at 24470. If this trend continues, we can expect a breakout of this resistance and the key 24500 level. After confirmation, the Nasdaq could reach its highs again. Remember that on the daily chart, we are still in a strong bullish trend. Happy trading!

US100 Swing trade Sell position
Bearish pattern formed at the top.
Take-profit (TP) is defined on the chart.
If you wish to hold further, move stop-loss (SL) to breakeven.

NasdaqNasdaq breaking 24500 pulled back to the 2-day average and returned below this level, we can see a sharper drop to the support region 24100 and 24200

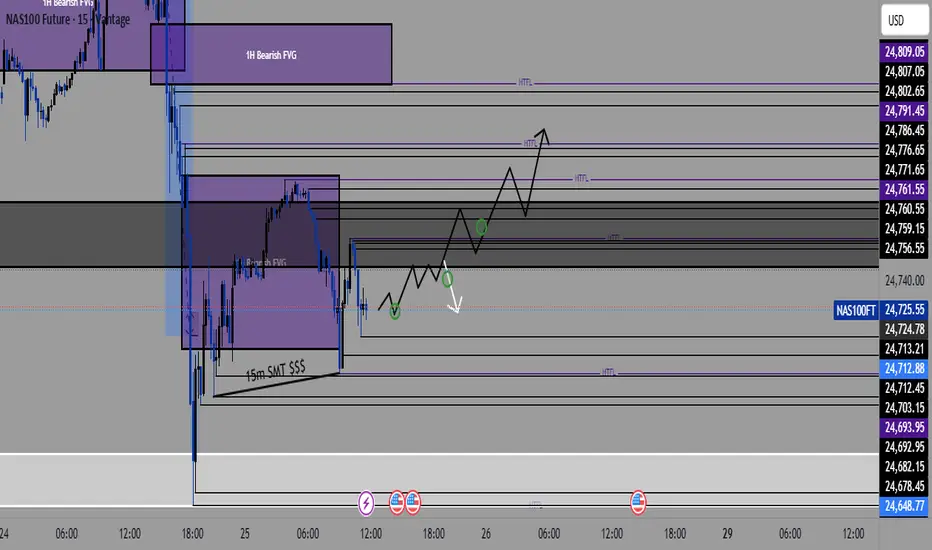
NAS100 (15-Minute Timeframe)🔍 Key Levels to Watch:
Bullish Setup 👇: After a dip in price, we've seen potential accumulation at the 15-minute FVG (Fair Value Gap), setting up for a possible bounce. 🟢
Bearish Resistance ⬆️: Price is currently interacting with a 1-hour Bearish FVG, with potential for further downside if resistance holds. ⛔️
🔵 Potential Trade Plan:
Look for a Pullback: Price could retrace to the higher time-frame resistance zones around 24,791.45 (HTFL) or 24,786.45.
Key Entry Points: Focus on price action near the 15-minute FVG, which may give us a clearer bullish confirmation. 🟢
Target Zones: Aiming for 24,791.45 and higher based on overall momentum.
🔥 Stay alert and trade wisely! Always use proper risk management.
Greetings,
MrYounity