NAS100 - Stock Market Waiting for Jackson Hole Leak!The index is above the EMA200 and EMA50 on the 4-hour timeframe and is trading in its ascending channel. If the index corrects downwards towards the specified demand zones, you can buy Nasdaq with appropriate reward and risk.
According to a recent report from JPMorgan, the new U.S. tariffs could have significant repercussions for the American economy. The bank projects that these tariffs may reduce U.S. GDP by as much as 1% while simultaneously pushing inflation higher by up to 1.5%.
This year’s tariff hikes represent the largest increase since World War II, with the effective tariff rate rising to nearly 18%. With the expiration of tariff exemptions on imports under $800, consumer goods prices are expected to climb further.
JPMorgan has warned that both consumers and businesses may struggle to absorb these additional costs, raising the risk of stagflation. Meanwhile, monthly inflation has remained within the 0.3% to 0.5% range, suggesting that the Fed’s preferred inflation gauge could rise toward 3% to 3.5%.
As U.S. tariffs have surged to their highest levels in decades, revenues from these duties hit a record $28 billion in July. According to estimates by the Tax Foundation, tariff revenues could total about $2.2 trillion by the end of this decade. However, this is also expected to trim GDP by around 0.9%.
Research conducted by Yale University indicates that tariff policies could reduce annual household income by approximately $2,400, since part of these tariff costs are passed on to consumers by companies.
At the same time, Berkshire Hathaway, led by Warren Buffett, has made notable adjustments to its investment portfolio:
• It purchased 6.6 million shares of steelmaker Nucor.
• It added 5 million shares of healthcare insurer UnitedHealth.
• It fully divested its holdings in T-Mobile US.
• It trimmed its stake in Apple by 6.7%, reducing its position to 280 million shares.
Meanwhile, Goldman Sachs reiterated its outlook that the Federal Reserve will cut interest rates three times before the end of 2025. The projected reductions include three 25-basis-point cuts in September, October, and December. Additionally, two further cuts are expected in 2026, bringing the terminal rate down to the 3%–3.25% range. Markets have already increased their bets on a September rate cut. Recent weakness in inflation and employment data has paved the way for such accommodative policy measures.
Federal Reserve Chair Jerome Powell is scheduled to deliver a speech at the Jackson Hole Symposium on August 22, 2025—an event that has become an unofficial policy-setting platform. Analysts at Morgan Stanley expect Powell will attempt to temper market expectations for a 50-basis-point cut in September. Given the political pressures and mixed economic signals, Powell may only endorse a 25-basis-point cut, or potentially push back against easing altogether.
Any of these outcomes could disappoint markets, especially if Powell fails to deliver clear guidance. His speech may therefore play a decisive role in shaping U.S. monetary policy for the remainder of the year and could drive heightened volatility across markets.
Although this week’s economic calendar features several important housing and manufacturing reports, the spotlight will remain firmly on the Fed. On Tuesday, July housing starts and building permits data will be released. Wednesday brings the FOMC’s July meeting minutes, speeches from key Fed officials Waller and Bostic, and the official kickoff of the annual Jackson Hole Symposium.
On Thursday, markets will digest a packed set of data, including the Philadelphia Fed manufacturing index, weekly jobless claims, the preliminary August S&P Global PMI, and July existing home sales.
The highlight of the week will be Friday, when all eyes turn to Jerome Powell. His annual Jackson Hole speech is expected to provide fresh clues about the Fed’s policy trajectory—guidance that could strongly influence market direction in the weeks ahead.
NASDAQ 100 CFD

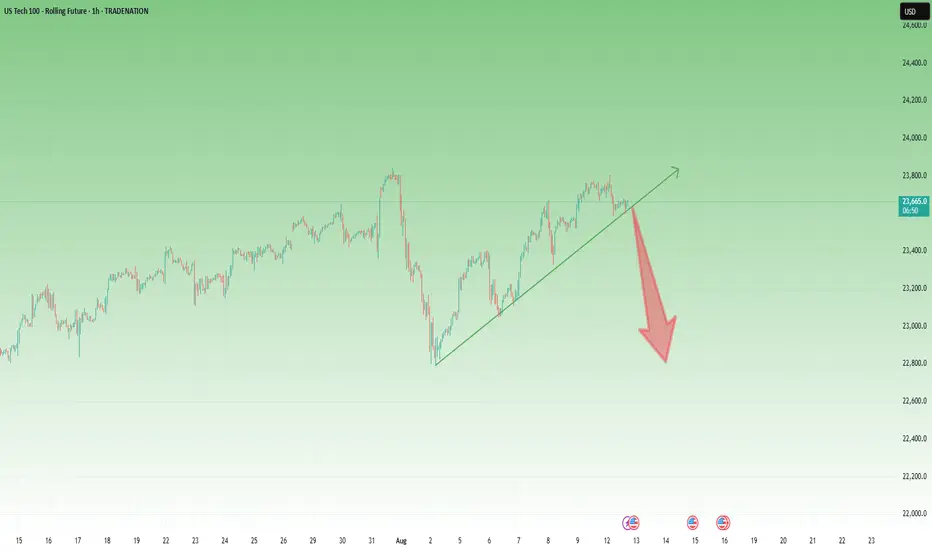
NASDAQ After the Fireworks: Bearish Setup LoadedAfter the classic 4th of July rally, I stepped in on the short side of Nasdaq, targeting 22,000 and 21,400 zones. The market structure shows exhaustion, and with the cloud retest failing to hold new highs, I positioned accordingly.
Technical:
• Price stalled at prior expansion highs with tight compression near 23,000.
• Daily FibCloud offered resistance confirmation.
• Bearish risk-reward skew forms after extended rally and thin retraces.
• Volume divergence spotted.
Fundamentals:
Multiple overlapping uncertainties:
• Trump confirmed tariffs will take effect on August 1, threatening a 10% surcharge on BRICS-aligned nations.
• Treasury Secretary Bessent anticipates several trade deal announcements within 48h—but stresses quality over quantity.
• Bank of America maintains its base case of 0 rate cuts in 2025, citing strong economic data and sticky inflation risks.
The combination of tariff escalation, hawkish monetary expectations, and global trade friction creates a perfect backdrop for volatility and correction—especially in overextended tech indices like the Nasdaq.
Note: Please remember to adjust this trade idea according to your individual trading conditions, including position size, broker-specific price variations, and any relevant external factors. Every trader’s situation is unique, so it’s crucial to tailor your approach to your own risk tolerance and market environment.

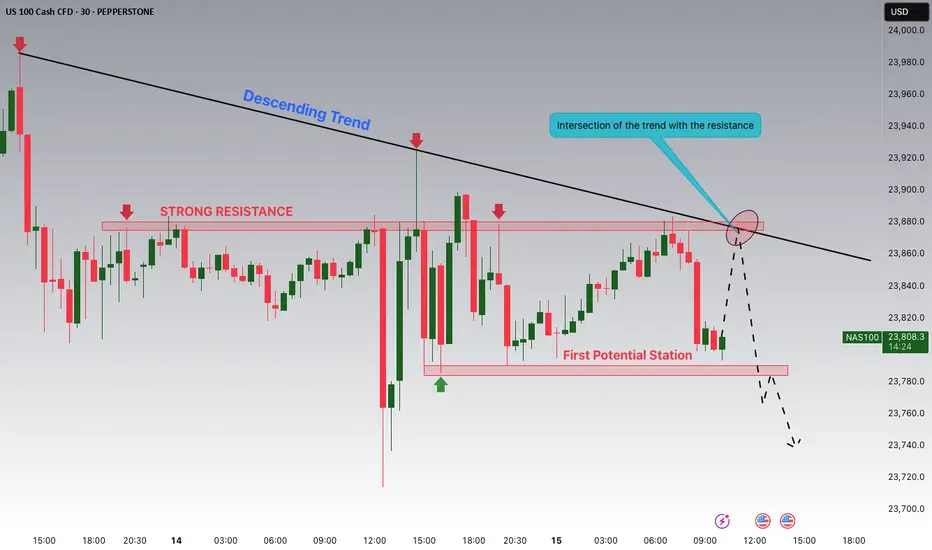
NASDAQ is Nearing the Intersection of The Trend with Resistance!Hey Traders, in today's trading session we are monitoring NAS100 for a selling opportunity around 23,875 zone, NASDAQ is trading in a downtrend and currently is in a correction phase in which it is approaching the trend at 23.875 support and resistance area.
Trade safe, Joe.
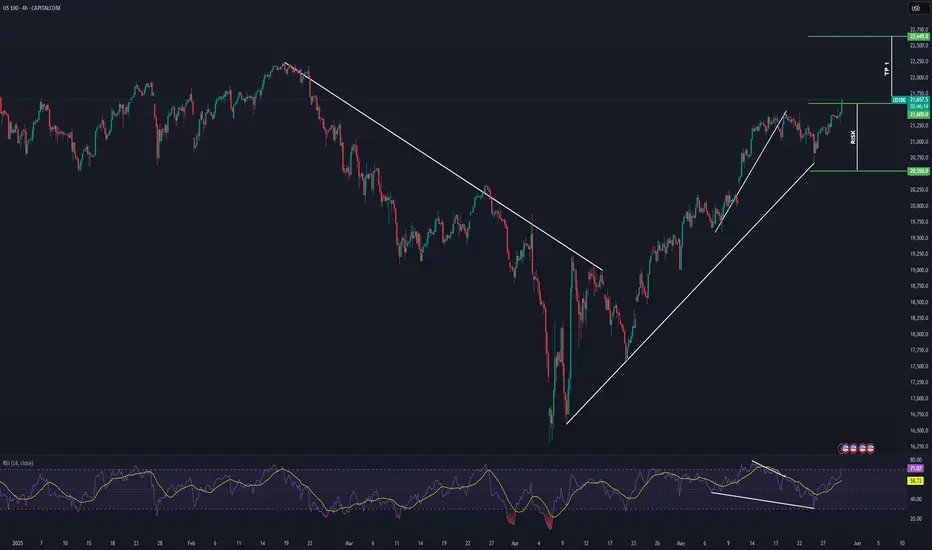
NASDAQ Potential Bullish ContinuationNASDAQ price action seems to exhibit signs of potential Bullish momentum as the price action may form a credible Higher High (after tarriff delays on the EU) with multiple confluences through key Fibonacci and Support levels which presents us with a potential long opportunity.
Trade Plan:
Entry : 21600
Stop Loss : 20550
TP 1: 22649
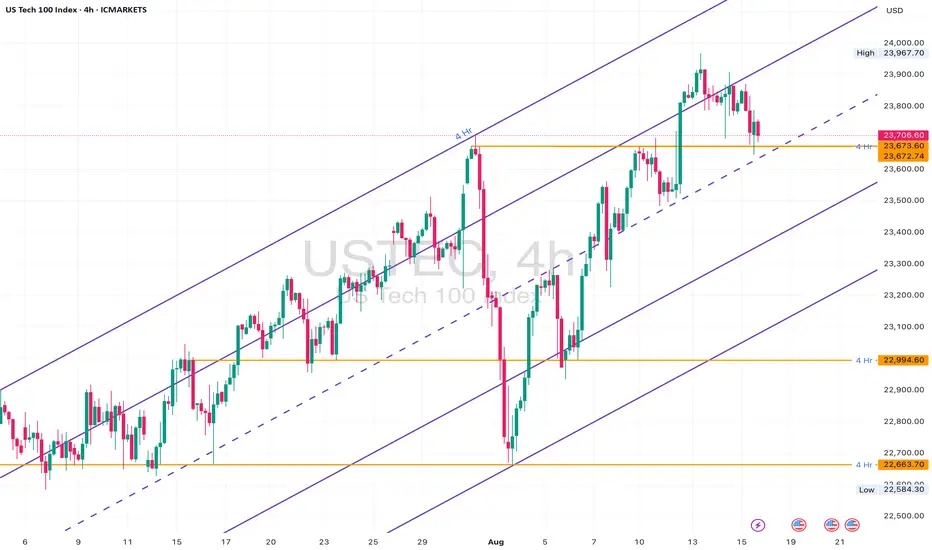
NAS100 4H Channel: Bounce or Breakdown?NASDAQ100 has been trending within a clean ascending channel on the 4H timeframe. We’re now sitting at a crucial decision point — the midline and horizontal support around 23,670.
This zone has historically acted as a strong S/R pivot. If price holds, we could see another bullish bounce toward 24,000+. But if it breaks and closes below, we may get a clean drop toward the bottom of the channel — with 23,200 and 22,663 as targets.
Plan:
• Wait for a 4H close above or below the 23,670 level
• Bullish scenario: Bounce toward upper channel (~24,300)
• Bearish scenario: Drop to lower channel boundary with incremental TP levels
Structure:
• 4H rising channel structure still intact
• Price testing midline zone
• Horizontal level at ~23,670 adds confluence
• No confirmed break of channel yet
Key Zones:
• Support: 23,670 (midline + structure support)
• Bullish flip zone: 23,967
• Bearish continuation zones:
‣ 23,200
‣ 22,994
‣ 22,663
Nas100 sell opportunity Nas100 technical analysis. Nas100 price recently reached an all time high. Price is at resistance levels and has also broke through upward trend line which is strong indicator that price will continue down to main support levels over the next week.

NAS100 – Potential Short Setup After Sharp RallyOn the 5-minute chart, NAS100 has made a strong upward move following a sharp drop earlier in the session.
Price is now approaching a potential exhaustion point near 23,940–23,960. I expect a reversal from this zone, followed by a move back toward 23,725 and possibly lower.
Trade Plan:
Sell Entry: 23,940–23,960 zone after confirmation
Stop-Loss: Above 23,960
Take-Profit: 23,725 initial target; further downside possible if momentum continues
Notes:
Watch for reversal candlestick patterns or break of short-term structure before entering.
This setup is based on intraday momentum and may require fast execution.

US30 at the Turn: Buy Setup from the Pullback ZoneHey friends 👋
Here’s my latest analysis on US30 (Dow Jones). I’m watching a potential pullback into the zone I marked: 44,292 – 44,190. I plan to open a buy position from that range, targeting 44,692 as my take-profit level.
Every single like you send is a huge source of motivation for me to keep sharing these insights. Big thanks to everyone supporting with a tap of appreciation 🙏
NASDAQ (CASH100) is Approaching KEY ResistanceSince 15 May, the Cash100 has been trading within an upward channel.
It’s now approaching diagonal resistance — will it hold, or break higher?
On the chart, I have marked every time NAS has tested the diagonal resistance and failed to break through.
I’ll be watching this area closely for shorts.
What do you think: will NAS continue climbing, or is a reversal coming?

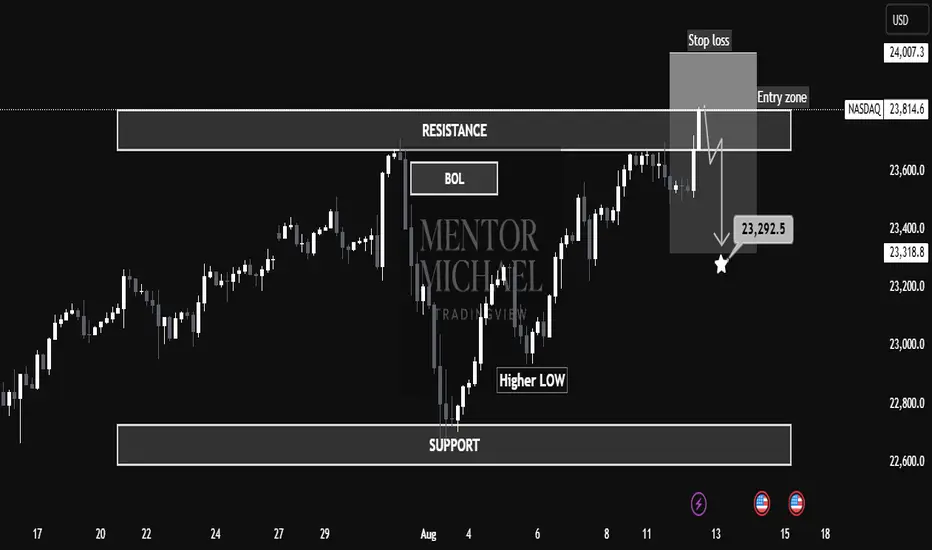
NASDAQ at Make-or-Break Resistance – Is a Sharp Drop to 23,292 "📉 NASDAQ at Make-or-Break Resistance – Is a Sharp Drop to 23,292 Next?"
📊 NASDAQ is currently trading within a well-defined resistance zone (23,812 – 24,007) after a recent rally from the support base near 22,800. The structure suggests a potential sell-side setup if price respects the resistance and fails to break higher.
🧐 Market Structure Analysis
Support Zone: Around 22,800, where buyers previously stepped in, forming a Higher Low and initiating the last bullish leg.
Resistance Zone: 23,812 – 24,007, marked by previous rejections and a Break of Liquidity (BOL).
Price has tapped into the entry zone just below resistance, hinting at possible exhaustion from buyers.
The chart indicates a bearish bias from this zone, aiming for a move toward 23,292.5 (marked target).
🎯 Educational Trade Example
Entry Zone: 23,812 – 24,007
Stop Loss: Above 24,007 to protect against breakout rallies.
Target: 23,292.5 (aligned with previous structural support).
Rationale:
Trading against strong resistance offers asymmetric R:R if momentum shifts bearish.
The Higher Low before resistance can act as liquidity fuel for sellers once demand weakens.
Clear invalidation point keeps risk defined.
⚠ Invalidation Scenarios
A strong breakout and close above 24,007 with follow-through volume would invalidate the short idea and potentially signal continuation toward 24,200+.
💡 Key Takeaways for Students
Zone-to-Zone Trading: Always define both entry and exit zones before execution.
Structure Before Strategy: The market’s reaction to resistance is the clue — confirmation comes before position sizing.
Risk Management is Non-Negotiable: Even high-probability setups require strict stop placement.
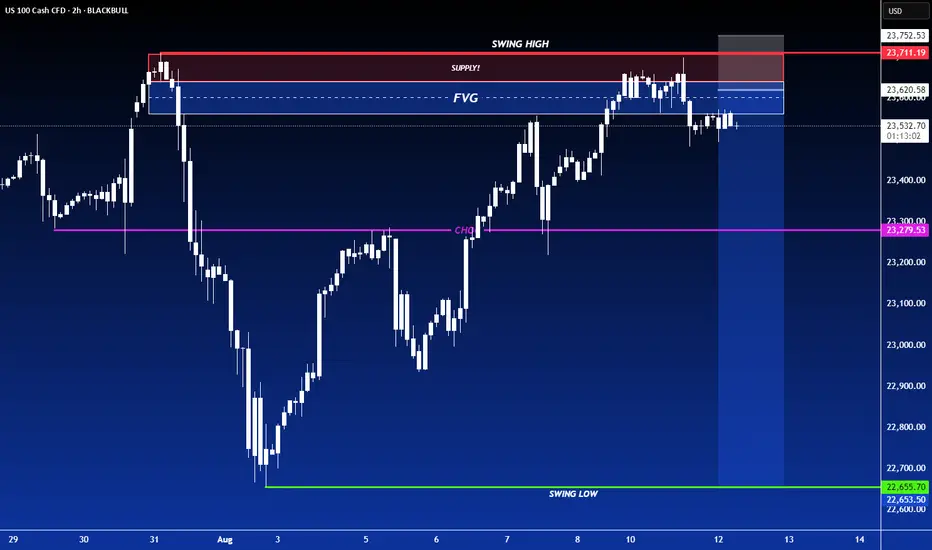
SHORT ON NAS100NAS has retested a major supply zone after a nice CHOC (Change Of Character)
I will be selling NAS looking to catch over 800-100 points.
DXY (USD) CPI economic news will also be a catalyst to more this trade this morning after 8:30am.
USNAS100 | CPI Day Setup – Breakout or Pullback Ahead?USNAS100 Overview
Markets found some relief after the U.S. and China extended their tariff truce until November 10, avoiding the imposition of triple-digit duties on each other’s goods.
Today, attention is firmly on the U.S. CPI release, which is expected to drive market direction:
A reading above 2.8% would likely support a bearish move toward 23440 and 23295.
A reading below 2.8% could fuel bullish momentum toward a new ATH at 23870.
Technical Outlook:
As long as the price trades below 23690, downside targets remain 23440 and 23295.
A 1H close above 23695 would turn the bias bullish toward 23870.
Support: 23440, 23295, 23045
Resistance: 23700, 23870

US100 – Dark Cloud Cover Signals Possible Reversal AheadAfter the drop to 22,800, NAS100 recovered strongly and yesterday retested the recent ATH in the 23,800 zone.
However, by the close of the trading day, the index erased the entire intraday advance and closed in the red – leaving a Dark Cloud Cover candlestick formation on the daily chart.
As explained in my previous analysis, I believe the US indices are ready for a deeper correction after the incredible run-up since April.
Technical Outlook:
• The US100 is still holding above its recent ascending trend line.
• A confirmed break below this trend line could trigger an acceleration in selling pressure.
• The first downside target for bears is the recent low at 22,800.
• In the medium term, if a full reversal unfolds, I would not be surprised to see the index trading near 20,000 within the next 2–3 months.
The market has been on an extraordinary bullish streak, but this candle formation combined with extended price action could be the first sign that momentum is shifting.
Disclosure: I am part of TradeNation's Influencer program and receive a monthly fee for using their TradingView charts in my analyses and educational articles.
USNAS100 | Consolidation Before CPI –Breakout or Pullback Ahead?USNAS100 Overview
The index reached its all-time high ahead of recent speculation about a potential Fed rate cut. This week’s CPI data will be a key driver, indicating whether the Fed may cut rates in the near term.
Technical Outlook:
As long as the price trades below 23640–23690, a decline toward 23530–23435 is expected. A break below this zone could extend the drop toward 23295.
A 1H close above 23695 would turn the outlook bullish, targeting 23870.
Support: 23535, 23435, 23295
Resistance: 23870, 24040
previous idea:

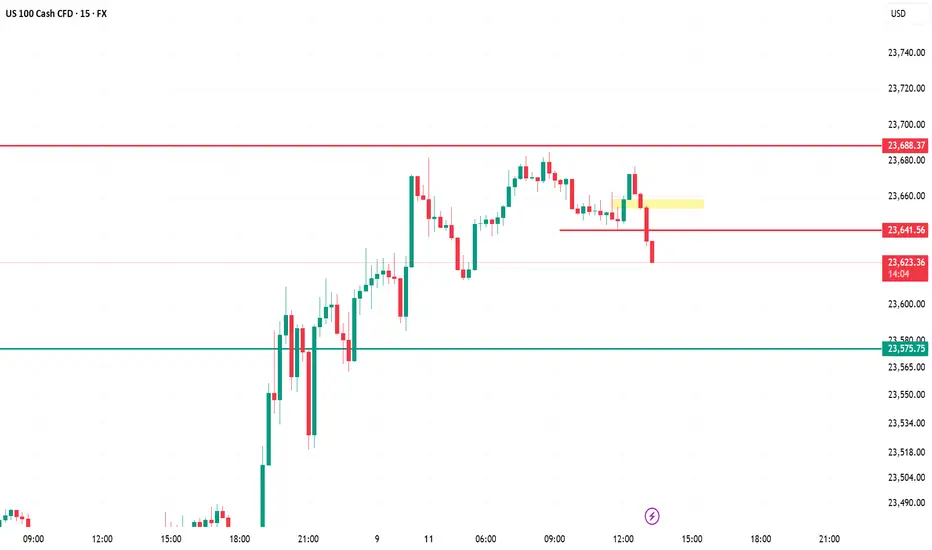
US100 (5m) – AnalysisKey Breakdown – Price has broken below the 23,641 support (red line) after failing to hold the yellow retest zone, signaling short-term bearish momentum.
Immediate Resistance – 23,641 is now flipped into resistance; any pullback toward it could attract sellers.
Downside Target – Next major support sits at 23,575; if broken, deeper liquidity may be targeted below 23,550.
Market Structure – Shifted from intraday uptrend to lower highs & lower lows; momentum favors short trades until structure flips.
Trading Approach – Look for short entries on retests of 23,641 with stop above yellow zone, target 23,575, then trail for possible extended drop.
NASDAQ (NQ1!): Bullish! Buy The Pullbacks!Welcome back to the Weekly Forex Forecast for the week of Aug 11 - 15th.
In this video, we will analyze the following FX market:
NASDAQ (NQ1!) NAS100
The NASDAQ is strong and moving higher. No reason to look for sells.
Wall Street advanced on Friday, taking indexes closer to a strong weekly finish, after President Donald Trump's interim pick for a Federal Reserve governor post kept expectations alive for a dovish policy.
The structure is bullish, with supports for higher prices. Wait for a pullback to discount arrays and buy it!
Enjoy!
May profits be upon you.
Leave any questions or comments in the comment section.
I appreciate any feedback from my viewers!
Like and/or subscribe if you want more accurate analysis.
Thank you so much!
Disclaimer:
I do not provide personal investment advice and I am not a qualified licensed investment advisor.
All information found here, including any ideas, opinions, views, predictions, forecasts, commentaries, suggestions, expressed or implied herein, are for informational, entertainment or educational purposes only and should not be construed as personal investment advice. While the information provided is believed to be accurate, it may include errors or inaccuracies.
I will not and cannot be held liable for any actions you take as a result of anything you read here.
Conduct your own due diligence, or consult a licensed financial advisor or broker before making any and all investment decisions. Any investments, trades, speculations, or decisions made on the basis of any information found on this channel, expressed or implied herein, are committed at your own risk, financial or otherwise.

NASDAQ Potential UpsidesHey Traders, in today's trading session we are monitoring NAS100 for a buying opportunity around 23,300 zone, NASDAQ is trading in an uptrend and currently is in a correction phase in which it is approaching the trend at 23,300 support and resistance area.
Trade safe, Joe.

NQ. Market Efficiency Paradigm. Weekly Outlook 10.08.2025, CME_MINI:NQ1!
Covered the daily and hourly order flow.

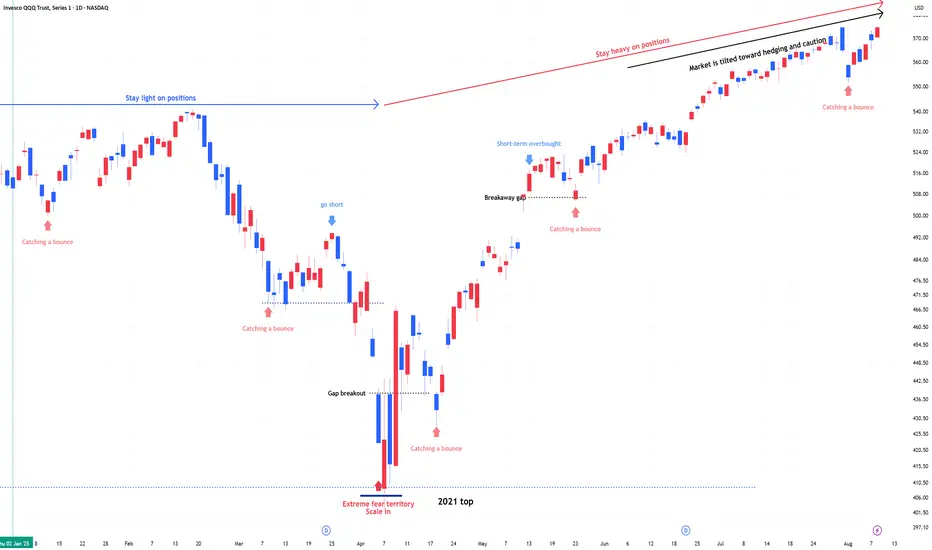
QQQ , Stay heavy on positionsQQQ , Stay heavy on positions. (QLD, TQQQ)
Despite the rebound, the market remains tilted toward hedging and caution.
In stay light on positions zones, I hold QQQ and reduce exposure.
In stay heavy on positions zones, I increase allocation using a mix of QLD and TQQQ.
NDX & SPX , Stay heavy on positionsNDX & SPX , Stay heavy on positions. (QLD, TQQQ)
Despite the rebound, the market remains tilted toward hedging and caution.
In stay light on positions zones, I hold QQQ and reduce exposure.
In stay heavy on positions zones, I increase allocation using a mix of QLD and TQQQ.

USNAS100 Volatile – Key Level at 23440 in FocusUSNAS100 – Market Overview
The indices market remains highly volatile following the latest developments regarding the Federal Reserve Chairman.
The situation remains tense, with the possibility of one rate cut this year still on the table.
Technical Outlook
Bullish Scenario:
Stability above 23440 will keep bullish momentum intact, targeting the All-Time High (ATH) at 23690, with further potential toward 23870.
Bearish Scenario:
A 1H close below 23430 would shift the bias to bearish, targeting 23295, and possibly lower.
Resistance: 23570 – 23690 – 23870
Support: 23295 – 23180 – 23045

NAS100 H4 | Bullish bounce offUS100 (NAS100) has bounced off the buy entry which is a pullback support that is slightly above the 38.2% Fibonacci retracement and could rise to the take profit.
Buy entry is at 23,276.48, which is a pullback support that is slightly above the 38.2% Fibonacci retracement.
Stop loss is at 23,029.35, which is an overlap support that aligns with he 61.8% Fibonacci retracement.
Take profit is at 23,736.91, which is a swing high resistance.
High Risk Investment Warning
Trading Forex/CFDs on margin carries a high level of risk and may not be suitable for all investors. Leverage can work against you.
Stratos Markets Limited (tradu.com ):
CFDs are complex instruments and come with a high risk of losing money rapidly due to leverage. 65% of retail investor accounts lose money when trading CFDs with this provider. You should consider whether you understand how CFDs work and whether you can afford to take the high risk of losing your money.
Stratos Europe Ltd (tradu.com ):
CFDs are complex instruments and come with a high risk of losing money rapidly due to leverage. 66% of retail investor accounts lose money when trading CFDs with this provider. You should consider whether you understand how CFDs work and whether you can afford to take the high risk of losing your money.
Stratos Global LLC (tradu.com ):
Losses can exceed deposits.
Please be advised that the information presented on TradingView is provided to Tradu (‘Company’, ‘we’) by a third-party provider (‘TFA Global Pte Ltd’). Please be reminded that you are solely responsible for the trading decisions on your account. There is a very high degree of risk involved in trading. Any information and/or content is intended entirely for research, educational and informational purposes only and does not constitute investment or consultation advice or investment strategy. The information is not tailored to the investment needs of any specific person and therefore does not involve a consideration of any of the investment objectives, financial situation or needs of any viewer that may receive it. Kindly also note that past performance is not a reliable indicator of future results. Actual results may differ materially from those anticipated in forward-looking or past performance statements. We assume no liability as to the accuracy or completeness of any of the information and/or content provided herein and the Company cannot be held responsible for any omission, mistake nor for any loss or damage including without limitation to any loss of profit which may arise from reliance on any information supplied by TFA Global Pte Ltd.
The speaker(s) is neither an employee, agent nor representative of Tradu and is therefore acting independently. The opinions given are their own, constitute general market commentary, and do not constitute the opinion or advice of Tradu or any form of personal or investment advice. Tradu neither endorses nor guarantees offerings of third-party speakers, nor is Tradu responsible for the content, veracity or opinions of third-party speakers, presenters or participants.

Market Gains on Fed Optimism – Will 23440 Be Reached?Wall Street Edges Up Amid Fed Rate Cut Optimism; Earnings in Focus
U.S. stock indices rose on Wednesday, supported by growing expectations of Federal Reserve rate cuts later this year. Investors are also closely monitoring a fresh wave of corporate earnings, which continues to influence sentiment.
Technical Outlook
The price is currently holding above the key pivot level at 23045.
As long as it remains above this level, bullish momentum is expected to continue toward 23180 and 23295.
A confirmed breakout above 23295 would likely extend the rally toward 23440.
⚠️ On the other hand, a 1H close below 23045 would shift momentum to bearish, targeting 22870 and possibly 22725.
🔹 Resistance Levels: 23180, 23295, 23440
🔹 Support Levels: 22870, 22725
