NAS100 I Next Potential Long Opportunity Welcome back! Let me know your thoughts in the comments!
** NAS100 Analysis - Listen to video!
We recommend that you keep this on your watch list and enter when the entry criteria of your strategy is met.
Please support this idea with a LIKE and COMMENT if you find it useful and Click "Follow" on our profile if you'd like these trade ideas delivered straight to your email in the future.
Thanks for your continued support!
Nas100analysis

NAS100: The Fed Trap is Set! Don't Buy Yet NASDAQNAS100 🌍 The US100 macro narrative heading into this week is dominated by the Federal Reserve Interest Rate Decision scheduled for today, January 28, 2026 🏦. Markets are pricing in a likely "Pause," but with political pressure mounting and Tech Earnings season in full swing, volatility is guaranteed. The "Driver of the Week" is the interplay between this Fed policy update and Big Tech guidance—essentially, we are waiting to see if the central bank validates the recent rally or triggers a "sell the news" event. Sentiment remains cautiously Risk-On, but traders are lightening exposure ahead of the FOMC press conference 🎤.
We are seeing a Bullish Market Structure on the H4 📈, printing clear higher highs and higher lows, with the recent impulse leg shattering resistance at 26,000. However, the current candles are showing rejection wicks at the top, suggesting the market is overextended and craving a healthy correction before the next leg up. This pullback is necessary to reset the RSI and gather fresh liquidity for a push toward new highs.
Key Zone: The chart highlights a pristine confluence area where the Ascending Parallel Channel support intersects perfectly with the 50% (25,753.3) and 61.8% (25,641.8) Fibonacci Retracement levels 📉. This "Golden Pocket" is the exact area where institutional algorithms often rest buying orders during a trend continuation.
We are currently trading at the top of the range, and chasing price here is risky. I am watching for a classic "Judas Swing" or stop-hunt lower to sweep early buyers before the real move begins 🧹. The ideal scenario is a sharp dip into our Buy Zone post-FOMC, trapping bears who think the trend has reversed, only to see price reclaim the channel and surge.

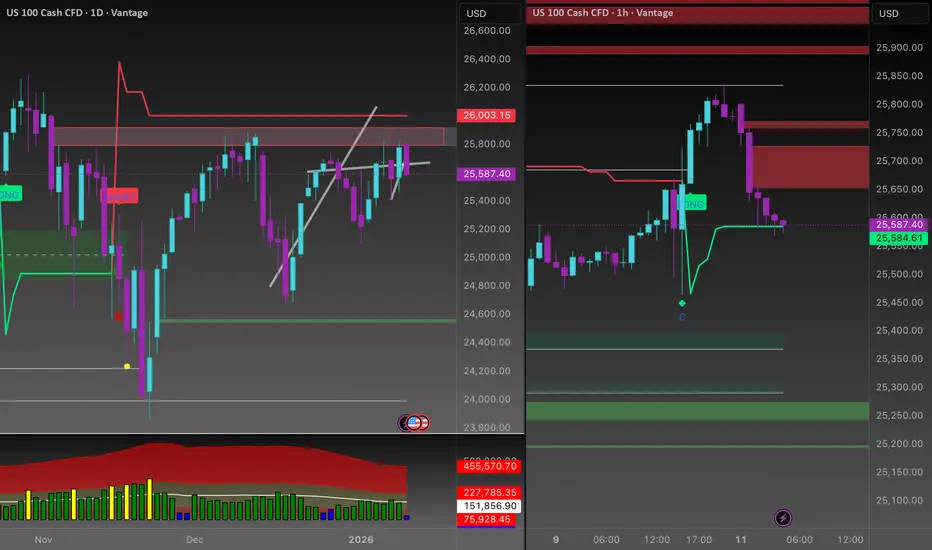
Nasdaq — Quiet Start to the Year, But the Structure Is Building.The first month of the year was unusually quiet for the Nasdaq, with price contained inside a tight 1,000-point range, roughly 4% of value.
That calm, however, is starting to fade.
🔎 Signs of Life Since Last Week
Since last week, the index has begun to show clear bullish intent:
- a bullish engulfing candle on Wednesday
- followed by another bullish engulfing yesterday, which pushed price directly into resistance
- This sequence suggests buyers are no longer passive — they are stepping in with intent.
📐 Bigger Picture: A Clean Technical Structure
Looking at the broader context:
After the ATH at the end of October, the correction that followed stopped almost perfectly at the August ATH
From there, price began to compress higher, forming an ascending triangle on the daily chart
This is a textbook continuation pattern:
✔️ rising lows
✔️ flat resistance
✔️ tightening price action
🌍 Macro Noise Didn’t Break the Trend
Despite ongoing geopolitical tensions, the Nasdaq structure remained intact.
In fact, rather than breaking the trend, the volatility reinforced the compression, which often precedes expansion.
🎯 Outlook & Target
With such a clear technical setup and sustained structural strength, it is reasonable to expect:
➡️ a break above resistance
➡️ followed by continuation toward new ATHs
The measured move target for the ascending triangle comes in around:
🎯 27,800
That level could represent a realistic swing target for traders aligned with the trend.
✅ Conclusion
Nasdaq spent a month consolidating
With momentum returning and structure tightening, the market is positioning itself for resolution to the upside.

#NAS100/USD Sell Trade Setup.Here’s an up-to-date NAS100/USD Sell trade outlook (technical + fundamental) to help you assess whether positioning for a Downside makes sense right now.
Thank You......

NASDAQ NAS100 Technical Analysis and Trade IdeaMy bias remains bullish on the NAS100 🐂, but patience is the name of the game today. Fundamentally, the index is struggling for oxygen as the market digests the "no rate cut" reality for January, causing a temporary decoupling from the broader risk-on flows 📉. Technically, we are trapped in a corrective flag, and the rejection at 25,600 confirms that the bears are still defending the highs.
If the setup triggers, aim for a 5R return to start 🎯. If the price action reclaims 25k within our optimal entry zone. Look to close partial profits (50%) at 25,400 (1R) 💰, then let the rest run and use a trailing SL. Patience pays on this one, let the setup come to us. ⏳ This trade is invalidated if we lose the 24,550 structural pivot 🛑.

No Rush. No FOMO. Just Levels.CAPITALCOM:US100 As seen on the daily chart, price once again respected the OG supply zone around 25,900 – 26,000, a level marked and shared at the beginning of last week.
From this area, all short scenarios provided during the week played out cleanly, with price respecting structure step by step.
This move was further confirmed by the new week opening with a strong gap down, shifting price below the 25,300 area, fully aligning with the higher time frame bearish bias.
📉 Daily Bias VANTAGE:NAS100
Bearish below 25,900 – 26,000 (OG Supply Zone)
As long as price remains under this zone, downside scenarios remain valid.
🎯 1H Expectations
• Any retracement toward 25,600 – 25,900 is considered corrective
• While below 25,600, sellers remain in control
• Acceptance below 25,250 keeps downside pressure active
📌 Key Levels
• 25,900 – 26,000 → Daily OG Supply / Invalidation
• 25,600 → 1H resistance
• 25,250 → Key intraday support
• 24,900 – 24,800 → Lower demand / liquidity area
⚡ Intraday Scalp Scenarios (15M & 5M Execution)
Scalp bias is derived from 1H structure. Execution is refined on 15M and confirmed on 5M.
🔴 Short Scalp Scenario
• Sell zone: 25,580 – 25,650 (15M supply / HTF discount)
• Confirmation: 5M lower high + breakdown
• Targets:
→ 25,300 first reaction
→ 25,250 continuation level
🟢 Long Scalp Scenario (Counter-trend)
• Buy zone: 25,250 – 25,300 (intraday demand / reaction area)
• Confirmation: 5M rejection + hold above level
• Targets:
→ 25,380 – 25,420 quick reaction
→ 25,500 max scalp extension
⚠️ These are reaction based scalps, not trend reversals.
Main structure remains bearish unless daily invalidation occurs.
🛑 Invalidation
Only a daily acceptance above 25,900 – 26,000 invalidates the current bearish bias.
Until then, structure favors shorts.
🧠 Execution Reminder
No rush.
No FOMO.
Just your levels.
Not investment advice. Always manage your own risk.

#NAS100/USD Buy Trade Scenario.Here’s an up-to-date NAS100/USD Buy trade outlook (technical + fundamental) to help you assess whether positioning for a Upside makes sense right now.
Thank You......

NASDAQ 100 (US100) – 4H | Bullish Continuation SetupUS100 4H shows a clear HH–HL structure with price holding above EMAs. Momentum remains bullish with RSI above 55.
Looking for a breakout continuation above 25,880 .
SL below structure at 25,480, targeting 26,280 liquidity zone.
Bias remains bullish unless structure fails.

No Rush. No FOMO. Just Levels!CAPITALCOM:US100 Price is currently trading inside a higher timeframe premium supply zone, where previous distribution occurred. Despite the recent bounce, market structure remains heavy, and upside continuation is still questionable at these levels.
📌 Higher Timeframe VANTAGE:NAS100 (Daily)
• Price is reacting inside a daily resistance / supply zone
• Overall structure remains range to bearish 🐼
• No clean daily close above resistance yet
• Volume does not confirm strong continuation📈
➡️ HTF Bias: Neutral to Bearish below 26,000
📉 Intraday Structure (1H)
• Strong impulsive move up already delivered
• Current price consolidating inside a 1H distribution range
• Upside momentum is slowing
• Liquidity resting both above equal highs and below range lows
🔴 Short Scenario (Primary)
• Sell zone: 25,850 – 26,000
• Looking for:
• Weak push into highs
• Rejection or displacement failure
• Targets:
• 25,650 (range low)
• 25,400 (liquidity + demand)
• Extended: 25,250
🧠 This remains the preferred scenario as long as price stays capped below supply.
🟢 Long Scenario (Secondary / Scalp Only)
• Valid only if price holds above 25,650
• Requires:
• Strong bullish acceptance
• Clean displacement + continuation
• Upside targets:
• 25,900
• 26,000 (major reaction zone)
⚠️ Counter trend longs only. No swing conviction here.
❌ Cancellation / Invalidation
• Shorts invalidated:
• 1H close above 26,050
• Acceptance above daily supply
• Longs invalidated:
• 1H close below 25,600
🎯 Final Expectation
Market is likely building liquidity before the next expansion.
As long as price remains below daily supply, sell side reactions are favored.
Patience at premium levels > reaction > execution.
Not financial advice.
Risk management is mandatory.

Strength is getting SOLD!CAPITALCOM:US100 Price is trading directly into a daily OG supply zone at 25,950 – 26,050, coming from a corrective push, not impulsive strength.
Higher timeframe structure remains distributional, with price sitting in premium territory.
• Daily OG supply active at 25,950 – 26,050
• No daily acceptance above 26,050
• Upside lacks displacement and follow-through
• HTF context favors sell-side positioning
Above here is not trend continuation, it’s liquidity hunting.
VANTAGE:NAS100 On the 1H, price delivered a clean expansion into OG supply, immediately followed by a sharp bearish response.
• 1H OG supply: 25,720 – 25,820
• Strong rejection and structure breakdown below 25,720
• Bullish move shows exhaustion, not accumulation
• Sell-side liquidity stacked below 25,500
This is how smart money sells into strength.
Primary Bias: Bearish below 25,720
Expectation:
• Pullbacks into 25,650 – 25,750 are sell opportunities
• Target: liquidity sweep toward 25,400 – 25,300
• Extended downside opens 25,150 if momentum accelerates
Invalidation / Cancellation:
• Clean 1H close and acceptance above 25,820
• Daily close above 26,050 cancels the sell idea completely
Until that happens, rallies are for selling, not chasing.
US NAS100 | Liquidity Grab Before ContinuationCAPITALCOM:US100 Following the sharp sell off, price is currently trading in a consolidation phase after a strong impulsive move.
This type of structure typically offers both continuation and corrective scenarios, depending on acceptance.
Short-term outlook (5M)
Bullish scenario 🦖 (corrective long)
• Price is holding above the recent intraday low
• Short-term momentum is stabilizing
• If price accepts above 25,310 – 25,350, a corrective push higher is possible towards 25,415
• This move would be considered a pullback / relief bounce, not a trend reversal
As long as the move remains overlapping and lacks displacement, upside should be treated as corrective only.
Bearish scenario 🐼 (continuation short)
• Overall micro structure remains weak
• Previous sell impulse has not been fully retraced
• Failure to hold above local resistance keeps downside pressure active
• Liquidity remains resting below the recent lows
A rejection from the current consolidation zone would favor continuation to the downside.
Mid-term outlook (15M – 1H alignment)
• Larger structure remains bearish, aligned with the higher-timeframe view
• Current range looks like a pause before continuation
• Any upside without strong acceptance is likely to be sold into
As long as price trades below higher-timeframe resistance, short bias remains dominant mid-term.
Key takeaway
• Longs are short-term and corrective only, with 25,415 & 25,600 as the upside reference
• Shorts align with mid-term structure and higher-timeframe bias
• Acceptance or rejection at current levels will define direction
Market is at a decision point.
Let price confirm, then execute 🦈📊

SELLside Liquidity got Cleaned Below...VANTAGE:NAS100 price is trading below the major supply band at 25,800 – 26,000.
This zone is the origin of the last impulsive sell-off and remains unmitigated supply.
As long as price stays below 26,000, the higher-timeframe bias remains bearish 🐼
On H1, market structure confirms this bias:
• Lower highs
• Weak reactions from demand
• Repeated failures below supply
The recent sell-off cleaned sell-side liquidity below 25,300, followed by a sharp reaction.
This move is not accumulation.
It is a liquidity grab followed by a corrective pullback.
🦈 Scalp
While the higher-timeframe bias remains bearish, a short-term scalp long 🦖 is possible only after a clear rejection from OG demand zones on lower timeframes.
• Sell-side liquidity already taken
• Execution strictly based on M15 / M5 / M3
Scalp activation criteria (OG Concept) on M15 / M5 / M3:
• Price taps OG demand zone
• Clear rejection from the OG zone (wick + displacement)
• Momentum shift with follow-through
• Failure to continue lower after the liquidity sweep
Scalp plan:
• Long only after OG zone rejection is confirmed
• Target: 25,480 – 25,520 (≈ 25,500 supply)
• This move is reactional, not a trend reversal
📌 No OG rejection = no trade.
🔴 Primary Scenario
Main idea: SELL the pullback
• Key supply zone: 25,480 – 25,520
• This zone aligns with:
• H1 supply
• Prior breakdown area
• Premium pricing within the current range
Execution logic:
• Price reaches supply
• Momentum weakens
• Rejection / failure to hold above the zone
• Continuation to the downside
Targets:
• 25,300 → partial profit
• 25,250 → liquidity retest
• 25,180 – 25,200 → extension
❌ Invalidation
• M15 close above 25,550
• Acceptance above supply invalidates the short idea
🧠 Smart Money Logic (OG Concept)
• Panic sell triggers liquidity
• Sell-side gets cleaned
• Price is pushed back into premium
• Retail chases the bounce
• Smart money distributes into supply
Two-phase play:
• Reaction long → into supply
• Distribution short → continuation dump
Bias remains sell-side while price trades below higher-timeframe supply.

NASDAQ doesn’t move randomly. It hunts liquidity.CAPITALCOM:US100 Price is currently trading inside a broken OG zone, after a clear distribution phase from the premium area.
Market structure remains bearish, with lower highs and weak upside reactions.
Short-term outlook (15M)
• Price failed to hold above the broken OG zone
• No strong bullish displacement or acceptance above resistance
• Liquidity is still resting below current price
• Expectation: continuation to the downside to sweep short-term liquidity
Mid-term outlook (1H)
• Overall structure remains bearish
• Previous OG zone acting as resistance
• Unfilled liquidity remains below the range lows
• As long as price stays below the broken zone, shorts remain valid
My expectation
I expect price to take the liquidity below and deliver a minimum 50-point drop from the current levels.
Any pullback into the broken OG zone can be considered a sell opportunity, as long as structure does not shift.

DEC.21,2025 ANALYSIS- DXY, BTC, NAS100, SPX500, XAUUSD & XAGUSDDXY CAUTION BEARISH: Weekly closing with a strong Bullish hammer candle suggests resistance block as shown could be broken for further upside. However due a hidden bearish divergence on RSI supported by the 21 EMA crossover resistance zone gives Bears an equal opportunity for reversal. I am personally watching a 5 wave pattern to bring the dollar index to a target around 96.961 This will ultimately close the gaps that occurred on October 5th to October 7th which also corresponds to the daily chart double tops target.
BITCOIN: STILL BEARISH, BTC has consolidated for the last 4 weeks now in a channel consolidation suggesting a bearish continuation rather than an accumulation for reversal. On the daily chart price has now exited the Bearish Flag pattern and I think based on the daily double tops rejection of the fib 0.382 retrace level within the bear flag formation, this week price action could gains momentum for the downtrend to test the liquidity zone of $80,524 and put the next target around $74k zone.
NAS100 & SPX500 WIDE RANGE TRADE: Both indices closed last week with a strong Bullish candles. Whiles our lower targets from last week wasn't achieved we got close enough. The setup this week spells caution as the gaps from last week's trade could now be filled as price is poised to test the all time high resistances again.
GOLD & SILVER ALMOST TOPPING: Gold on the weekly chart has hit a perfect double top with divergences on indicators like RSI and MACD. However, we still closed the week with a green candle suggesting that price could move towards $4,475 before getting rejected. The divergences don't give me a comfortable long position and so I will stay on the sideline and wait for confirmations for pullback trade towards the weekly 21 EMA.
Silver is still in a last wave and also ending so there is not much reward for the risk. My up target is about $68.38 before the major pullback. There are already divergences on the both daily and weekly chart but these divergences don't make the risk reward attractive for a long trade.
I hope my publications are helpful to your own analysis and perspective. Thank you and please show your support for these analysis with a boost or comment so it's shown to other traders and gets featured on Trading View editors desk. Have a great and profitable trading week and remember risk management is your first job as a trader. Cheers!!

DEC.14,2025 ANALYSIS- DXY, BTC, NAS100, SPX500, XAUUSD & XAGUSDDXY BEARISH: Weekly closing with a strong bearish candle for continuation to the downside after a small bounce to about 98.186 from the support zone of 97.820 or most likely sideways consolidation for this coming week. Ultimately, the gaps that occurred on October 5th to October 7th will be filled putting our next fall target to about 97.200 which also corresponds to the daily chart double tops target.
BITCOIN: STILL BEARISH, BTC has consolidated for the last 3 weeks and I think based on the daily double tops rejection of the fib 0.382 retrace level within the bear flag formation, this week actually gains momentum for the downtrend to resume with initial target at the liquidity zone of $80, 524 and a clear breakdown of the Bear flag trend line will put the next target around $74k zone.
NAS100 & SPX500 BEARISH: Both indices closed last week with a strong bearish engulfing candles. This confirms the retrace towards the highs is now completed and next leg down to targets of about $23,169 for Nas100 and $6,418 for SPX500 is highly probable this week.
GOLD & SILVER SIDEWAYS: Gold on the weekly chart has hit a double top with divergences on indicators like RSI and MACD. With a green closing candle on the weekly it's likely the tops of $4,381 could be tested before the pullback. Momentum is flat hence price could stays sideways first before the pullback. However, the daily chart is giving us a rejection candle from the previous high so I think a double tops could form unless a clear breakout occurs. Silver is in a last wave and also ending so there is not much reward for the risk. My up target is about $68.38 before the major pullback. There are already divergences on the both daily and weekly chart but these divergences are not confirmed until next week's candle print.
I hope my publications are helpful to your own analysis and perspective. Thank you and please show your support for these analysis with a boost or comment so it's shown to other traders and gets featured on Trading View editors desk. Have a great and profitable trading week and remember risk management is your first job as a trader. Cheers!!

NAS100 H4 | Potential Bearish DropMomentum: Bullish
The price has reacted off the sell entry, which is a pullback resistance
Sell entry: 25,569.52
Pullback resistance
Stop loss: 25,787.46
Multi swing high resistance
Take profit: 25,216.31
Overlap support
High Risk Investment Warning
Stratos Markets Limited (tradu.com ), Stratos Europe Ltd (tradu.com ):
CFDs are complex instruments and come with a high risk of losing money rapidly due to leverage. 70% of retail investor accounts lose money when trading CFDs with this provider. You should consider whether you understand how CFDs work and whether you can afford to take the high risk of losing your money.
Stratos Global LLC (tradu.com ): Losses can exceed deposits.
Please be advised that the information presented on TradingView is provided to Tradu (‘Company’, ‘we’) by a third-party provider (‘TFA Global Pte Ltd’). Please be reminded that you are solely responsible for the trading decisions on your account. Any information and/or content is intended entirely for research, educational and informational purposes only and does not constitute investment or consultation advice or investment strategy. The information is not tailored to the investment needs of any specific person and therefore does not involve a consideration of any of the investment objectives, financial situation or needs of any viewer that may receive it. Past performance is not a reliable indicator of future results. Actual results may differ materially from those anticipated in forward-looking or past performance statements. We assume no liability as to the accuracy or completeness of any of the information and/or content provided herein and the Company cannot be held responsible for any omission, mistake nor for any loss or damage including without limitation to any loss of profit which may arise from reliance on any information supplied by TFA Global Pte Ltd.

Nasdaq 100 Chart Analysis After the Fed DecisionNasdaq 100 Chart Analysis After the Fed Decision
The Nasdaq 100 index showed sharp volatility yesterday following the interest rate announcement. The market action can be interpreted as follows:
→ First, the FOMC decision was released: as expected, the Federal Funds Rate was cut from 4.00% to 3.75% (a bullish catalyst), which pushed the index up towards point A.
→ However, half an hour later Jerome Powell’s press conference began, and his tone was noticeably hawkish (a bearish catalyst). The Fed Chair signalled that the rate-cutting cycle has been paused because inflation remains elevated and additional labour-market data is needed. As a result, the index fell sharply from point A to the low at point B.
Meanwhile, Donald Trump criticised the Fed’s decision, arguing that rates should be cut far more aggressively. This adds to uncertainty, especially given expectations that Powell will leave his post in May 2026.
Bearish pressure on the tech index intensified further after Oracle’s earnings release — see yesterday’s post for details. The results disappointed investors, fuelling renewed talk of an AI bubble, and ORCL shares plunged around 11% in after-hours trading.
Technical Analysis of the Nasdaq 100 Chart
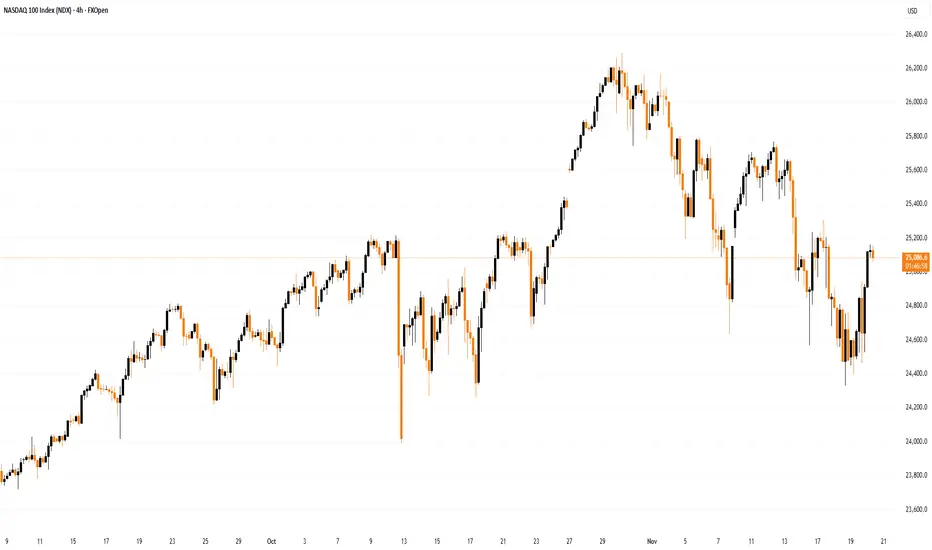
Looking at recent price action in the Nasdaq 100, the index appears to be forming a bearish Rounding Top pattern:
→ The peak at point A resembles a bull trap, as the price only slightly exceeded the December highs before reversing — in SMC terms, a sign of a bearish liquidity grab.
→ The price then broke support from several recent sessions around 25,570 after forming a large bearish candle (marked by the arrow). This indicates strong selling pressure (a market imbalance) and the area may now act as resistance.
It is possible that bulls will attempt to recover some of yesterday’s losses today. However, if any rebound stalls near this resistance zone, the Nasdaq 100 may continue to drift lower along a rounding downward trajectory.
This article represents the opinion of the Companies operating under the FXOpen brand only. It is not to be construed as an offer, solicitation, or recommendation with respect to products and services provided by the Companies operating under the FXOpen brand, nor is it to be considered financial advice.

NOV.30,2025 ANALYSIS ON SPX500 & NAS100 INDICES The monthly charts have printed hanging man candles and hence if the closing of next month candle is below the body of the candle, it will confirm that the rally is over and the next months have a bearish setup. Indicators also support the rally is over based on the weekly and daily charts on both indices.
The weekly candle looks bullish but since the volume is low it does not confirm the rally and is a market maker manipulation setup for retail traders. For shorts bias use tight stop loss, price should not exceed the invalidation levels noted in the video.
The daily charts also show a hidden bearish divergence on MACD Histogram bars, Stochastic cycle & Momentum at fib resistance of 0.786 retrace and Oct, 2023 fib extension of 1) for the SPX500 and fib 0.618 retrace for the NAS100. Daily Stoch cycles support shorts more than long. Price uprise since Wed, Nov 26th, has been on declining momentum, see MACD histogram on 4H. RSI is overbought on 4H with a hidden bearish divergence too.
So, I see more bearish signal on the indices than bullish continuation.
Thank you again for supporting my publications and consider giving my publication a boost and comment with your own insights too. Iron sharpens Iron, let conquer the market together. Cheers !!

NOV.23,2025 ANALYSIS- DXY, BTC, NAS100, SPX500, XAUUSD & XAGUSDDXY CAUTION: at weekly resistance but Uptrend with a huge bullish candle suggests continuation to the upside. I expect some sideway price action potential pullback to 99.365 level and then continuation to the upside target of 100.608. A break below 99.365 will invalidate upside targets.
BITCOIN: STILL BEARISH, All my initial bearish targets from previous analysis got smashed. BTC is now in a new bearish territory only finding support at the fib extension 1.618 from the $126,296 high. RSI is very oversold and potentially there could be a sideways price action around this level re-testing $80,524 this week. Ultimately the next bearish target is between $70k and $78k.
NAS100 & SPX500 BEARISH: Both indices closed with a strong bearish candle but found support around their 21EMA on the weekly chart. I observed some unconfirmed hidden divergence plus daily stochastics cycle lows so I expect some sideways consolidation and next leg down to targets of about $23,169 for Nas100 and $6,418 for SPX500.
GOLD & SILVER SIDEWAYS: Gold on the weekly chart showed only a doji candle consolidating price action but lower high of($4,194) confirmed on the chart. I envisage that this consolidation will continue into next week and finally breakdown to the $3,826 target. Silver has maintained the double tops on the weekly and daily charts. The lower high of $52.98 also suggest more downside price action with the initial target of $45 - $47 zone.
I hope my publications are helpful to your own analysis and perspective. Thank you and please show your support for these analysis with a boost or comment so it's shown to other traders. Have a great and profitable trading week and remember risk management is your first job as a trader. Cheers!!

NAS100 I Potential break of 25,217 Resistance Welcome back! Let me know your thoughts in the comments!
** NAS100 Analysis - Listen to video!
We recommend that you keep this on your watch list and enter when the entry criteria of your strategy is met.
Please support this idea with a LIKE and COMMENT if you find it useful and Click "Follow" on our profile if you'd like these trade ideas delivered straight to your email in the future.
Thanks for your continued support!

NOV.9,2025 ANALYSIS ON DXY, BTC, NAS100, SPX500, XAUUSD & XAGUSDDXY CAUTION trading Below 55 EMA on 4H however 4H divergence at support zone is promising for uptrend continuation. Trend is still up on the daily chart and currently getting push back from the 200SMA. There are indicators supporting uptrend continuation such as the MACD histogram still up on weekly chart and unconfirmed RSI Bullish divergence on the 4H timeframe. A breakdown below 99.029 could target the 98.700 level next. However if the current support holds then our next target is 100.608 for the coming week and confirmation signal is a candle open and close above the 55 EMA on the 4H timeframe.
BTC BEARISH SIDEWAYS consolidating on the weekly 55 EMA support. While the weekly 55 EMA has acted as a support during previous rallies on BTC, I think this time is different until proven otherwise by the chart as there is no RSI divergence, MACD momentum signal similar to previous signals on the current weekly chart. A breakdown of the 55 EMA on the weekly chart is very likely to reach the triple tops target of $88,016. Trade cautiously until we breakout of the daily sideways channel described in the video presentation.
NAS100 & SP500 BEARISH with 4H mom trending down. There is a support on the daily 55 EMA or weekly 9 EMA, but evidence supporting the bearish case is the MACD crossover and bearish histogram bars on daily charts. Weekly MACD and RSI signals serious divergences since July, 2025. My conclusion is that based on Bullish engulfing candle on 4H, I think there will be a bounce to the rise targets on the charts before dumping.
GOLD & SILVER SIDEWAYS: both consolidating in a pennant triangle on the 12H timeframe and I suggest it's best to wait for a breakout of the triangle for either a re-test of the all time highs to create a weekly divergence on the indicators or below the pennant triangle lows for the lower targets.
I did also examine the US10Y Yields as it affects both the dollar index and the equites market. The US10Y Yield seem to have bottomed it's downtrend on the 4H chart and currently consolidating above the 200 EMA and 55 EMA. I will be monitoring an uptick or a breakdown from this support zone.
These are my observation on the market this week and I thank you for visiting my publications.
Please give the publication a boost, comment with your insights and share with a trader you care about. They will thank you when it saves them from a bad trade or a missed opportunity. Have a profitable and great trading week. Cheers .

Tech Stocks Rally After Nvidia’s Earnings ReportTech Stocks Rally After Nvidia’s Earnings Report
As the chart shows, the Nasdaq 100 index is displaying positive momentum today. A strong catalyst for growth arrived with the release of Nvidia’s quarterly report, which exceeded Wall Street’s optimistic expectations.
Nvidia reported quarterly revenue of $57bn (vs. the expected $54.9bn), and earnings per share of $1.30 (forecast: $1.26). Meanwhile, CEO Jensen Huang stated that demand for the new Blackwell chips is “off the charts”.
Nvidia’s strong report revived “risk appetite” in the tech sector and eased concerns about a potential AI bubble.
Technical Analysis of the Nasdaq 100 Chart
Analysing the hourly chart of the Nasdaq 100 two days earlier, we:
→ noted that the previously active upward channel had broadened downwards;
→ suggested a scenario in which the bulls might attempt to return the index to an upward trajectory if Nvidia’s quarterly results were strong.
Yesterday’s report from the equity market leader confirmed that demand for artificial intelligence infrastructure remains enormous, paving the way for the tech-sector rally to continue.
From the standpoint of supply pressure, resistance may come from:
→ the upper red line drawn through the lower November highs;
→ the 25,400 level, which had acted as local support but was decisively broken by a large bearish candle.
On the other hand:
→ the decline towards 24,400 once again activated buying interest;
→ the November drop may prove to be only an intermediate correction, after which the upward trend could resume.
Whether the bulls can maintain positive momentum in the Nasdaq 100 following Nvidia’s strong quarterly figures will depend largely on the outcome of the delayed September US employment report, postponed due to the shutdown.
This article represents the opinion of the Companies operating under the FXOpen brand only. It is not to be construed as an offer, solicitation, or recommendation with respect to products and services provided by the Companies operating under the FXOpen brand, nor is it to be considered financial advice.
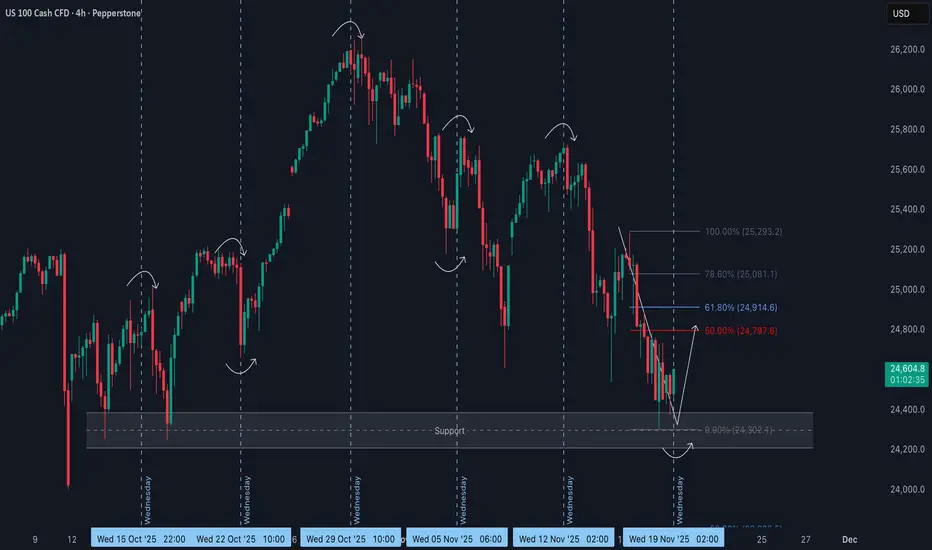
NAS100 Wednesday Reversal Potential from Key SupportOver the past several weeks, the NAS100 has shown a clear tendency for aggressive mid-week reversals, with Wednesdays repeatedly triggering sharp shifts in direction 🔄. This pattern suggests a strong time-based element in the algorithmic delivery of price, rather than random fluctuation.
🗓️ Each Wednesday has produced a notable reaction, whether through a liquidity grab, a stop run, or a full intraday reversal. With today being Wednesday once again, the timing aligns perfectly with the type of behaviour the market has been delivering consistently.
📉 The current decline has brought price directly into a well-defined high-timeframe support region. This area has a history of accumulation and typically holds a large amount of resting liquidity underneath it. The repeated wicks into this zone resemble classic Wyckoff spring behaviour 📦 — a sweep of sell-side liquidity followed by a potential response from larger players.
📐 The most recent bearish leg is noticeably overextended and has not offered a proper retracement since breaking lower. This leaves inefficiencies behind and increases the likelihood of a move back toward equilibrium.
🔄 Given the confluence of mid-week timing, the tap into higher-timeframe support, the liquidity sweep, and the extended nature of the current downswing, the expectation is for at least a corrective move back into equilibrium 📈.
A bullish break of short-term structure on the lower timeframes would strengthen this bias and open the door for a retracement into the premium levels listed above.
⚠️ Not financial advice. This is simply a technical outlook and my opinion.