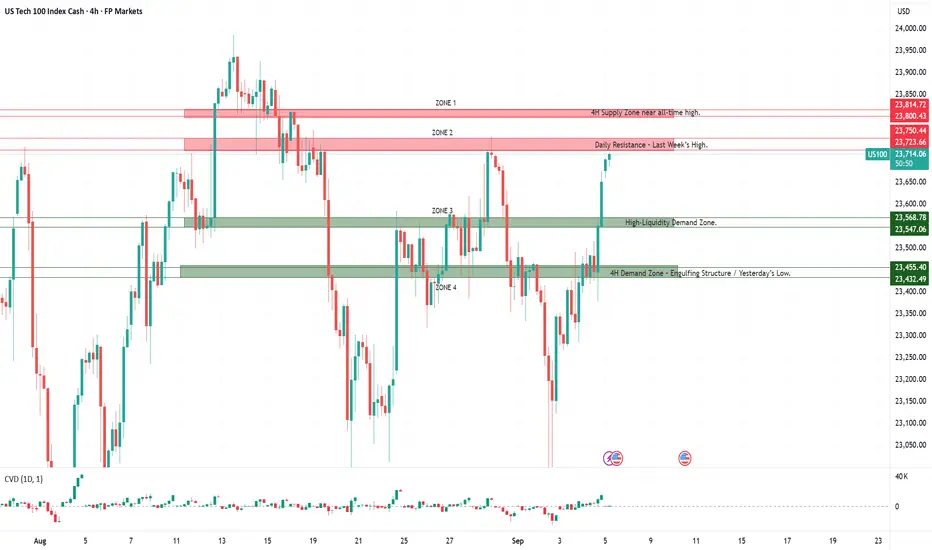
Nas100: Trading Zones at Record HighsKey Zones in Focus
Zone 1 – All-time high area:
This zone marks the current all-time high and therefore acts as immediate resistance. Price has already tested this area, and sellers may attempt to defend it, leading to potential rejection or short-term pullbacks. A clean breakout and sustained hold above this level would confirm bullish continuation into uncharted territory, opening the door for further upside momentum.
Zone 2 – Demand zone:
This zone represents a recent consolidation cluster where both buyers and sellers were actively positioning. As the breakout unfolded, this area shifted from resistance to support. Short-term buyers are likely to step in here to defend the trend. A decisive break back below this zone, however, would weaken bullish conviction and could trigger a deeper retracement toward lower levels.
The sentiment around the US100 has turned more optimistic following last week’s Federal Reserve meeting, where the central bank cut interest rates by 25 basis points — the first rate cut since December 2024. This concrete policy move has reinforced investor confidence that monetary conditions are shifting toward a more supportive stance. At the same time, strong momentum in the technology sector, highlighted by new AI-focused partnerships and improving trade signals between the U.S. and China, has further boosted risk appetite. While some caution remains regarding the pace of future cuts and macroeconomic headwinds, the overall market tone is positive, with traders viewing the recent policy shift as a catalyst for continued strength in the Nasdaq-100.
Nas100analysis

CAUTIOUS UPSIDE BUT BULLISH ON SPX500, NAS100 AND GOLDSPX500, NAS100 and GOLD are all reaching for higher price targets. They are all over stretched outside their normal ranges on the indicators but the divergences spotted on the charts are all not confirmed on a higher time frame suggesting that there could be an upside capitulation price action before a pullback occurs based on the divergences. Therefore cautious trading but Not opening new long positions at these level. Let's be patient and wait for the right opportunity.
On the other hand if you're looking for a short entry then place on a lot of risk management for the overshoot before the pullback.
Gold is an exception as it already done the pullback to the daily new POC zone and on 4 hours timeframe buyer have stepped up their buying activity defending the 55 EMA at $3,637.
I hope my analysis helps you form your own opinion and I thank you for listening to my publication. Cheers!!!

NAS100 Short SetupTrend: Bullish
Divergence: Bearish
Continuation Pattern : None
Reversal Pattern: Double Top
Bias: Bearish
Scenario: Sell Stop at Neckline breakout
Trade Plan
Stop Loss 24750
Entry Level 24400
TP1 24230

Nas100 – Today's Trading Zones Analysis 17 sep.Trading Zones
As price trades around all-time highs, the amount of historical data to build strong zones is limited. This makes the current levels less reliable, and traders should approach them primarily as guidance rather than decisive turning points.
Zone 1 – All-Time High / Yesterday’s High:
This area marks the recent record peak. While it can act as resistance in the short term, its strength is uncertain due to limited data. Price reactions here may be volatile and driven more by sentiment than structure.
Zone 2 – Yesterday’s Low:
A lighter support level that can provide intraday reactions but lacks deep structural confirmation. Best used as a reference point rather than a major decision area.
Zone 3 – Strong Support / High Profitability for Momentum:
This is the most significant zone on the chart, where strong buyers have previously stepped in. It carries a higher probability of triggering a strong reaction. That reaction could unfold as a bounce higher if demand holds, or as a sharp move lower if the zone breaks decisively.
All eyes are on today’s Fed meeting , where markets widely expect a 25bp rate cut. While the move is largely priced in, the real focus will be on Powell’s tone and the updated dot plot, which will guide expectations for the pace of easing ahead. Sentiment in the US100 remains cautiously optimistic, supported by strong tech momentum and softer inflation data, but with price trading at record highs, volatility is likely to spike if the Fed delivers any surprises.

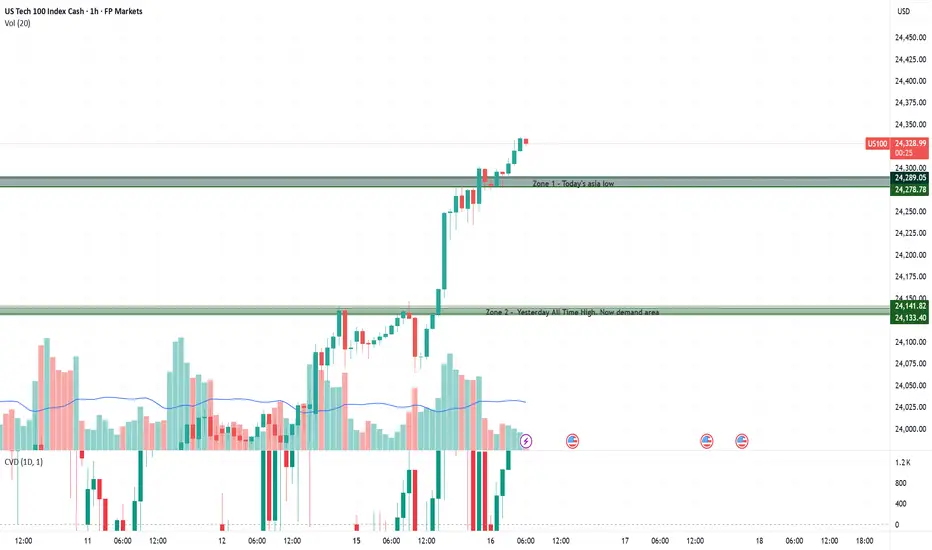
NAS100 Trading Zones – Navigating All-Time HighsThe Nasdaq is trading at all-time highs, which means there are no established sell zones above. In this environment, price is in full discovery mode. Every new tick higher sets fresh records, and volatility often picks up as traders probe for tops. That makes it difficult to fade strength, shifting the focus toward demand zones below as key areas for potential pullbacks.
🔹 Zone 1 – Today’s Asia Low (24,278–24,289)
This zone marks the intraday low from the Asian session and serves as the nearest short-term demand. A revisit here could attract buyers for a bounce, while a decisive break lower would signal loss of momentum and invite deeper retracement.
🔹 Zone 2 – Yesterday’s All-Time High, Now Demand (24,133–24,141)
Yesterday’s record high has flipped into a demand zone. As long as price holds above this level, the bullish structure stays intact. A strong rejection here favors continuation higher, but failure to hold could open the door to sharper downside.
Sentiment in the US100 remains cautiously optimistic. Softer labor data and easing producer prices have strengthened expectations of Fed rate cuts, while strong momentum in select tech names, including Oracle’s upbeat cloud outlook, continues to drive the index higher. Still, with price trading near all-time highs, volatility is elevated and the backdrop fragile, leaving traders mindful that optimism rests heavily on the Fed delivering on dovish expectations.
NAS100 Pullback into Fibonacci Zone: Watching for Bullish Break📊 NASDAQ 100 (NAS100) Update 📊
The NAS100 is in a strong bullish trend 🟢📈, clearly visible on the 4H chart ⏰ with consistent higher highs and higher lows 🔼🔼.
Currently, price has pulled back 🔽 right into my optimal entry zone 🎯 based on the Fibonacci retracement 🔢. From here, I’ll be watching closely for a bullish break of structure (BOS) 🔓 on the 15M timeframe ⏰ — that would be my signal to look for a long entry 🚀.
⚠️ This breakdown is educational only and not financial advice. 📚

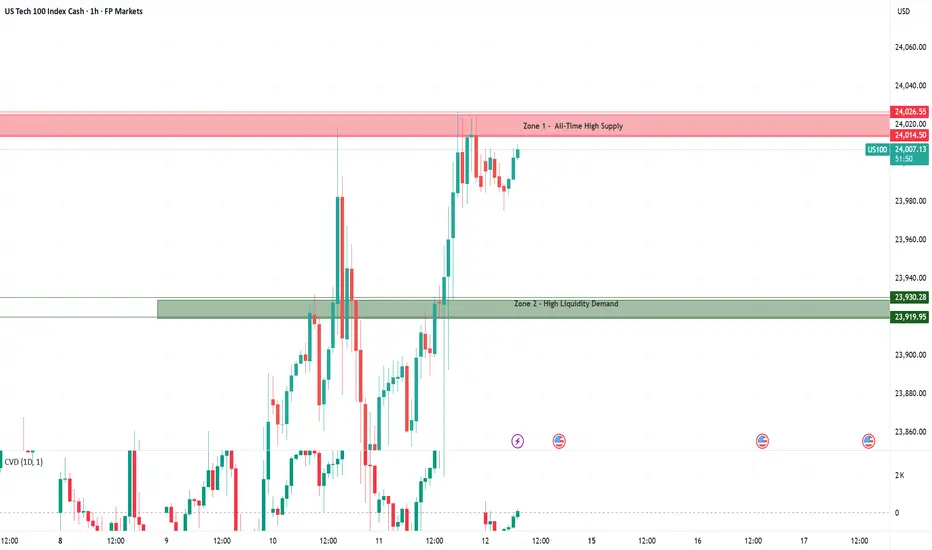
Nas100 – Trading Zones to Watch Near HighsZone 1 – All-Time High Supply (24,133 – 24,142)
This zone sits right at the all-time high, where volatility and liquidity are elevated. Sellers are likely to defend aggressively here, making sharp rejections common. A clean breakout and acceptance above would show strong buyer conviction and could trigger momentum into new record territory.
Zone 2 – High Liquidity Demand (24,014 – 24,026)
This area reflects a high-liquidity pocket where buyers previously absorbed heavy selling pressure. Pullbacks into this zone may attract renewed demand, offering potential long setups. If the zone breaks decisively, however, it risks flipping into resistance and signaling continuation lower.
Sentiment in the US100 remains cautiously constructive. Optimism is fueled by strong tech leadership and expectations of upcoming Fed rate cuts, while softer labor data and cooling producer prices have eased pressure on yields. Still, inflation readings surprised slightly to the upside last week, reminding traders that risks remain. With price now testing all-time highs, volatility is elevated and the market’s mood is fragile momentum is there, but it requires confirmation through clean breakouts rather than relying on hope alone.

NAS100 Bullish SetupNAS100 is bullish on H1 timeframe making HHs & HLs, currently there is no divergence on RSI and it is trending in ascending channel pattern, we will make enty at 0.382 FIB. Trade plan is mentioned.

Nas100 – Today’s Key Trading ZonesTrading zones
Zone 1 – All-Time High Supply (24,014 – 24,026)
This zone sits at the all-time high, where volatility and liquidity hunts are often at their peak. Sellers are likely to defend aggressively here, making sharp rejections common. A clean breakout and hold above would indicate strong buyer conviction and could open the door for further momentum into uncharted territory.
Zone 2 – High Liquidity Demand (23,920 – 23,930)
This demand zone represents a high-liquidity pocket created by prior consolidation. Buyers are expected to step in here on pullbacks, providing potential long setups. However, if the zone fails to hold, it may flip into resistance and trigger continuation downside moves.
With price trading near all-time highs, only two zones are marked today. Volatility at record levels makes price action less structured, leaving limited data to build reliable zones from. As a result, focus remains on the all-time high supply zone above and the high-liquidity demand zone below as the key areas for potential reaction.
Sentiment in the US100 is cautiously positive but fragile. Strong tech momentum and expectations of Fed rate cuts support the index, while softer labor data and cooling producer prices ease pressure on yields. Still, higher-than-expected CPI reminds investors that inflation risks remain, keeping markets on edge near all-time highs.
NAS100 Trend Analysis: From Higher Highs to a Potential Shift📊 NASDAQ 100 (NAS100) Analysis 📊
Someone recently asked me to cover the NAS100 🤔 as price action can look a little confusing right now. On the 4H chart ⏰, we’ve been trending strongly 🟢📈 throughout the week. However, as we head into the end of the week 📅, things are starting to shift.
Zooming into the 30M timeframe 🔍, price action is showing early signs of weakness ⚠️. We’ve had a high, then a higher high ⬆️, and now a lower high 🔽 — instead of a continuation of higher highs.
In the video, we take a deep dive 🎥 into market structure 🏗️, price action 💡, and the trend 📊, highlighting what to watch out for as institutions and big players wind up or unwind positions 💼 into the week’s close.
💬 Your thoughts and comments are welcome!
⚠️ This is educational only and not financial advice. 📚

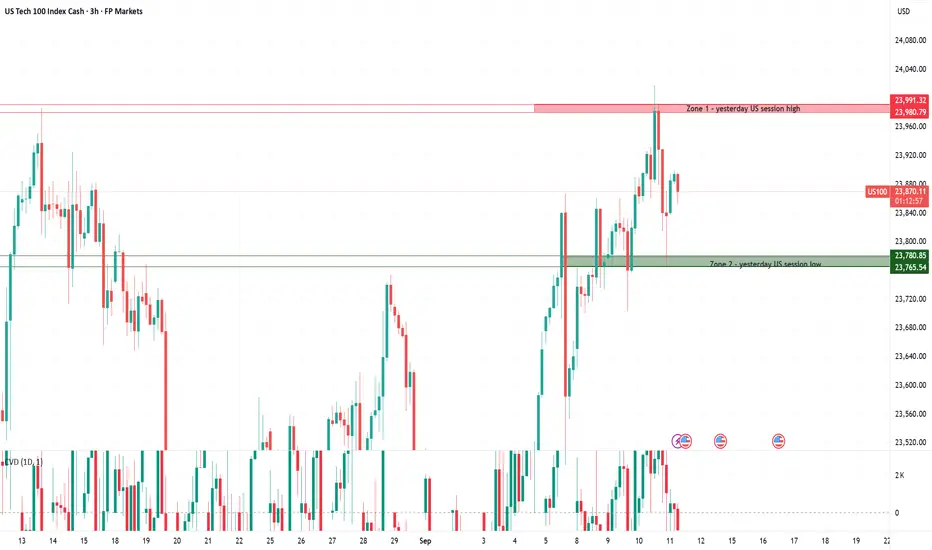
NAS100 Trading Zones – Volatility at All-Time HighsZone 1 – 23,980 – 23,991
This zone sits just below the all-time high, making it a critical supply area where volatility tends to spike. Sellers are likely to defend here aggressively, and false breakouts are common as liquidity is swept around all-time highs. A clean breakout and hold above would signal strong buyer conviction and could fuel a momentum push into uncharted territory.
Zone 2 – 23,765 – 23,781
This zone represents a key demand area where buyers previously stepped in to defend intraday lows. A sharp bounce here would confirm renewed buying interest, while a decisive break below would shift control back to sellers and could trigger a deeper correction.
With price trading near all-time highs, caution is warranted. Volatility often spikes in these areas, as liquidity hunts and false breakouts are common. Traders should be selective, waiting for clear confirmation before committing to new positions.
Sentiment in the US100 remains cautiously positive, supported by strong momentum in select tech names and growing expectations of Fed rate cuts after softer labor data and a sharp drop in producer prices. Lower input costs are viewed as supportive for corporate margins in the near term, while falling yields continue to benefit growth stocks. Still, the broader backdrop is fragile, as weaker job revisions and signs of cooling demand remind investors that economic momentum is slowing.
NAS100 - Trading Zones and Market SentimentZone 1 – 23,926 – 23,943
This is a critical resistance area sitting just below the all-time high. Sellers are likely positioned here, making it a strong zone for potential rejection. A clean breakout and successful retest, however, would flip the zone into demand and open the path toward fresh highs.
Zone 2 – 23,854 – 23,880
Formed around recent consolidation and breakout structure. Buyers are expected to defend this zone on pullbacks, creating potential long opportunities. If broken decisively, it could turn into resistance, signaling weakening momentum.
Zone 3 – 23,782 – 23,798
A deeper demand level aligned with prior absorption and intraday lows. Likely to attract liquidity sweeps and sharp reactions on first touch. A failure here would shift control back to sellers and suggest a larger corrective move.
Sentiment in US100 Today: Between Optimism and Caution
Retail investors pull back from most Big Tech, except Nvidia and Palantir.
According to Charles Schwab’s STAX activity, retail investors have generally reduced exposure to large-cap tech stocks, with the exception of Nvidia and Palantir, which both saw significant net buying. This points to rising risk appetite, particularly toward select growth names in the tech sector.
Job revision data weakens the economy, but keeps rate expectations alive.
Wall Street remains subdued but continues to lean on the likelihood of a Fed rate cut, after job growth was revised down by nearly 1 million over the past 12 months.
Conclusion: Sentiment in the US100 remains cautiously optimistic, driven by a strong tech sector and dovish Fed expectations but the foundation is fragile, especially in light of weaker economic signals.

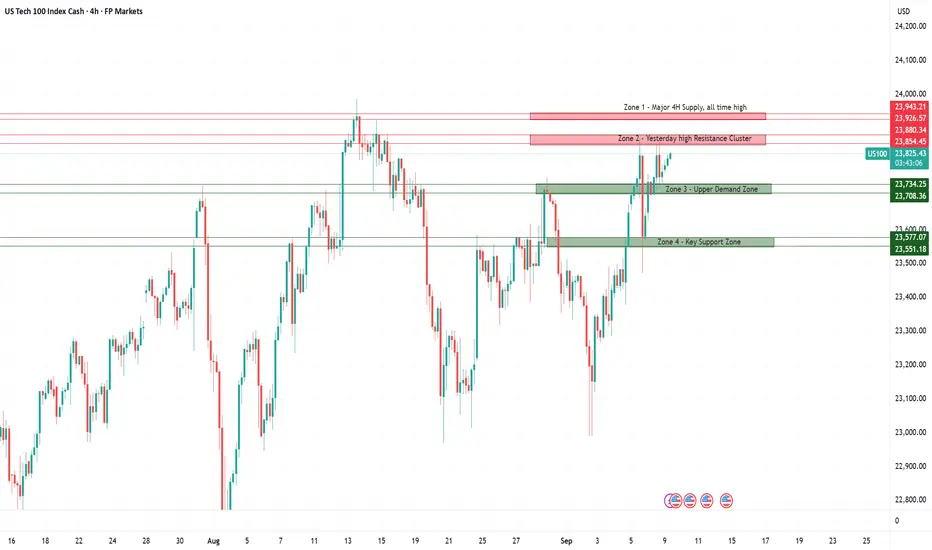
Nasdaq-100: Trading Levels to WatchKey Zones Today
Supply Zones (Red)
Zone 1: 23,926 – 23,943
This is the upper resistance zone, located just below all time high. Sellers are likely positioned here, making it a strong area for potential rejection. A confirmed breakout and retest, however, would indicate buyer strength and could open the path toward new all-time highs.
Zone 2: 23,854 – 23,880
A key intraday supply area with multiple prior rejections. Often acts as a liquidity pool, where failed breakouts can trigger sharp downside moves. A clean break and hold above would flip this zone into short-term support for continuation longs.
Demand Zones (Green)
Zone 3: 23,708 – 23,734
Formed around the recent breakout structure, this zone is expected to attract buyers on pullbacks. A sharp bounce here would confirm demand strength, while a decisive break below flips the area into resistance and could trigger continuation shorts.
Zone 4: 23,551 – 23,577
A deeper support level, aligned with prior consolidation and buyer absorption. Strong bounce potential on first retest, but repeated tests weaken the level. A breakdown here would shift momentum clearly in favor of sellers and open space for a larger downside move.
Nas100 - Cautiously Bullish, Waiting on Momentum
Sentiment in the US100 is cautiously positive but fragile. Large-cap tech continues to support the index, and hopes of imminent Fed rate cuts provide additional tailwinds. Still, the index remains below its all-time high, and uncertainty around economic data and geopolitics keeps investors from going all-in.
In short: there is momentum and optimism, but it rests on a fragile foundation where a single weak data point could quickly shift sentiment.
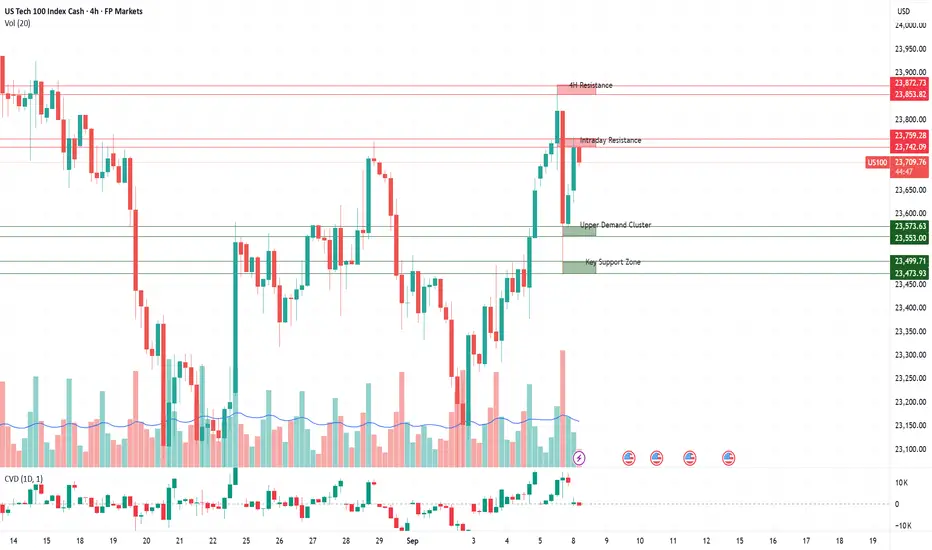
Nas100: Trading Levels in FocusSupply Zones (Red)
23,853 - 23,873
A strong supply zone near recent highs. Sellers are expected to defend aggressively here, making it a potential rejection area. A confirmed breakout and retest, however, could open the path toward new highs.
23,742 – 23,759
This zone reflects last week’s high-volume rejection. Acts as an intraday decision area: sharp rejections can trigger short setups, while a clean break and hold above would strengthen bullish momentum.
Demand Zones (Green)
23,553 – 23,573
A fresh demand zone aligned with recent breakout structure. Buyers may attempt to defend here for continuation longs. If broken, the zone flips into resistance, adding downside pressure.
23,473 – 23,500
Well-tested support area with prior absorption. Strong bounce potential, but multiple retests increase the risk of a breakdown. A failure here would likely accelerate bearish momentum.
Overall Sentiment: Cautiously Bullish on Fragile Ground
At its core, the market is cautiously optimistic right now. Positive momentum from Big Tech and expectations of looser monetary policy are fueling short-term upside potential. At the same time, consolidation and uncertainty around macro data keep sentiment restrained. Momentum is present but it relies on breakout moves holding.
NAS100 Bearish Reversal from Supply Zone – Short SetupThe NAS100 (1H chart) is trading within a channel structure marked by a rejection line (resistance) and a support line. Price recently broke below the EMA (70 & 200), showing bearish momentum.
Supply Zone (POI): 23,524 – 23,637, where price may retest before further decline (potential short entry zone).
Trend: Current momentum is bearish after rejection from channel resistance.
Support/Target: Main downside target is 22,979 – 22,905, aligning with previous swing low and Fibonacci extension area.
EMA Strategy: Price below both 70 & 200 EMA indicates bearish trend continuation.
Structure Break: Breakdown of channel support suggests sellers are in control.
📌 Trading Plan:
Entry (Sell Zone): 23,524 – 23,637 (POI Supply Zone)
Stop Loss: Above 23,640 (channel resistance)
Target: 22,979 – 22,905
Conclusion:
Market is in bearish structure. Wait for pullback to supply zone for a high-probability short entry, targeting the lower support zone.

US100 – Today’s Key Trading ZonesHere are today’s trading zones for the US100. The levels are not fixed buy or sell signals, but decision areas where price often accelerates. Rejections can set up counter-trades, while clean breaks and retests can create continuation opportunities.
Zone 1
This area represents a major resistance close to the historical top. Price entering this zone carries a high probability of seller absorption and sharp rejection. A clean breakout and hold above would shift sentiment and open the door for new highs.
Zone 2
A key decision area from previous weekly highs. Often acts as a liquidity pool where breakout traps are common. A strong rejection can offer short opportunities, while a confirmed break and retest may flip the zone into support.
Zone 3
This level has repeatedly attracted strong reactions and carries high resting liquidity. Expect aggressive order flow here – either a sharp bounce for longs or, if broken, a continuation short on retest.
Zone 4
Formed around a strong 4H engulfing pattern and aligned with yesterday’s low. Buyers are likely to defend this level, making it a key intraday demand zone. A decisive break below would indicate seller dominance and could accelerate downside momentum.
Market Sentiment – Cautious Optimism
Overall sentiment in the US100 remains cautiously optimistic, supported by strong performance in Big Tech and expectations of a more dovish Fed. Still, the backdrop is fragile given broader macroeconomic signals, with investors balancing optimism against underlying economic risks.
Big Tech Drives the Market
Large-cap tech stocks led the market higher at record pace. Alphabet surged nearly 9%, Apple advanced 3–4%, and Tesla gained about 1.4%, boosted by a favorable antitrust ruling and strong technical momentum. Alphabet even reached a new record high, underscoring the sector’s ability to lift the entire index.
Macro Data – Mixed but Supportive
Weaker job openings data reinforced expectations of Fed rate cuts, a positive driver for growth stocks as lower bond yields support risk appetite. At the same time, the ISM Services PMI rose to 52.0, marking a third straight month of expansion and showing resilience in the services sector despite manufacturing weakness and a cooling labor market.
NAS100 H4 | Heading into pullback resistanceNAS100 is rising towards the sell entry at 23,720.82, which has been identified as a pullback resistance and could reverse from this level to the downside.
Stop loss is at 23,927.51, which is a swing high resistance.
Take profit is at 23,097.53, which is a multi swing low support.
High Risk Investment Warning
Trading Forex/CFDs on margin carries a high level of risk and may not be suitable for all investors. Leverage can work against you.
Stratos Markets Limited (tradu.com ):
CFDs are complex instruments and come with a high risk of losing money rapidly due to leverage. 65% of retail investor accounts lose money when trading CFDs with this provider. You should consider whether you understand how CFDs work and whether you can afford to take the high risk of losing your money.
Stratos Europe Ltd (tradu.com ):
CFDs are complex instruments and come with a high risk of losing money rapidly due to leverage. 66% of retail investor accounts lose money when trading CFDs with this provider. You should consider whether you understand how CFDs work and whether you can afford to take the high risk of losing your money.
Stratos Global LLC (tradu.com ):
Losses can exceed deposits.
Please be advised that the information presented on TradingView is provided to Tradu (‘Company’, ‘we’) by a third-party provider (‘TFA Global Pte Ltd’). Please be reminded that you are solely responsible for the trading decisions on your account. There is a very high degree of risk involved in trading. Any information and/or content is intended entirely for research, educational and informational purposes only and does not constitute investment or consultation advice or investment strategy. The information is not tailored to the investment needs of any specific person and therefore does not involve a consideration of any of the investment objectives, financial situation or needs of any viewer that may receive it. Kindly also note that past performance is not a reliable indicator of future results. Actual results may differ materially from those anticipated in forward-looking or past performance statements. We assume no liability as to the accuracy or completeness of any of the information and/or content provided herein and the Company cannot be held responsible for any omission, mistake nor for any loss or damage including without limitation to any loss of profit which may arise from reliance on any information supplied by TFA Global Pte Ltd.
The speaker(s) is neither an employee, agent nor representative of Tradu and is therefore acting independently. The opinions given are their own, constitute general market commentary, and do not constitute the opinion or advice of Tradu or any form of personal or investment advice. Tradu neither endorses nor guarantees offerings of third-party speakers, nor is Tradu responsible for the content, veracity or opinions of third-party speakers, presenters or participants.

NAS100 H4 | Bearish drop offNAS100 has rejected off the sell entry of 23,475.21, which is a pullback resistance that lines up with the 38.2% Fibonacci retracement and could drop from this level to the downside.
Stop loss is at 23,575.82, which is a pullback resitance that aligns with the 61.8% Fibonacci retracement.
Take profit is at 23,110.94, which is a swing low suport that is slightly below the 161.8% Fibonacci extension.
High Risk Investment Warning
Trading Forex/CFDs on margin carries a high level of risk and may not be suitable for all investors. Leverage can work against you.
Stratos Markets Limited (tradu.com ):
CFDs are complex instruments and come with a high risk of losing money rapidly due to leverage. 65% of retail investor accounts lose money when trading CFDs with this provider. You should consider whether you understand how CFDs work and whether you can afford to take the high risk of losing your money.
Stratos Europe Ltd (tradu.com ):
CFDs are complex instruments and come with a high risk of losing money rapidly due to leverage. 66% of retail investor accounts lose money when trading CFDs with this provider. You should consider whether you understand how CFDs work and whether you can afford to take the high risk of losing your money.
Stratos Global LLC (tradu.com ):
Losses can exceed deposits.
Please be advised that the information presented on TradingView is provided to Tradu (‘Company’, ‘we’) by a third-party provider (‘TFA Global Pte Ltd’). Please be reminded that you are solely responsible for the trading decisions on your account. There is a very high degree of risk involved in trading. Any information and/or content is intended entirely for research, educational and informational purposes only and does not constitute investment or consultation advice or investment strategy. The information is not tailored to the investment needs of any specific person and therefore does not involve a consideration of any of the investment objectives, financial situation or needs of any viewer that may receive it. Kindly also note that past performance is not a reliable indicator of future results. Actual results may differ materially from those anticipated in forward-looking or past performance statements. We assume no liability as to the accuracy or completeness of any of the information and/or content provided herein and the Company cannot be held responsible for any omission, mistake nor for any loss or damage including without limitation to any loss of profit which may arise from reliance on any information supplied by TFA Global Pte Ltd.
The speaker(s) is neither an employee, agent nor representative of Tradu and is therefore acting independently. The opinions given are their own, constitute general market commentary, and do not constitute the opinion or advice of Tradu or any form of personal or investment advice. Tradu neither endorses nor guarantees offerings of third-party speakers, nor is Tradu responsible for the content, veracity or opinions of third-party speakers, presenters or participants.

Bullish bounce off 61.8% Fibonacci support?US100 is falling towards the support level which is a pullback support that aligns with the 61.8% Fibonacci retracement and could bounce from this level to our take profit.
Entry: 23,289.88
Why we like it:
There is a pullback support that aligns with the 61.8% Fibonacci retracement.
Stop loss: 22,983.03
Why we like it:
There is a multi-swing low support.
Take profit: 23,729.56
Why we like it:
There is a pullback resistance.
Enjoying your TradingView experience? Review us!
Please be advised that the information presented on TradingView is provided to Vantage (‘Vantage Global Limited’, ‘we’) by a third-party provider (‘Everest Fortune Group’). Please be reminded that you are solely responsible for the trading decisions on your account. There is a very high degree of risk involved in trading. Any information and/or content is intended entirely for research, educational and informational purposes only and does not constitute investment or consultation advice or investment strategy. The information is not tailored to the investment needs of any specific person and therefore does not involve a consideration of any of the investment objectives, financial situation or needs of any viewer that may receive it. Kindly also note that past performance is not a reliable indicator of future results. Actual results may differ materially from those anticipated in forward-looking or past performance statements. We assume no liability as to the accuracy or completeness of any of the information and/or content provided herein and the Company cannot be held responsible for any omission, mistake nor for any loss or damage including without limitation to any loss of profit which may arise from reliance on any information supplied by Everest Fortune Group.

NAS100 Overextended: Support or Further Downside Ahead?The NAS100 is currently overextended following Friday’s strong rally. From a technical perspective, I’m anticipating a potential retracement toward equilibrium, aligning with the 50% Fibonacci level of the prior price swing. This zone will be key in determining whether price establishes support and resumes its bullish continuation, or if a breakdown occurs that could signal further downside risk. (Not financial advice.)

NAS100 dropped on 1.32% on August 19NAS100 dropped on 1.32% on August 19 as market participants are waiting for Powell's key rate comments
The Nasdaq and S&P 500 dipped on August 19, led by tech stocks, as investors awaited Federal Reserve Chair Jerome Powell’s comments on interest rates at the Jackson Hole symposium (Aug. 21-23). Analysts, including James Cox of Harris Financial Group, suggest markets are bracing for a possibly hawkish stance from Powell. Interest rate futures indicate two 25 bps cuts this year, starting in September. Concerns also rose over AI stocks after OpenAI’s CEO Sam Altman called them a bubble in a recent "The Verge" interview.
The price continued to drop during Asian and early European trading hours and reached the SMA200 on 4-h chart. This moving average is a traditionally strong support. The further rebound towards 23,500.00 level is expected with a final target of 23,700.00.
NASDAQ – Is the Top Finally In?In my past two NAS analyses, I argued that the index was overstretched and vulnerable to a deep correction. Even the fact that from the April bottom to mid-August it surged nearly 50% should have raised big red flags — that kind of move rarely sustains without a meaningful pullback.
At this moment, the technical picture has shifted significantly. The index has broken two critical levels:
1. The ascending trendline drawn from the recent low.
2. The horizontal support defined by the previous all-time high.
Losing both of these supports in quick succession suggests the bullish momentum is fading and a top may already be in place.
If this scenario unfolds as expected, selling pressure could intensify in the coming sessions. My first downside target stands in the 22,700 zone, with further weakness possible if the correction develops into a broader risk-off cycle.
Disclosure: I am part of TradeNation's Influencer program and receive a monthly fee for using their TradingView charts in my analyses and educational articles.

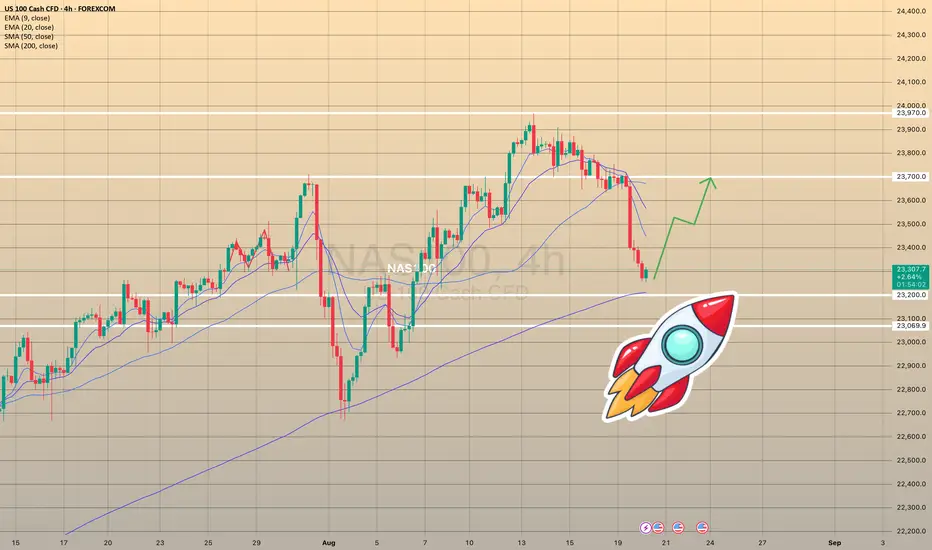
USTECH Long Opportunity USTECH has been making some bullish strides and continues the overall bullish trend. Last week, price broke above the major pivot level at $23680 and seems to be maintaining its bullish structure
Price is currently in a retracement and is testing the $23680 level where i am expecting a bounce to the upside in continuation with the bullish trend.
From the higher timeframes price is trading above all 3 SMA and in the bullish region of the RSI. on the 1 hour timeframe, price is maintaining its position above the Bullish support trendline and the 200 SMA which adds to the bullish move i am looking at.
Alternatively if price continues to move down, i am targeting the support level at $23520 where buyers are sitting and having enough momentum to push the market higher.
Looking for long positions from either the $23680 or alternatively the $23520 level.
