XAU/USD | Going strong! (READ THE CAPTION)By examining the Hourly chart of Gold, we can see that Gold has been on bullish run and still shows no evidence of slowing down or for a reversal. I expect a little bit of correction before going for the next targets.
For the time being, the targets are: 5111, 5141, 5171 and 5200.
Nasdaq

IREN - One More WaveWe are analyzing the move from December 2025 to the present.
This move can be broken down into four impulse waves so far, meaning one final fifth wave is still ahead.
Key reversal targets:
65
71
Estimated upside potential from current levels:
9–18%
---
Please subscribe and leave a comment!
You’ll get new information faster than anyone else.
---

Bullish Divergence appearing on bigger tf.MASK Analysis
CMP 0.2395 (27-01-2026)
Bullish Divergence appearing on bigger tf.
It seems safe as long as it stays above 0.1750
Crossing 0.5148 wiht Good Volumes & Sustaining
this level may initiate aggressive move towards 2.

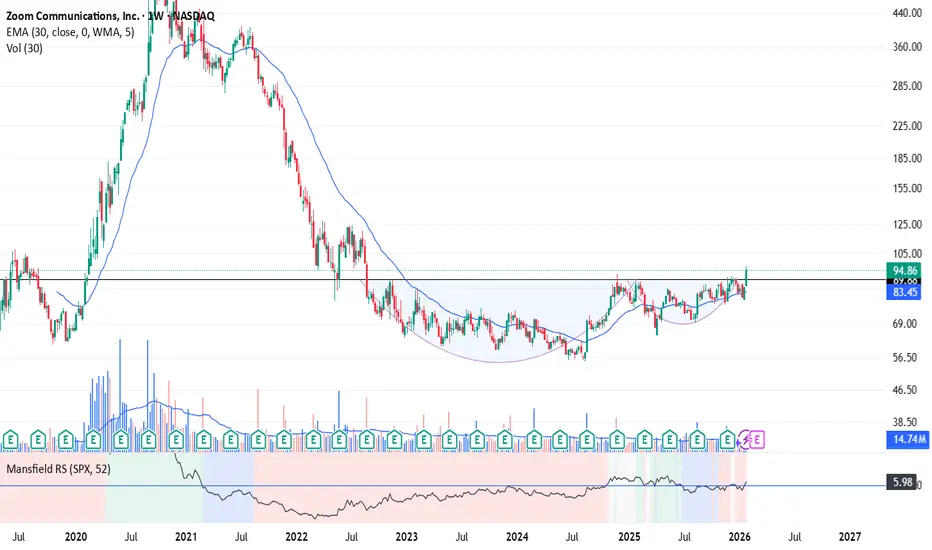
Break out on Zoom? Cup and Handle pattern is seen on this weekly chart but started forming in Aug 2022. Now in early stages of breakout, but not confirmed yet.
Nasdaq Retests January Highs + BSL – Rejection Here?Hello Fellow Traders,
We're looking at the Nasdaq (NQ or NDX) today.
The index has retested and taken out the January highs again — hitting major buy-side liquidity from earlier in the month.
Right now, the market is in a major consolidation phase and could stay range-bound through much of Q1. We're trading in premium territory relative to the broader dealing range — so a correction down to the discount area (below equilibrium) feels likely and healthy in this environment.
If we see clear rejection signs from the current area (e.g., strong wicks, failure to hold highs, or displacement lower), expect a potential waterfall move down to the highlighted discount PD Arrays.
Focus on reactions at those PD Arrays (like FVGs, NDOG/NWOG, Order Blocks, etc.) — not just price.
Example: If the top highlighted FVG breaks with displacement (strong move through it), it flips to an iFVG (inverted FVG). Any retracement back into that iFVG becomes a solid short signal.
Vice versa for lower arrays — bullish reactions there could confirm continuation or reversal.
Bias: Still overall bullish macro, but short-term correction to discount zones is expected to reload buyers. Watch for confirmation at those PD Arrays before acting — patience pays!
Keep risk tight, especially in choppy consolidation. What's your view on Nasdaq? Expecting rejection and drop, or breakout higher first? Drop your thoughts below!
#Nasdaq #NQ #NDX #TechnicalAnalysis #SMC #ICT #PDArrays #FVG #Forex #Indices

#GBPJPY , Next one !📊 Morning Market Brief | London Session Prep
🔎 Instrument Focus: #GBPJPY
⚠️ Risk Environment: High
📈 Technical Overview:
Another Sell setup at yesterday POI ? lets see
🚀 Trading Plan:
• Need valid Momentum Structure
• LTF ENTRY NEEDED
• Just and Only for QuickScalp
🧠 Stay updated with real time news and macro events, visit 👉 @News_Ash_TheTrader_Bot
#Ash_TheTrader #Forex #EURUSD #MarketInsight #PriceAction #TradingPlan #RiskManagement #LondonSession #Scalping #Futures #NQ #Gold

Steel Dynamics - Interesting StructureThe move since April 2025 is viewed as the fifth sub-wave within a larger third wave.
The third wave has a complex structure and may initially appear to violate Elliott Wave rules, but this is not the case.
At the moment, the larger fourth wave is expected to start forming.
A correction of the fifth sub-wave is expected, moving toward the price level from which it started.
Key targets:
154
144
134
120
---
Please subscribe and leave a comment!
You’ll get new information faster than anyone else.
---

NASDAQ NQ A Breakout Can Come, Wait For The ConfirmationAs I posted earlier, all of our FCP levels and zones have been working great and have given us tremendous opportunities. Now NQ is back at the upper zone and the momentum is looking great. If this breakouts we can test previous high and possibly go to all time highs.
I have updated a few new levels on the chart.
Trade what you see, wait for the confirmations and manage the risk as always.
Follow for more. Please support this analysis by liking, commenting, and sharing with friends, colleagues, traders, and trading communities. Thanks👍🙂

Apple - Going DeeperIt looks like a full five-wave structure has formed.
Waves 1 and 5 are almost equal in size.
We may still see a short push higher, back toward 288 , and then the move down begins.
Alternatively, the decline could start from the current level.
Potential targets:
260 -> 243 -> 229
---
Please subscribe and leave a comment.
You’ll get new information faster than anyone else.
---

ETM (OTC: GDLNF) Spikes Over +119% Since Our Alert ETM (OTC: GDLNF) Spikes Over +119% Since Our Alert
Following our December 30th coverage of Energy Transition Minerals Ltd. (ASX: ETM | OTC: GDLNF), the trend continues to develop in our favor as price consolidates just below key breakout levels. In the most recent OTC session, GDLNF closed at $0.13, up +8% on the day, with 2,524,050 shares traded, confirming that participation remains elevated even after the prior surge.
Zooming out, ETM has already delivered outsized gains from our initial alert near $0.091, previously pushing as high as the $0.20 range. The stock is now up +146.84% over the past 52 weeks, and current price action suggests it is digesting gains, not giving them back.
Momentum remains constructive, with RSI at 63, indicating strength without entering overheated territory — often the zone where continuation moves begin to form.
The earlier surge was not random. It coincided with meaningful strategic developments, including the appointment of Ballard Partners and Cohen & Company Capital Markets to support U.S. engagement and a potential Nasdaq listing, as well as continued focus on the Kvanefjeld rare earths project in Greenland
Friday January 09, 2026: Press Release
"Energy Transition Minerals Ltd (ASX: ETM) announced the lapse of 1.2 million unquoted performance rights (ETMAC) after the attached conditions were not met, with no consideration paid and no impact on cash. Importantly, these rights will not convert into shares, reducing potential future dilution and leaving the company’s capital structure cleaner, with approximately 1.98 billion ordinary shares, 68.75 million options, and 89.47 million performance rights remaining on issue—making this a routine governance update rather than a negative fundamental development."

NASDAQ Will the 2-month Resistance hold and cause a correction?Nasdaq (NDX) opened lower today but quickly recovered as it hit its 1D MA50 (blue trend-line). With last week's Low being on the 1D MA100 (green trend-line), the level that has caused the last two major rebounds since November 21 2025, the market focus shifts again on Resistance 1 (almost 2 months intact), which has caused the last 4 top rejections.
With the Lower Highs trend-line also since its All Time High holding and a huge 1D RSI Lower Highs Bearish Divergence since September 22 2025, as long as the market doesn't close a 1D candle above Resistance 1, we expect a bearish reversal first to 24900 (just above Support 1) and if Support 2 breaks, bearish extension targeting the 1D MA200 (orange trend-line) around 24200.
---
** Please LIKE 👍, FOLLOW ✅, SHARE 🙌 and COMMENT ✍ if you enjoy this idea! Also share your ideas and charts in the comments section below! This is best way to keep it relevant, support us, keep the content here free and allow the idea to reach as many people as possible. **
---
💸💸💸💸💸💸
👇 👇 👇 👇 👇 👇

Steel Dynamics (STLD) Set for Breakout Amidst Earnings Reports Shares of Steel Dynamics, Inc. (NASDAQ: NASDAQ:STLD ) are gearing for amidst earnings reports slated for today before market open.
The stock is already up 2.94% in Monday's premarket session. breaking out of a bullish rectangle pattern albeit market momentum. With the last recorded RSI at 63 NASDAQ:STLD is poise to hit new highs today.
Financial Performance
In 2024, Steel Dynamics's revenue was $17.54 billion, a decrease of -6.68% compared to the previous year's $18.80 billion. Earnings were $1.54 billion, a decrease of -37.28%.
About STLD
Steel Dynamics, Inc., together with its subsidiaries, operates as a steel producer and metal recycler in the United States. It operates through four segments: Steel Operations, Metals Recycling Operations, Steel Fabrication Operations, and Aluminum Operations. The Steel Operations segment offers hot rolled, cold rolled, and coated steel products; parallel flange beams and channel sections, large unequal leg angles, and reinforcing steel bars, as well as standard strength carbon.

USNAS100 | Tech Earnings & FOMC in Focus – Key Levels AheadUSNAS100 | Key Tech Earnings & Fed Risk Keep Pressure Elevated
Nasdaq 100 futures remain under pressure as markets position cautiously ahead of a critical week dominated by mega-cap technology earnings and the Federal Reserve rate decision. With growth stocks highly sensitive to rates, any shift in Powell’s tone could trigger sharp repricing across the index.
This week, earnings from Microsoft, Meta, Apple, and Tesla place added focus on forward guidance, margins, and AI-related spending—key drivers for Nasdaq direction. Until clarity emerges, traders remain defensive.
Technical Outlook
The index maintains a bearish structure while trading below 25620.
A continuation below this pivot supports further downside toward 25250, followed by 25130.
A decisive breakdown below 25130, confirmed by stability, would expose a deeper move toward 24770.
On the upside, a recovery above 25620 would allow a corrective move toward 25835.
Only a sustained move above 25835 would shift momentum bullish, opening targets toward 26170.
Key Levels
• Pivot: 25620
• Support: 25410 – 25250 – 25130
• Resistance: 25835 – 25985 – 26170

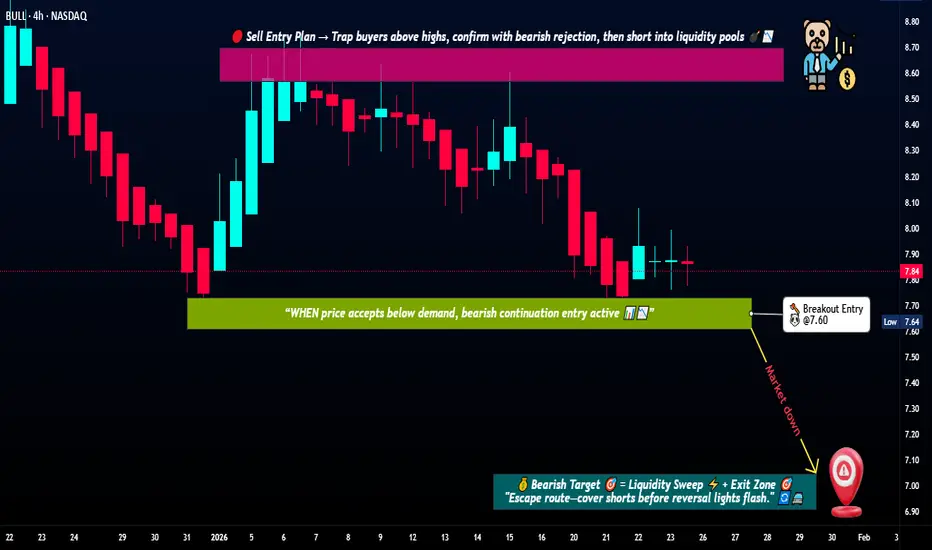
BULL | Support → Breakdown → Momentum Shift📉 BULL (Webull Corporation) — NASDAQ
Market Profit Playbook | Swing Trade Idea
🔍 Trade Bias
Primary Bias: Bearish
Trading Style: Swing Trade
Market Type: US Equities (NASDAQ)
This idea focuses on price action, structure, and confirmation-based execution, not prediction.
🧭 Technical Structure Overview
Price is testing a key demand / support zone
Market structure shows weak follow-through from buyers
Breakdown confirmation below support opens room for mean reversion
Momentum conditions suggest short-term exhaustion after failed support defense
This setup is valid only after confirmation, not anticipation.
🎯 Trade Plan (Structured & Rule-Compliant)
📍 Entry Idea
Consider short exposure only after a confirmed breakdown
Key level to watch: $7.60
Entry is valid after support failure + acceptance below the zone
🎯 Target Zone
$7.00
Area aligns with:
Prior structural reaction zone
Oversold conditions
Historical price congestion
Correlated reaction with broader risk sentiment
🛑 Risk Management (Stop Concept)
$8.10
Positioned above invalidation level
Trade thesis is invalid if price reclaims and holds above broken support
⚠️ Risk Notes (Read Carefully)
Dear Ladies & Gentlemen (Thief OG’s),
The levels shared here are reference points, not fixed instructions.
You are free to manage partials, exits, and risk according to your own plan.
🌍 Fundamental & Macro Context (Relevant to This Trade)
Company-Specific Factors
Fintech and brokerage stocks remain sensitive to volume, volatility, and sentiment
Revenue expectations are closely tied to retail trading activity
Any slowdown in participation impacts near-term valuation perception
Macro & Economic Environment
Equity markets currently react strongly to:
US interest-rate expectations
Fed communication tone
Liquidity conditions
Higher-for-longer rate narratives typically pressure growth and fintech names
Upcoming Risk Drivers to Monitor
US economic data releases (inflation, employment, PMI)
Federal Reserve statements or policy signals
Broad NASDAQ risk-on / risk-off flows
🔗 Correlated Assets to Watch ($)
These instruments help confirm or invalidate the idea:
NASDAQ:QQQ → NASDAQ risk sentiment
Weakness supports bearish continuation
AMEX:SPY → Broad market stability
Sharp rebounds may reduce downside momentum
NASDAQ:HOOD → Retail trading sentiment proxy
Relative weakness confirms sector pressure
TVC:VIX → Volatility expansion
Rising volatility often supports downside continuation
🧠 Execution Philosophy
Trade confirmation, not hope
Respect invalidation
Manage risk first, profits second
No emotional attachment to direction
✨ “If you find value in my analysis, a 👍 and 🚀 boost is much appreciated — it helps me share more setups with the community!”
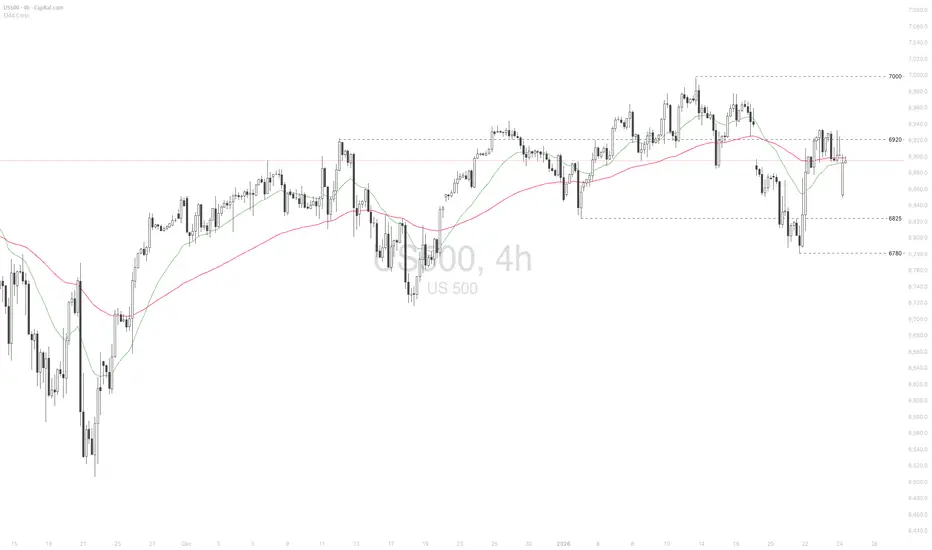
US500 range-bounded amid unresolved geopolitical uncertainty
Lingering geopolitical risks and a packed earnings calendar kept markets range-bound last week. However, easing concerns over potential US military action related to Greenland, alongside solid US economic data, helped limit downside pressure.
Intel (INTC) reported 4Q results in line with consensus, but weak 1Q guidance weighed on sentiment. While CPU demand remained strong, production and supply constraints persisted, and yields for the 18A foundry process fell short of expectations.
Despite ongoing geopolitical risks, confidence in US equities remains intact. Goldman Sachs (GS) noted a strong risk appetite extending into 1H2026, with client equity buying positions remaining solid.
US500 briefly held above the resistance at 6920 before pulling back to around the 6900 area. The index remains between both EMAs, with an unclear price structure, indicating potential consolidation within the range of 6825–6920. If the US500 breaches above EMA78 and the resistance at 6920, the index may advance toward the previous high at 7000. Conversely, if US500 fails to close above EMA21, the index may retreat further toward the next support at 6825.
Netflix - Small UpsideSince July 2025, Netflix shares have been in a corrective phase, forming wave A .
At the moment, a small move in the opposite direction is expected - a short-term upward move.
Key targets:
91 - local correction
94
96
Estimated upside potential from current levels:
Approximately 10-12%
---
Please subscribe and leave a comment!
You’ll get new information faster than anyone else.
---

Why Revenge Trading Feels Logical.. But isn'tWhy Revenge Trading Feels Logical.. But Isn’t
Welcome everyone to another educational article.
Someone recently DM’d me. They requested a post on revenge trading , so to you, this one’s for you! Enjoy mate.
Revenge trading is one of the best ways to ruin months or years of progress. Blood, sweat and tears.
What makes it deadly is that in the moment, it actually feels logical.
But it is not.
(DEFINITION) What Is Revenge Trading?
Revenge trading is the process of trading based on negative emotions rather than logic or probability. ( As you are supposed too. )
It usually takes place after the following:
• A losing trade
• A losing streak
• A missed opportunity
It shows up as:
• Increasing risk (Doubling margins)
• Forcing trades (Impatience)
• Trading without confirmation (Forcing Trades)
• Trying to “make back” what was lost (Revenge)
• Ignoring your trading plan (No longer following)
Revenge trading is not a strategy problem, it’s a psychology problem.
It happens when emotion overrides discipline.
Why Revenge Trading Feels Logical
After a loss, your brain wants relief, not stress. ( DOPAMINE )
You think:
• “I just need one good trade.”
• “I know the market owes me.”
• “If I double my size, I’ll recover faster.”
This feels logical because:
• You are still focused on the market
• You may even see a valid setup
• You are trying to restore balance emotionally, not financially
But this is not the rational side of you making decisions.
Professional traders do not increase risk after losses.
They reduce it or stop trading entirely.
Even if you see an A+ setup after five losses, that trade does not guarantee recovery & success.
If you break your system to take it, even breakeven, that is still a loss
because discipline was broken. (Talk about negative, and positive wins & losses in my previous posts)
Why Revenge Trading Is Not Logical
Revenge trading assumes:
• The market cares about your losses
• You’re “due” for a win
• Increasing risk increases certainty
None of these are true, and never will be.
The market does not know you exist.
Doubling down does not recover losses, it amplifies them.
Revenge trading replaces probability with hope, and hope is not a strategy.
How to Avoid Revenge Trading
Revenge trading cannot be eliminated but it can be controlled.
1. Add Hard Limits to Your Trading
Use tools that lock you out after a set number of trades or losses.
• Example: After 3 losing trades, you are done for the day
• Tools like Magic Keys allow this
Removing access removes temptation.
2. Use Accountability
Have someone hold you accountable:
• A trading buddy
• A shared performance log
• Daily updates on discipline, not profit
Shame & humility is a powerful discipline tool when used correctly. It is also required to grow.
3. Control Your Deposits
Most banks allow:
• Fixed recurring deposits
• Locked accounts
• Delayed transfers
Limit how much damage emotion can do in one day.
4. Fall Back to Paper Trading
If you keep losing real money:
• Stop using real money
• Paper trade
• Rebuild discipline
If you cannot control emotion without money, you will not control it with more money.
5. Replace Anger With Physical Action
Revenge trading is fueled by anger and stress.
Physical activity regulates stress hormones and releases:
• Endorphins
• Endocannabinoids
These reduce frustration and calm the nervous system.
Conclusion
Revenge trading will always exist.
It will come back again and again.
What matters is how you face it and how you respond.
Unchecked revenge trading destroys:
• Savings
• Accounts
• Confidence
• Lifetimes of work
Most people don’t realize how serious it is until it’s too late.
Trade safe.
Stay disciplined.
Thanks for reading.

I think Roblox wants it's slower, long term trendRoblox doesn't seem to have the profit growth to support such a steep uptrend. I'm speculating it will want back on it's slower long term trend line and thus $70 is my target if it begins a downtrend. If it doesn't fall below $118 then I'm at the very least expecting it to still be around $118 in 2029. We'll see.
So as always good luck!


NASDAQ (US100) – Trading Plan for Today | Jan 23🔥 NASDAQ (US100) – Trading Plan for Today | Jan 23
The previous period showed a bullish move,
followed by a consolidation phase.
Today’s session opened below the key daily level,
while the key daily level itself is located below the Point of Control,
which keeps the bearish intraday bias intact.
Primary scenario (short)
As long as price remains below the key daily level,
the downside scenario is preferred.
Targets:
– lower daily zone
– lower reverse zone
These areas may trigger a pause or a technical reaction.
Alternative scenario (long)
A long scenario will be considered
only if price accepts above the upper daily zone.
In this case, the upside target would be the upper reverse zone,
which remains a valid alternative scenario.
If the idea was useful, support it 🚀 and follow.
This is not financial advice. Risk management is required.

NQ auctions looking good for long sideAbove liquidity areas are our targets
Lets see how it goes now
Just see how it works, dont take trades on the basis of it......its only for educational purposes.

gold vs mag 7every time when gold went up stocks turn sideways
since powell jackson hole speech nasdaq is sideways while gold is flying to moon
this is inverse relation in stocks vs gold
like trump explained in davos low growth (stocks sideways) high inflation (gold up)
if nasdaq breakout this new sideways range money flow can change direction because gold could be risk for new buyers on 5k level

QFIN Buy Qfin Holdings, Inc. (NASDAQ: QFIN) – Fundamental Stock Evaluation
Company Overview
Qfin Holdings, Inc. is a China-based fintech company specializing in AI-driven credit technology solutions. The company operates a digital platform that connects borrowers with financial institutions, providing credit assessment, loan facilitation, and risk management services. QFIN primarily serves the consumer finance market in China and leverages proprietary data analytics and artificial intelligence to enhance underwriting efficiency.
Financial Performance & Profitability
QFIN demonstrates strong underlying profitability despite market volatility:
Revenue (TTM): Approximately $2.7–2.8 billion
Net Income (TTM): Approximately $950+ million
Diluted EPS (TTM): ~$6.8–7.0
Return on Equity (ROE): ~29%
The company maintains high margins and strong earnings generation, indicating an efficient and scalable business model. Profitability remains solid even under regulatory pressure, highlighting operational resilience.
Valuation Metrics
QFIN currently trades at extremely discounted valuation levels relative to its fundamentals:
P/E Ratio: ~2.4x
Price-to-Sales (P/S): < 1
Price-to-Book (P/B): Significantly below sector averages
These multiples suggest the stock is deeply undervalued, with the market pricing in elevated regulatory and macroeconomic risks.
Balance Sheet & Financial Strength
QFIN maintains a strong balance sheet:
Cash & Equivalents: ~$1.5 billion
Total Debt: ~$1.0 billion
Net Cash Position: Positive
Debt-to-Equity Ratio: ~0.28
Current Ratio: ~2.9
The company has sufficient liquidity to meet short-term obligations and sustain operations without financial stress.
Dividend & Shareholder Returns
Dividend Yield: ~9%
QFIN consistently returns capital to shareholders, making it attractive to income-focused investors.
Dividend sustainability is supported by strong free cash flow generation.
Institutional & Market Perception
While institutional ownership exists, investor sentiment remains cautious due to:
Regulatory uncertainty in China’s fintech sector
Macroeconomic slowdown concerns
Despite this, analyst consensus indicates significant upside potential, with some target prices implying 100%+ upside from current levels.
Key Risks
Regulatory Risk: Ongoing government oversight of fintech and consumer lending in China
Market Volatility: High price fluctuations
Macroeconomic Exposure: Slower credit demand during economic downturns
These risks largely explain the valuation discount.
Investment Thesis
QFIN represents a high-risk, high-reward value opportunity:
✔ Strong profitability and cash flow
✔ Attractive dividend yield
✔ Solid balance sheet
❗ Significant regulatory and geopolitical risk
Conclusion:
QFIN appears fundamentally undervalued, but it is best suited for investors with a long-term horizon and high risk tolerance, particularly those seeking value and income opportunities in emerging markets.
