NASDAQ100 Breakout Watch — Is a New Upside Leg Starting Now?📈 NASDAQ100 Swing Trade Opportunity — Bullish Breakout Play
🟩 Asset: NASDAQ100 (Index CFD)
⚡ Trade Type: Swing Trade — Bullish Plan Confirmed
🧭 Trade Thesis
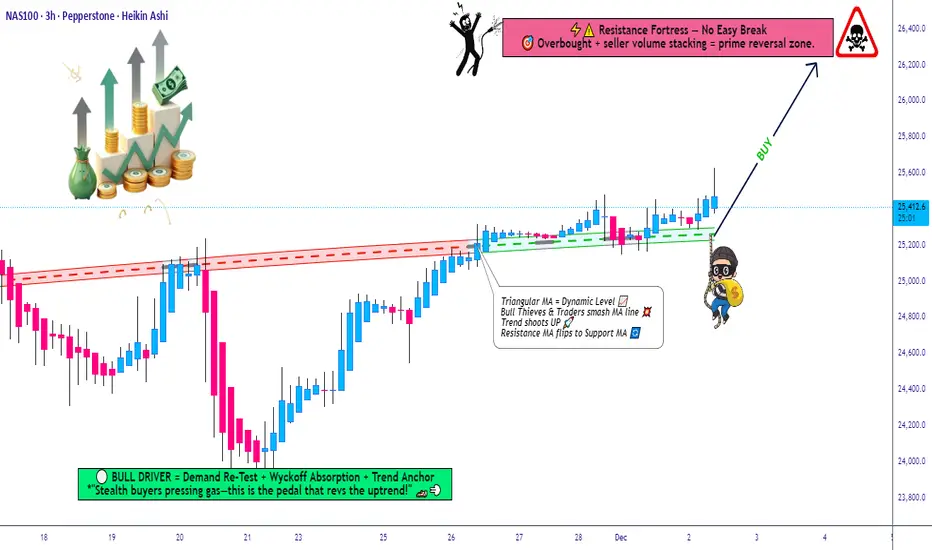
The index has confirmed a bullish setup following a Triangle + Moving Average breakout, strengthening upward momentum and favoring dip-buying behavior.
To reflect the Thief layering method, this plan uses multiple staggered limit orders to accumulate positions efficiently across volatility pockets.
📌 Entry Plan (Thief Layering Method)
💰 Entry Style: “Any price level allowed — Thief uses layers”
Buy Limit Layers:
24,900
25,000
25,100
25,200
(Feel free to increase or customize layers to fit your personal risk and liquidity preference.)
🛑 Stop-Loss (SL)
🔻 Thief SL: 24,500
Dear Ladies & Gentlemen (Thief OG’s), adjust SL based on your personal risk and strategy.
This is not a fixed recommendation, only a reference zone.
🎯 Target (TP)
⚡ The High-Voltage Electric Gate Zone around 26,200 acts as major resistance because of:
Overbought readings
High-liquidity trap behavior
Historical reversal probability
Exit with profits before heavy sellers activate.
Again — you decide your own TP based on your risk tolerance, not mine.
📊 Market Logic Behind the Move
Breakout structure confirmed
Trend continuation supported by triangle compression
Index ETF flows show short-covering + rotation back into tech
Momentum accelerates above 25,200 zones
Cleaner upside path until liquidity wall at 26,200
🔎 Related Pairs to Watch (Correlation Insight)
1️⃣ NASDAQ:NDX / NASDAQ:QQQ
Direct ETF mirror of NASDAQ100
Useful for checking volume, market depth, and real-time breakout confirmation
2️⃣ SP:SPX / NYSE:ES (S&P 500)
High correlation (approx. 0.85+)
A strong SPX supports tech continuation; weakness warns of index-wide pullback
3️⃣ TVC:VIX (Volatility Index)
Inverse correlation
If VIX stays below key volatility thresholds, bullish NASDAQ continuation is more reliable
4️⃣ FX:USDOLLAR / DXY
Tech usually performs better when the Dollar weakens
A rising Dollar can slow or cap NASDAQ bullish momentum
5️⃣ TVC:US10Y / Yields
NASDAQ moves inversely with yields
If yields drop, NASDAQ accelerates
If yields spike, prepare for turbulence or failed breakouts
📘 Summary
Bullish plan confirmed via Triangle + MA Breakout
Thief layering entries positioned smartly into volatility
SL/TP guidance flexible for trader customization
Strong correlation checks available across SP:SPX , TVC:VIX , TVC:DXY & yields
Nasdaq100long
Nasdaq100OANDA:NAS100USD
3. And Then price will begin to push down strong. This will happen only if there will be a very strong spike meaning an incredible amount of sells pushing the price down.

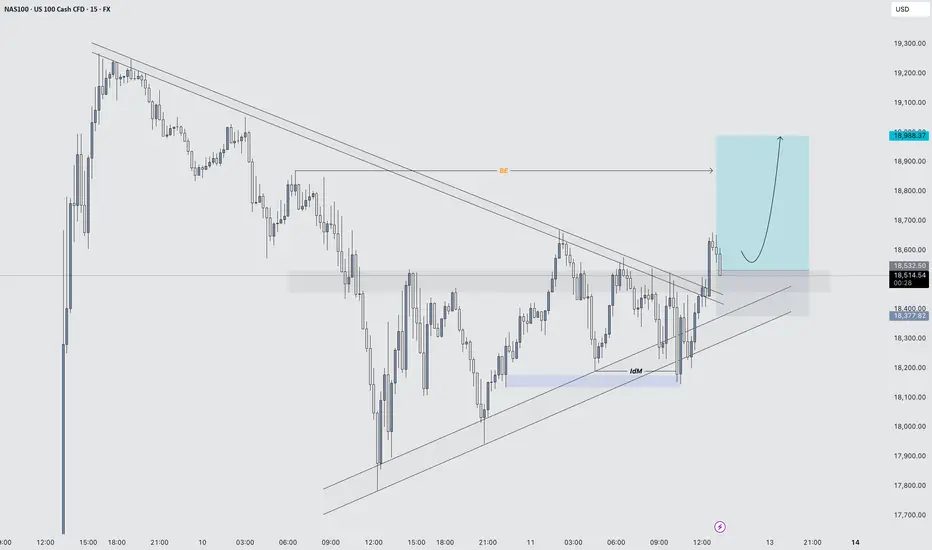
NAS100 (15min) – Bullish Entry Activated1. Symmetrical Triangle Formation
Price was compressing inside a symmetrical triangle, with a series of lower highs and higher lows, indicating indecision and buildup of pressure.
2. Downside Fake-out (False Breakout)
Price briefly broke below the lower trendline, suggesting a potential bearish breakout.
However, there was no strong follow-through; instead, price quickly reclaimed the trendline and pushed back inside the structure.
This is a classic fake-out, often trapping late sellers and providing liquidity for buyers.
The rejection from the lows resulted in a long wick, signalling strong buying interest and failure to break down.
3. Aggressive Bullish Reaction
After reclaiming the triangle support, price moved rapidly back to the top of the triangle.
The next key move was a strong breakout above the upper trendline, confirming bullish intent.
4. Break and Retest
Price action followed through with a clean breakout above resistance, followed by a minor pullback and retest of the broken trendline, which held as support.
This retest offered a textbook entry point based on price action principles.
5. Bullish Structure Confirmation
Post breakout, price formed a higher low and continued to make a higher high, confirming a trend shift.
This structural change strengthens the bullish outlook.
Nasdaq onwards and upwards to ATH at 16,500Extended W Formation has formed on Nasdaq.
SImilar to Dow Jones.
They seem to be leading indices which could drive up the JSE ALSI 40 along with it.
We need to bne open minded for potential change ahead but trade according to what we SEE rather than what we feel.
Other indicators are showing upside to come.
7>21>200
RSI>50
Price breakout downtrend
Target 16,500

Simple analysis for #nas100As you can see by your self the bearrish period ends at 26 October and we joined at this week at a small bullish trend.Is time for bullish actions and here is one idea of a good trade.Enjoy!

NDQ100 Bullish Week 10/16/23Expectations for Nasdaq: Bullish
Stop Loss: 14964.25 (indicated by red dash line)
Take Profit: 15404.63 (Bonus- 15474.63)
Support and resistance areas this week indicated by orange lines.
Prepare > Prediction

NASDAQ 100 Analysis! Will it Reach 14000 ?NASDAQ 100 Weekly Analysis!
Bullish View on NASDAQ 100!
NASDAQ 100 Expecting 14000 Level!
NASDAQ 100 Moving as per Double Bottom Pattern Analysis!
NASDAQ 100 formed a Double Bottom Pattern after a decent downtrend. The index gave breakout to the neck level and did retest to it. After that index moving in upward direction. Now price is moving in a range like strong consolidation is happening inside this range. The RSI also in uptrend and taking nice support on the support trendline. As per Double Bottom Pattern Analysis, I have projected the target at 14027.85 level. Hope the index will touch 14000 level in upcoming weeks.

NASDAQ100SKILLING:NASDAQ
This could be a break to the upside of 12127.00
If this goes up, it could break the next price of 13000.00
My crazy prediction is the price hitting 13721.8.
Let me see how it goes.

Nasdaq100 What Now Episode 153Brand new day. It's "Wednesday" in Nasdaq100. Not the best days.. especially since the news mostly interupts. The lady is still in a downtrend-range.
One that is filled with, Lhs and Lls. My bias remains bearish till a CIS (change in structure) which is: a break past Lhs and new Hhs/Hls are visible.
Let the market decide, always!..
December: 2W (2 trades)

NASDAQ100his could be a break to the upside of 12127.00
If this goes up, it could break the next price of 13000.00
My crazy prediction is the price hitting 13721.8.
Let me see how it goes. SKILLING:NASDAQ

NASDAQ 100 Long: Bullish Engulfing Candle at LHThe trend is upwards on 15 min chart.
Bullish Engulfing candle at the LH will now move towards the next HH.


NASDAQ100 Long I believe that NASDAQ100 is going to retest support then go up to resistance and retest support again before exploding upwards for a long

NASDAQ100 LONG WITH HIGH LEVER AND REASONABLE TO YOU TARGET GOODIn the 1h Frame Nasdaq100 confirm the rising triangle pattern.
nasdaq100 buy : $10025
target : $10192
stop loss : $9988
Wish you good deals!
