US100 Short From Resistance!
HI,Traders !
#US100 made a retest
Of the horizontal resistance
Of 25725.0 from where we
Are already seeing a local
Bearish reaction so a further
Move down is to be expected !
Comment and subscribe to help us grow !
Nasdaqanalysis

Nasdaq - Stocks are just heading higher!🚀Nasdaq ( TVC:NDQ ) is creating new all time highs:
🔎Analysis summary:
Tech stocks just finished an extremely strong year and we were offered quite a lot of buying opportunities during 2025. Looking at the higher timeframe, we could see a short term retracement going into 2026, but the underlying trend remains totally bullish.
📝Levels to watch:
$25,000
SwingTraderPhil
SwingTrading.Simplified. | Investing.Simplified. | #LONGTERMVISION

NASDAQ NAS100 Technical Analysis and Trade IdeaThe NAS100 is currently in a strong bullish trend 🚀. Price has been pushing higher with momentum and is now trading into a key resistance zone. We could see a short-term pullback as traders lock in profits, but overall, the trend looks ready to continue ↗️.
Keep an eye on any market-moving events later today—they could either accelerate the trend or trigger a deeper retracement. If the bullish momentum holds, a pullback might offer a good opportunity to join the trend for a continuation trade 💪.
⚡ Key Points:
NAS100 trending bullish 📈
Approaching resistance, watch for pullback ↘️
Potential continuation trade on strength 🔥

US Tech 100 NASDAQ Structural Bearish Shift
IG:NASDAQ
Structural Bearish Shift Explained
Multi-Timeframe Price Action Breakdown (1D → 4H)
This analysis focuses purely on market structure, liquidity, and intention.
🔹 1D CONTEXT — MARKET STRUCTURE SHIFT
On the Daily timeframe, the market printed a clear bearish Market Structure Shift (MSS):
• The prior bullish sequence (HH → HL) was invalidated
• Price broke the key HL, officially changing the higher-timeframe flow
• This confirms a bearish structural bias on 1D
The critical detail is where the shift originated.
⸻
🔹 ORIGIN OF THE 1D MSS (KEY DETAIL)
The Daily MSS was caused by an internal high, not by a macro LH:
• This internal high was the impulsive driver that broke the Daily HL
• Once the HL failed, that internal high became:
• The origin of the bearish shift
• A high-probability liquidity pool
This distinction matters.
The market is not reacting randomly — it is respecting structural causality.
⸻
🔹 1D LIQUIDITY SWEEP = MITIGATION, NOT BREAKOUT
After the MSS, price returned precisely to that internal high and:
• Swept liquidity above it
• Took stops from:
• Early shorts
• Late breakout longs
• Failed to accept above the level
• Closed back below the sweep zone
This move is best defined as:
Daily mitigation of the MSS origin, not an attempt at bullish continuation.
No acceptance = no bullish intent.
🔹 4H CONFIRMATION — INTERNAL ALIGNMENT
Dropping to 4H, the lower-timeframe behavior aligns perfectly with the Daily narrative:
• A 4H bearish MSS printed
• Followed by a 4H BOS to the downside
• A clean bearish Fair Value Gap (FVG) was left behind
• Price expanded impulsively away from that imbalance
This tells us:
• The Daily mitigation triggered internal distribution
• Lower timeframes accepted the bearish flow
• Momentum is now aligned top-down
⸻
🔹 WHAT THIS TELLS US ABOUT MARKET INTENT
Putting it all together:
• ✅ Daily bearish MSS defines bias
• ✅ Liquidity above the MSS origin has been fully mitigated
• ✅ 4H structure confirms bearish continuation
• ❌ No bullish acceptance or expansion above key levels
This is not a failed breakout
This is a structural transition from accumulation to distribution
⸻
🔹 KEY TAKEAWAY
After a Daily Market Structure Shift, the market revisited the exact internal high that caused the shift, swept liquidity, failed to accept higher prices, and aligned lower-timeframe structure to the downside.
Bias: Bearish
Framework: Structure → Liquidity → Acceptance
Not financial advice.
AI Generated.

Nasdaq - The final blow-off top!⚰️Nasdaq ( TVC:NDQ ) can rally a final +25%:
🔎Analysis summary:
Just this month, we witnessed quite some volatility on the Nasdaq with a correction of about -10%. However, bulls immediately stepped in and clearly pushed price higher. Since there is still bullish pressure, a final blow-off top rally in the near future is quite likely.
📝Levels to watch:
$25,000 and $30,000
SwingTraderPhil
SwingTrading.Simplified. | Investing.Simplified. | #LONGTERMVISION

NAS100 Retest of POC: Bullish Break or Deeper Correction?I'm keeping a close eye on NASDAQ (NAS100) right now 📉📈. We’re seeing a deep pullback—a strong retracement that makes everyone ask the classic question:
Does this want to keep pushing lower and give us a bearish weekly candle, or is it gearing up to hold a level and rally back with the higher-timeframe trend?
For me, I’m a trend-continuation trader. Even if the weekly candle prints bearish, I’m not interested in selling into higher-timeframe strength. I’d rather stay patient and stick with the bigger trend direction 🧭.
Here’s the key level I’m watching:
If NAS100 can break back above the Volume Profile POC (Point of Control) — which is basically the high-value area acting as support right now — then I’ll be looking for long opportunities.
But if price breaks below the POC, that invalidates the idea and I’ll step aside. No need to force anything 👍.
Not financial advice ⚠️

NASDAQ 100: Bullish! Look For Valid Buys With The Trend!Welcome back to the Weekly Forex Forecast for the week of Dec. 1-5th.
In this video, we will analyze the following FX market: NASDAQ (NQ1!) NAS100
The NASDAQ closed last week strong. It would indicated the potential for follow through going into this week, at least early.
Bear in mind that the previous 3 weeks were very bearish, coming down from ATHs, and forming a bearish MSS.
Look out for confirmations for valid trades. The overall trend is bullish, so I am personally looking for valid buys. A bearish MSS would invalidate those ideas.
Enjoy!
May profits be upon you.
Leave any questions or comments in the comment section.
I appreciate any feedback from my viewers!
Like and/or subscribe if you want more accurate analysis.
Thank you so much!
Disclaimer:
I do not provide personal investment advice and I am not a qualified licensed investment advisor.
All information found here, including any ideas, opinions, views, predictions, forecasts, commentaries, suggestions, expressed or implied herein, are for informational, entertainment or educational purposes only and should not be construed as personal investment advice. While the information provided is believed to be accurate, it may include errors or inaccuracies.
I will not and cannot be held liable for any actions you take as a result of anything you read here.
Conduct your own due diligence, or consult a licensed financial advisor or broker before making any and all investment decisions. Any investments, trades, speculations, or decisions made on the basis of any information found on this channel, expressed or implied herein, are committed at your own risk, financial or otherwise.

Nasdaq NAS100 Analysis: The Conditions I Need Before Going ShortI'm keeping a close eye on NAS100 (Nasdaq) right now. 📉✨ On the 4H timeframe, price remains in a clean, sustained bearish trend, and I'm anticipating a potential continuation lower.
If price rejects the current level and fails to retrace through the 1H imbalance, and we see a rotation followed by a bearish break of structure, I'll be preparing for a short opportunity. 📊🔻
Not financial advice.

NASDAQ 100 (NQ1!): Wait For Price To Reach -FVG!Welcome back to the Weekly Forex Forecast for the week of Nov. 17-21st.
In this video, we will analyze the following FX market: NASDAQ (NQ1!) NAS100
The NASDAQ gave some bearish-neutral price action last week. It ended in a doji candle, not giving us much in the way of directioin. But, there is a bearish FVG on the Daily TF formed. The reaction to it will provide all the insight we need regarding the directional bias of this market for this coming week.
If the -FVG holds, sell it. If it is disrespected, buy it.
Simple.
Enjoy!
May profits be upon you.
Leave any questions or comments in the comment section.
I appreciate any feedback from my viewers!
Like and/or subscribe if you want more accurate analysis.
Thank you so much!
Disclaimer:
I do not provide personal investment advice and I am not a qualified licensed investment advisor.
All information found here, including any ideas, opinions, views, predictions, forecasts, commentaries, suggestions, expressed or implied herein, are for informational, entertainment or educational purposes only and should not be construed as personal investment advice. While the information provided is believed to be accurate, it may include errors or inaccuracies.
I will not and cannot be held liable for any actions you take as a result of anything you read here.
Conduct your own due diligence, or consult a licensed financial advisor or broker before making any and all investment decisions. Any investments, trades, speculations, or decisions made on the basis of any information found on this channel, expressed or implied herein, are committed at your own risk, financial or otherwise.

US100NASDAQ ( US - 100 )
- Completed " 12345 " Impulsive Waves
- Break of Structure
- Demand Zone
- RSI - Divergence
- Order Block

NAS100 Bullish Structure Break with Key Fibonacci Level in PlayThe NAS100 is now showing clear signs of strength, with a solid bullish move and a confirmed break of structure on the 4-hour timeframe 🚀. With this shift, the focus turns to how price behaves on the pullback.
The main level of interest is the 61.8% Fibonacci retracement of the current swing. A buy setup becomes valid only if price retraces and holds above the 61.8 level 🔥. Holding above this zone would indicate a shallow pullback — a strong sign that buyers are stepping in aggressively and maintaining control.
If price respects the 61.8 and then breaks structure to the upside again, that’s the confirmation needed to look for long opportunities 📊.
However, if price breaks below the 61.8 level, the idea is invalidated and should be abandoned. A deeper retracement may signal weakness, although it could also be a smart-money liquidity run before a continuation — either way, the priority is to see momentum hold above 61.8 to keep the bullish narrative intact ⚠️.
Not financial advice.

US100 Resistance Cluster!
HI,Traders !
#US100 made a bullish
Rebound But has now Near hit a resistance
Cluster of the horizontal and
Falling resistance lines
Around 25395.4 area From where we will be
Expecting a bearish move down !
Comment and subscribe to help us grow !

NAS100 Trade Plan: Counter-Trend Opportunity Into Friday CloseI’m currently watching the NASDAQ NAS100 📊 and looking for a potential setup as we head into the Friday close. The market has pushed into the weekly low, and I’m anticipating the possibility of a retracement, which could offer a counter-trend opportunity during the New York session. 🚀📉📈 All details are broken down clearly in the video — this is not financial advice. ⚠️

NASDAQ NAS100 Under Pressure – Watching for a Break of StructureThe NASDAQ is currently showing signs of weakness on the 4-hour chart. Sellers are gradually stepping in, and we can see US100 bearish momentum starting to take control. The market is under pressure, and price action is hinting at potential continuation to the downside.
I’ll be watching closely for a NAS100 break below the current range low — if price retests that level and fails to reclaim it, that would confirm a bearish market structure shift 🔻. Such a setup could provide a high-probability short opportunity as momentum accelerates to the downside.
⚠️ This is not financial advice — purely for educational and analytical purposes.

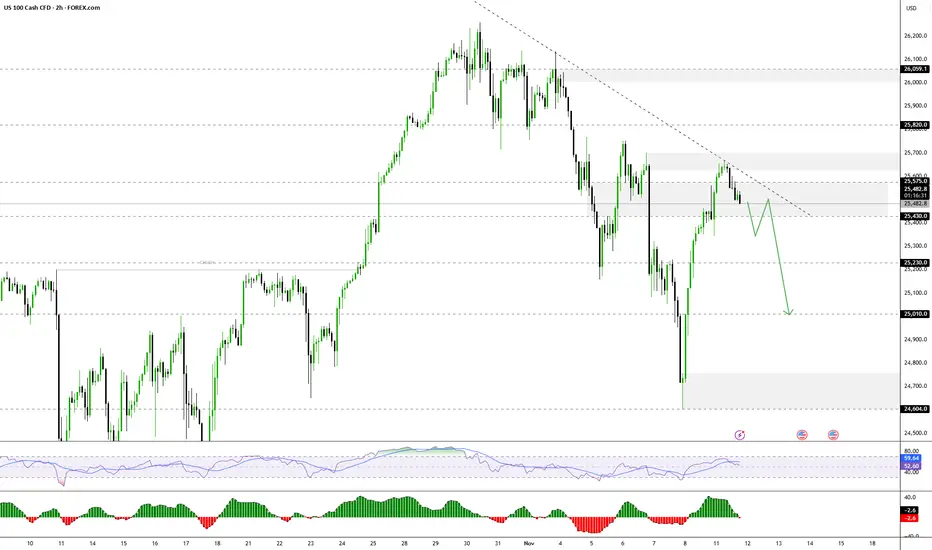
Nasdaq Potential for Further CorrectionThe NASDAQ index currently appears to be in a short-term correction, with the price likely to retest 25430 from 25570 before further movement.
- Above 25430–25575: Bullish continuation towards 25700 → 25820 → 25960.
- Below 25430: Bearish momentum is likely towards 25230 → 25010.
Nasdaq - The most important structure!💰Nasdaq ( TVC:NDQ ) perfectly respects structure:
🔎Analysis summary:
Over the course of the past couple of months, the Nasdaq has been rallying an expected +50%. Still, until the Nasdaq will retest the upper channel resistance trendline, this rally won't be over. Therefore, we can still see a rally of another +10% in the very near future.
📝Levels to watch:
$25,000 and $30,000
SwingTraderPhil
SwingTrading.Simplified. | Investing.Simplified. | #LONGTERMVISION

Nasdaq Fails to Return to Record HighsOver the past six trading sessions, the Nasdaq index has begun to show a notable bearish correction of more than 2.6% in the short term, reinforcing a downward bias that remains active at this stage. So far, the selling pressure has persisted as the market grows increasingly concerned about the performance of several companies linked to artificial intelligence, which have maintained significant valuations without yet reporting profits strong enough to justify those price levels. This situation has started to raise warning signals and trigger a short-term decline in confidence, which, if sustained, could become a key driver of stronger selling pressure in Nasdaq movements over the coming sessions.
Uptrend Still Holding
Despite recent corrections, the Nasdaq index has managed to preserve a steady upward trendline since around April 14 of this year, and so far, there has not been a strong enough sell-off to cause a meaningful break of this trend in the short term. However, if the current selling pressure continues, it could increase the risk of weakening the buying trendline, which has recently entered a phase of consolidation or pause over the past few sessions.
RSI
The RSI indicator line remains oscillating close to the 50 level, suggesting a technical balance between buying and selling strength over the average impulses of the last 14 trading sessions. As long as this behavior persists, the market may enter a more pronounced phase of indecision in the short term, reflecting the absence of a clear directional bias in price movements.
MACD
The MACD indicator, meanwhile, has started to show a neutral pattern, as its histogram continues to approach the zero line. This indicates indecision in the strength of short-term moving averages and could be signaling the formation of a more significant technical neutrality, where the market seeks an equilibrium point before defining a new directional move.
Key Levels to Watch:
26,000 points – Main resistance: Corresponds to the recent record highs and stands as the most important bullish barrier to watch. Movements that manage to hold above this level could confirm a stronger buying bias, potentially allowing the uptrend to continue on the chart.
25,115 points – Near support: This zone coincides with the most recent price retracements and could act as a technical barrier against potential short-term downward corrections.
23,800 points – Critical support: This level corresponds to the 23.6% Fibonacci retracement on the chart. Bearish movements that reach and break below this area could put the current trendline at risk and generate a stronger selling bias in the short term.
Written by Julian Pineda, CFA – Market Analyst

Nasdaq NAS100 Bulls Regain Control: What I’m Watching Next📈 On the 4-hour NASDAQ chart, we can clearly see a break in structure to the upside, signaling strong bullish momentum entering the market. 🟩 The buyers are showing strength, and I’ll be looking to capitalize on this momentum — but only if we see a confirmed break of the current swing high, followed by a retracement into the retest zone. 🔁
However, patience is key. ⏳ I’ll only look to engage if today’s New York session data release aligns with and supports the bullish bias. Fundamentals and technicals must work together before I take a position.
As mentioned in the video, if the anticipated price action fails to materialize, we’ll simply abandon this setup and move on — staying disciplined is crucial. 🚫
⚠️ Disclaimer: This analysis is for educational purposes only and not financial advice.

NAS100 | Bearish Momentum Extends The Nasdaq 100 fell about 2.1% (~500 points) as projected, maintaining a bearish outlook while technology stocks continued to weigh on market sentiment.
Below 25,700: Bearish continuation towards 25,340 → 25,230 → 25,000.
Above 25,700: Short-term recovery towards 25,820 → 26,170.

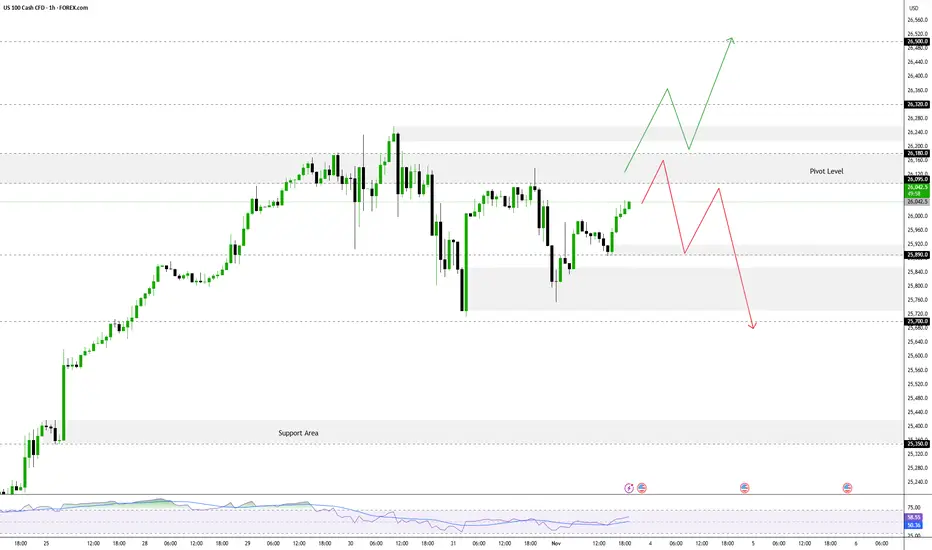
NASDAQ Testing Pivot Zone, Awaiting Breakout The FOREXCOM:NAS100 is currently testing a key zone called the Pivot Zone (a direction-determining area). The short-term trend will be determined by whether the price manages to stay below or break above this zone.
Pivot Zone: 26,095 – 26,180
As long as the price trades below this zone, short-term momentum remains bearish (tending to fall).
➡️ Bearish Scenario
If the price remains below 26,180, the negative bias will continue, with the following main targets:
- Target 1: 25,890
- Target 2: 25,700
- Target 3: 25,340
⬆️ Bullish Scenario
If a breakout and confirmation occurs above 26,180, this could signal the start of a new bullish trend, with the following targets:
- Target 1: 26,500
- Target 2: 26,850
USNAS100 remains bearish below 26,180, but a confirmed break above this level could signal the start of a new bullish leg.
NASDAQ 100 (NQ1!): Bullish! Buy This Dip!Welcome back to the Weekly Forex Forecast for the week of Nov. 3 - 7th.
In this video, we will analyze the following FX market: NASDAQ (NQ1!) NAS100
The NASDAQ reached all time highs last week, then started a pullback, landing in a +FVG.
As the +FVG continues to hold, look for valid buy setups to form.
Sells are not valid, my friends. Go with the trend!
Enjoy!
May profits be upon you.
Leave any questions or comments in the comment section.
I appreciate any feedback from my viewers!
Like and/or subscribe if you want more accurate analysis.
Thank you so much!
Disclaimer:
I do not provide personal investment advice and I am not a qualified licensed investment advisor.
All information found here, including any ideas, opinions, views, predictions, forecasts, commentaries, suggestions, expressed or implied herein, are for informational, entertainment or educational purposes only and should not be construed as personal investment advice. While the information provided is believed to be accurate, it may include errors or inaccuracies.
I will not and cannot be held liable for any actions you take as a result of anything you read here.
Conduct your own due diligence, or consult a licensed financial advisor or broker before making any and all investment decisions. Any investments, trades, speculations, or decisions made on the basis of any information found on this channel, expressed or implied herein, are committed at your own risk, financial or otherwise.

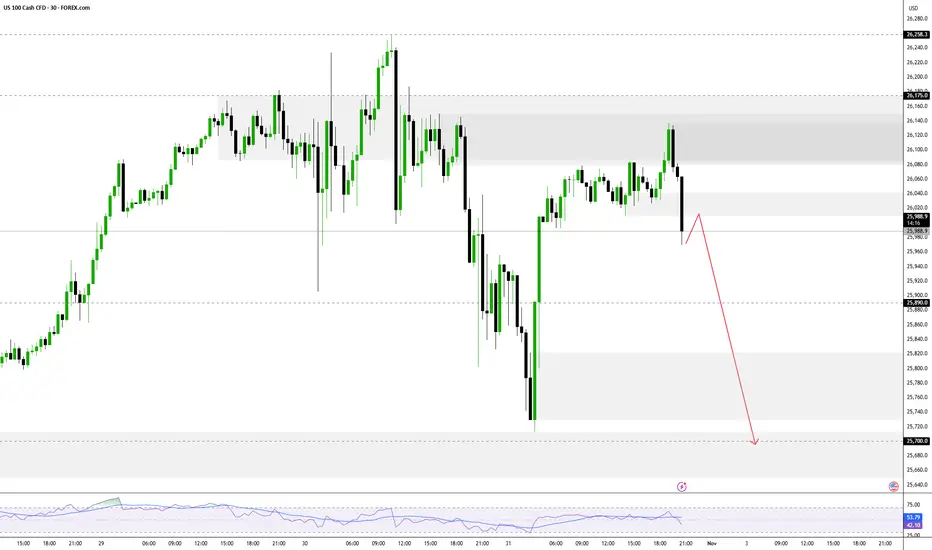
Reversal From ATH, Momentum Turns Cautious Reversal From ATH, Momentum Turns Cautious
The NASDAQ reversed from its all-time high and remains below 26,175, signaling short-term bearish momentum.
➡️ Below 26,175: Bearish bias toward 25,890 → 25,700 → 25,340.
➡️ Above 26,245: Bullish continuation toward 26,500 → 26,850.
Pivot POINT: 26,175
Support: 25,890 · 25,700 · 25,340
Resistance: 26,500 · 26,850 · 27,000
USNAS100 remains bearish while below 26,175, but a 1H close above 26,245 would confirm a bullish breakout toward higher targets.
Nasdaq100 Breakout Map – Bullish Targets Ahead?🕵️♂️ NDX/US100 “NASDAQ100” Market Wealth Strategy Map (Swing/Day Trade) 🚀
📊 Plan: Bullish Bias (Swing/Day Trade)
🎯 Entry Idea (Thief Layering Style):
Using a layering strategy (multiple limit orders). My preferred buy zones are:
🟢 24,300
🟢 24,400
🟢 24,500
🟢 24,600
(Feel free to adjust/add layers based on your own style — flexibility is key.)
🔒 Protective Stop (Thief SL):
❌ Around 24,000 (but note: this is just my map, you can manage risk as per your own plan).
💰 Target Area (Profit Zone):
🚧 25,500 = strong resistance barricade + overbought region + potential bull trap.
✅ My preferred exit: 25,400 (just before the “police barricade” 🚓).
⚠️ Note for Thief OG’s:
I’m not recommending to only follow my SL/TP. This is an educational trade map, not a fixed financial call. Adapt, adjust, and take profits your way.
🔑 Key Catalysts & Correlation Map:
Tech Sector Strength: US100 often mirrors mega-cap tech momentum ( NASDAQ:AAPL , NASDAQ:MSFT , NASDAQ:NVDA ).
Risk-On/Off Mood: Watch TVC:VIX — if fear spikes, layers may fill quicker.
Dollar Impact: TVC:DXY weakness often fuels NASDAQ:NDX upside.
Bond Yields: Higher yields = pressure on tech. Keep TVC:US10Y in your radar.
📌 Other Related Charts to Watch:
SP:SPX / CME_MINI:ES1! → Correlated US equity benchmark.
TVC:DXY → Inverse correlation (watch dollar moves).
TVC:VIX → Volatility indicator for risk sentiment.
BITSTAMP:BTCUSD → Risk sentiment cousin, moves with tech flows sometimes.
✨ “If you find value in my analysis, a 👍 and 🚀 boost is much appreciated — it helps me share more setups with the community!”
⚠️ Disclaimer:
This is a Thief Style Trading Strategy Map — created for fun, educational purposes, and market observation only. Not financial advice. Trade at your own risk, ladies & gentlemen. 🕵️♂️💸
#NASDAQ100 #NDX #US100 #SPX #Stocks #Indices #Trading #SwingTrade #DayTrade #LayeringStrategy #ThiefTrader
